West Slope neighborhood in Jersey City, New Jersey (NJ), 07307 detailed profile
Settings
X

Business Search - 14 Million verified businesses
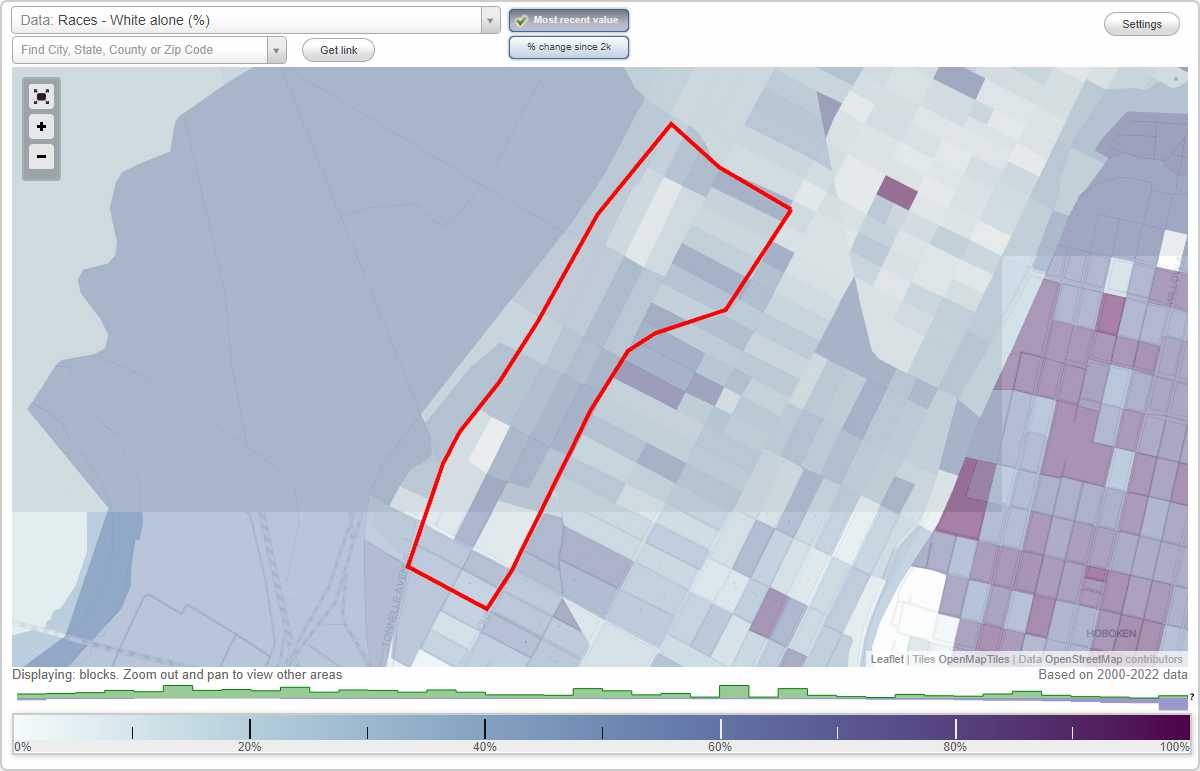
Area: 0.296 square miles
Population: 9,165
Population density:
| West Slope: | 30,920 people per square mile |
| Jersey City: | 19,218 people per square mile |

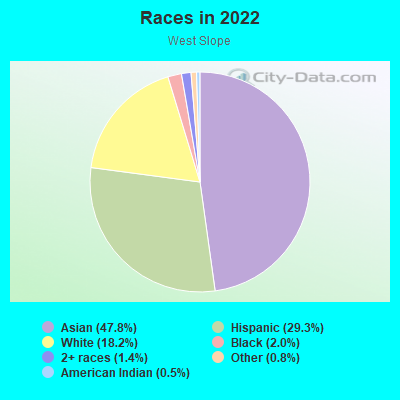
- 4,43747.8%Asian
- 2,71529.3%Hispanic or Latino
- 1,68518.2%White
- 1872.0%Black
- 1291.4%Two or more races
- 720.8%Some other race
- 480.5%American Indian
Median household income in 2022:
| West Slope: | $73,145 |
| Jersey City: | $94,080 |
Distribution of median household income
![Distribution of median household income]()
- 60Less than $10,000
- 419$10,000 to $19,999
- 133$20,000 to $29,999
- 540$30,000 to $39,999
- 245$40,000 to $49,999
- 213$50,000 to $59,999
- 336$60,000 to $74,999
- 541$75,000 to $99,999
- 200$100,000 to $124,999
- 325$125,000 to $149,999
- 393$150,000 to $199,999
- 261$200,000 or more

Distribution of owner-occupied house/condo value
![Distribution of owner-occupied house/condo value]()
- 255Less than $50,000
- 32$50,000 to $99,999
- 55$100,000 to $149,999
- 115$150,000 to $199,999
- 104$200,000 to $249,999
- 85$250,000 to $299,999
- 92$300,000 to $399,999
- 390$400,000 to $499,999
- 346$500,000 to $749,999
- 357$750,000 to $999,999
- 164$1,000,000 or more

Distribution of rent paid by renters
![Distribution of rent paid by renters]()
- 62Less than $100
- 810$100 to $199
- 201$200 to $299
- 284$300 to $399
- 329$400 to $499
- 251$500 to $599
- 322$600 to $699
- 316$700 to $799
- 105$800 to $899
- 138$900 to $999
- 269$1,000 to $1,249
- 544$1,250 to $1,499
- 755$1,500 to $1,999
- 332$2,000 or more

Median rent in 2022:
| West Slope: | $1,540 |
| Jersey City: | $1,738 |
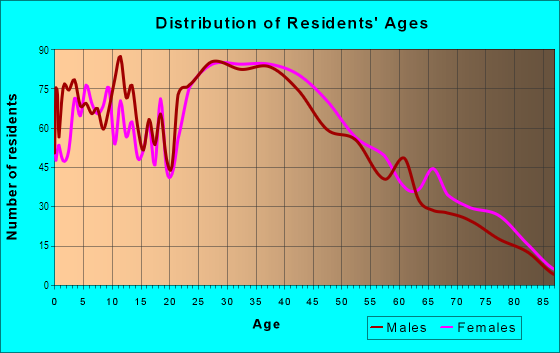
| Males: | 4,453 |
| Females: | 4,711 |
Males:
| This neighborhood: | 38.4 years |
| Whole city: | 34.1 years |
| This neighborhood: | 36.0 years |
| Whole city: | 36.2 years |
Average household size:
| West Slope: | 6.2 people |
| Jersey City: | 2.2 people |
Percentage of family households:
| West Slope: | 52.1% |
| Jersey City: | 39.8% |
| Here: | 43.8% |
| Jersey City: | 34.2% |
Percentage of married-couple families with children (among all households):
| West Slope: | 29.9% |
| Jersey City: | 29.4% |
Percentage of single-mother households (among all households):
| West Slope: | 4.7% |
| Jersey City: | 13.3% |
Percentage of never married males 15 years old and over:
Percentage of never married females 15 years old and over:
| West Slope: | 17.7% |
| Jersey City: | 23.6% |
Percentage of never married females 15 years old and over:
| West Slope: | 16.7% |
| city: | 22.6% |
Percentage of people that speak English not well or not at all:
| West Slope: | 10.1% |
| Jersey City: | 7.2% |
Percentage of people born in this state:
Percentage of people born in another U.S. state:
Percentage of native residents but born outside the U.S.:
Percentage of foreign born residents:
| Here: | 30.0% |
| Jersey City: | 34.5% |
Percentage of people born in another U.S. state:
| West Slope: | 10.7% |
| Jersey City: | 22.1% |
Percentage of native residents but born outside the U.S.:
| Here: | 5.0% |
| city: | 3.8% |
Percentage of foreign born residents:
| Here: | 54.4% |
| Jersey City: | 39.6% |
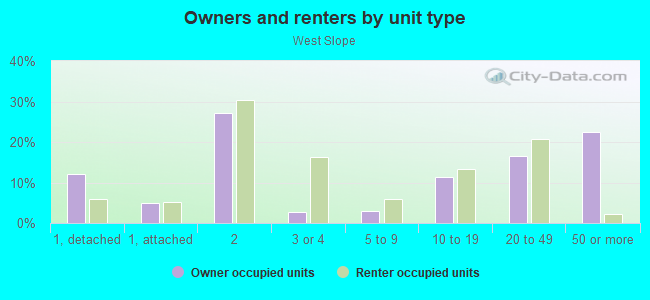
Owner-occupied
Renter-occupied

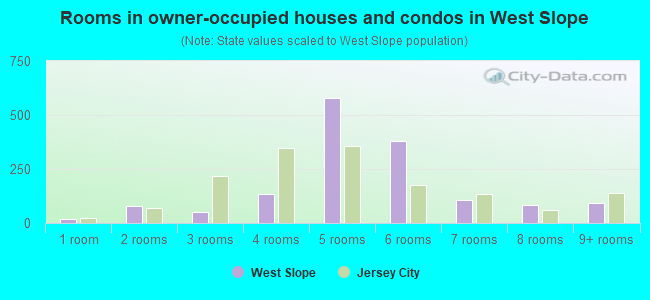
- Rooms in owner-occupied houses and condos in West Slope
- 181 room
- 772 rooms
- 513 rooms
- 1334 rooms
- 5815 rooms
- 3816 rooms
- 1077 rooms
- 828 rooms
- 949+ rooms
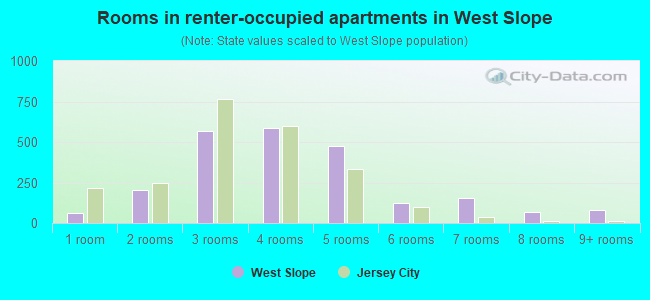
- Rooms in renter-occupied apartments in West Slope
- 611 room
- 2062 rooms
- 5703 rooms
- 5874 rooms
- 4775 rooms
- 1226 rooms
- 1537 rooms
- 668 rooms
- 829+ rooms
Owner-occupied
Renter-occupied
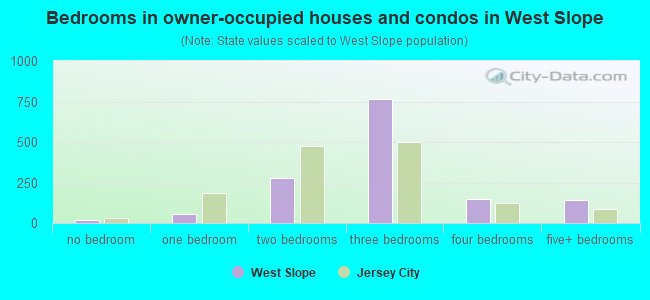
- Bedrooms in owner-occupied houses and condos in West Slope
- 18no bedroom
- 581 bedroom
- 2762 bedrooms
- 7653 bedrooms
- 1494 bedrooms
- 1435+ bedrooms
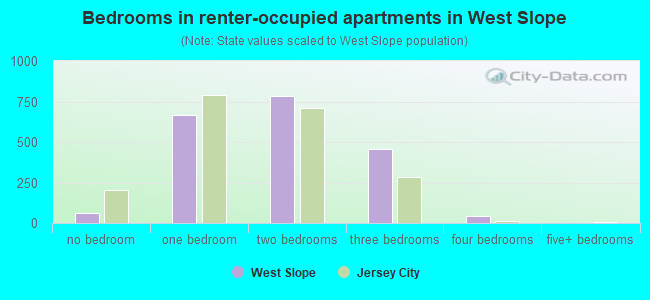
- Bedrooms in renter-occupied apartments in West Slope
- 61no bedroom
- 6651 bedroom
- 7822 bedrooms
- 4593 bedrooms
- 464 bedrooms
- 05+ bedrooms
Average number of cars or other vehicles available in houses/condos:
Average number of cars or other vehicles available in apartments:
| This neighborhood: | 1.5 |
| Jersey City: | 1.3 |
Average number of cars or other vehicles available in apartments:
| Here: | 1.0 |
| city: | 0.6 |
Percentage of units with a mortgage:
| West Slope: | 60.2% |
| Jersey City: | 69.4% |
Housing prices:
- Average estimated value of detached houses in 2022 (13.2% of all units):
West Slope: $480,570 Jersey City: $732,576
- Average estimated value of housing units in 2-unit structures in 2022 (40.8% of all units):
This neighborhood: $777,615 Jersey City: $571,976
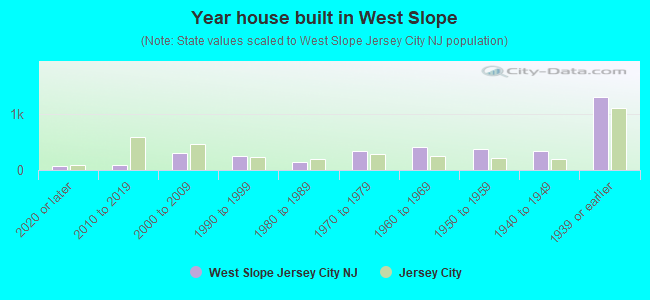
- Year house built in West Slope
- 742020 or later
- 882010 to 2019
- 3052000 to 2009
- 2441990 to 1999
- 1491980 to 1989
- 3441970 to 1979
- 4141960 to 1969
- 3821950 to 1959
- 3331940 to 1949
- 1,3071939 or earlier
City-data.com crime index for city in 2020 (higher means more crime):
| City: | 198.8 |
| U.S. average: | 219.5 |
Travel time to work (commute)
![Travel time to work (commute)]()
- 92Less than 5 minutes
- 3195 to 9 minutes
- 25910 to 14 minutes
- 27915 to 19 minutes
- 39720 to 24 minutes
- 11225 to 29 minutes
- 77430 to 34 minutes
- 10135 to 39 minutes
- 15340 to 44 minutes
- 78445 to 59 minutes
- 63160 to 89 minutes
- 17190 or more minutes

Means of transportation to work
![Means of transportation to work]()
- 55.1%2,293Drove a car alone
- 8.3%346Carpooled
- 14.5%602Bus
- 6.3%263Subway or elevated rail
- 5.0%206Long-distance train or commuter rail
- 2.3%96Light rail, streetcar or trolley
- 3.3%138Taxi
- 1.0%41Bicycle
- 1.4%58Walked
- 2.1%87Other means
- 9.8%406Worked at home

Time leaving home to go to work
![Time leaving home to go to work]()
- 27712:00 a.m. to 4:59 a.m.
- 2535:00 a.m. to 5:29 a.m.
- 1035:30 a.m. to 5:59 a.m.
- 1846:00 a.m. to 6:29 a.m.
- 656:30 a.m. to 6:59 a.m.
- 5627:00 a.m. to 7:29 a.m.
- 5777:30 a.m. to 7:59 a.m.
- 8538:00 a.m. to 8:29 a.m.
- 3488:30 a.m. to 8:59 a.m.
- 1779:00 a.m. to 9:59 a.m.
- 11610:00 a.m. to 10:59 a.m.
- 7411:00 a.m. to 11:59 a.m.
- 15212:00 p.m. to 3:59 p.m.
- 884:00 p.m. to 11:59 p.m.

Occupations of males:
- Percentage of males in management occupations (except farmers):
Here: 4.5% city: 12.9%
- Percentage of males in business and financial operations occupations:
Here: 10.9% city: 9.9%
- Percentage of males in computer and mathematical occupations:
Here: 17.7% city: 13.5%
- Percentage of males in architecture and engineering occupations:
Here: 5.7% city: 3.7%
- Percentage of males in legal occupations:
Here: 1.7% city: 1.8%
- Percentage of males in arts, design, entertainment, sports, and media occupations:
Here: 1.3% city: 3.5%
- Percentage of males in healthcare practitioners and technical occupations:
Here: 3.7% city: 2.6%
- Percentage of males in service occupations:
Here: 10.6% city: 10.4%
- Percentage of males in sales and office occupations:
Here: 13.1% city: 13.4%
- Percentage of males in construction, extraction, and maintenance occupations:
Here: 3.1% city: 5.6%
- Percentage of males in production occupations:
Here: 1.4% city: 2.8%
- Percentage of males in transportation occupations:
Here: 20.2% city: 7.2%
- Percentage of males in material moving occupations:
Here: 4.2% city: 4.2%
Occupations of females:
- Percentage of females in management occupations (except farmers):
Here: 9.7% city: 11.5%
- Percentage of females in business and financial operations occupations:
Here: 7.0% city: 11.7%
- Percentage of females in computer and mathematical occupations:
Here: 2.9% city: 5.3%
- Percentage of females in community and social services occupations:
Here: 11.9% city: 2.2%
- Percentage of females in legal occupations:
Here: 2.7% city: 2.6%
- Percentage of females in education, training, and library occupations:
Here: 10.3% city: 8.3%
- Percentage of females in arts, design, entertainment, sports, and media occupations:
Here: 1.1% city: 4.9%
- Percentage of females in healthcare practitioners and technical occupations:
Here: 6.3% city: 6.5%
- Percentage of females in service occupations:
Here: 14.6% city: 17.9%
- Percentage of females in sales and office occupations:
Here: 24.2% city: 21.2%
- Percentage of females in production occupations:
Here: 1.9% city: 2.7%
- Percentage of females in transportation occupations:
Here: 1.1% city: 0.7%
- Percentage of females in material moving occupations:
Here: 6.3% city: 1.8%
Percentage of people 16-64 in Armed Forces:
| West Slope: | 0.4% |
| Jersey City: | 0.1% |
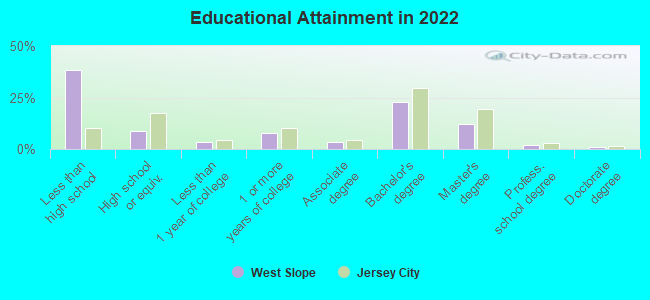
Education in this neighborhood (subdivision or community):
- Percentage of people 3 years and older in K-12 schools:
West Slope: 17.7% Jersey City: 12.9%
- Percentage of people 3 years and older in undergraduate colleges:
West Slope: 5.6% Jersey City: 4.5%
- Percentage of people 3 years and older in grad. or professional schools:
West Slope: 1.5% Jersey City: 2.2%
- Percentage of students K-12 enrolled in private schools:
West Slope: 47.5% Jersey City: 10.8%
Percentage of population below poverty level:
| West Slope: | 8.8% |
| Jersey City: | 12.8% |
Median year owner moved in (as recorded in 2022):
Median year renter moved in (as recorded in 2022):
| West Slope: | 2002 |
| Jersey City: | 2010 |
Median year renter moved in (as recorded in 2022):
| West Slope: | 2016 |
| Jersey City: | 2019 |
Percentage of married-couple families with both working:
| West Slope: | 51.0% |
| Jersey City: | 63.9% |
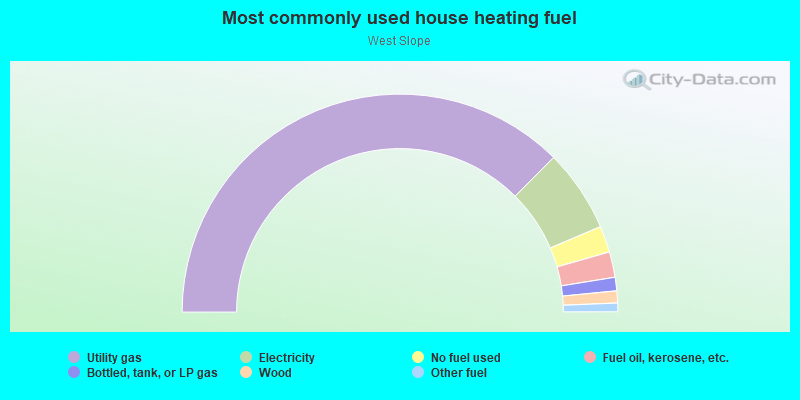
- 75.0%Utility gas
- 12.3%Electricity
- 3.9%No fuel used
- 3.8%Fuel oil, kerosene, etc.
- 2.0%Bottled, tank, or LP gas
- 1.8%Wood
- 1.3%Other fuel
Highways in this neighborhood:
State Rte 501 (John F Kennedy Blvd)
Length: 0.21 miles
Direction: SW-NE
Address range: 3480 to 3700
Direction: SW-NE
Address range: 3480 to 3700
Roads and streets:
Liberty Ave (Co Rd 647)
Length: 1.12 miles
Direction: SW-NE
Address range: 234 to 611
Direction: SW-NE
Address range: 234 to 611
Terrace Ave (Co Rd 649)
Length: 1.02 miles
Directions: E-W, SW-NE
Address range: 1 to 377
Directions: E-W, SW-NE
Address range: 1 to 377
Columbia Ave
Length: 0.82 miles
Direction: SW-NE
Address range: 3 to 298
Direction: SW-NE
Address range: 3 to 298
Nelson Ave (Co Rd 659)
Length: 0.46 miles
Direction: SW-NE
Address range: 1 to 181
Direction: SW-NE
Address range: 1 to 181
Leonard St (Co Rd 668)
Length: 0.41 miles
Direction: E-W
Address range: 79 to 299
Direction: E-W
Address range: 79 to 299
Western Ave
Length: 0.30 miles
Direction: SW-NE
Address range: 1 to 168
Direction: SW-NE
Address range: 1 to 168
Manhattan Ave
Length: 0.25 miles
Direction: E-W
Address range: 206 to 286
Direction: E-W
Address range: 206 to 286
Bleecker St
Length: 0.23 miles
Directions: E-W, SE-NW
Address range: 135 to 184
Directions: E-W, SE-NW
Address range: 135 to 184
Hague St
Length: 0.22 miles
Direction: E-W
Address range: 67 to 198
Direction: E-W
Address range: 67 to 198
Thorne St
Length: 0.21 miles
Directions: E-W, SE-NW
Address range: 149 to 215
Directions: E-W, SE-NW
Address range: 149 to 215
North St
Length: 0.19 miles
Direction: E-W
Address range: 240 to 286
Direction: E-W
Address range: 240 to 286
Zabriskie St (Co Rd 652)
Length: 0.19 miles
Directions: E-W, SE-NW
Address range: 164 to 218
Directions: E-W, SE-NW
Address range: 164 to 218
Lincoln St
Length: 0.18 miles
Direction: E-W
Address range: 158 to 207
Direction: E-W
Address range: 158 to 207
Graham St
Length: 0.12 miles
Direction: E-W
Address range: 105 to 154
Direction: E-W
Address range: 105 to 154
Reserve Ave
Length: 0.07 miles
Direction: E-W
Address range: 1 to 19
Direction: E-W
Address range: 1 to 19
Co Rd 647
Length: 0.00 miles
Direction: SW-NE
Direction: SW-NE