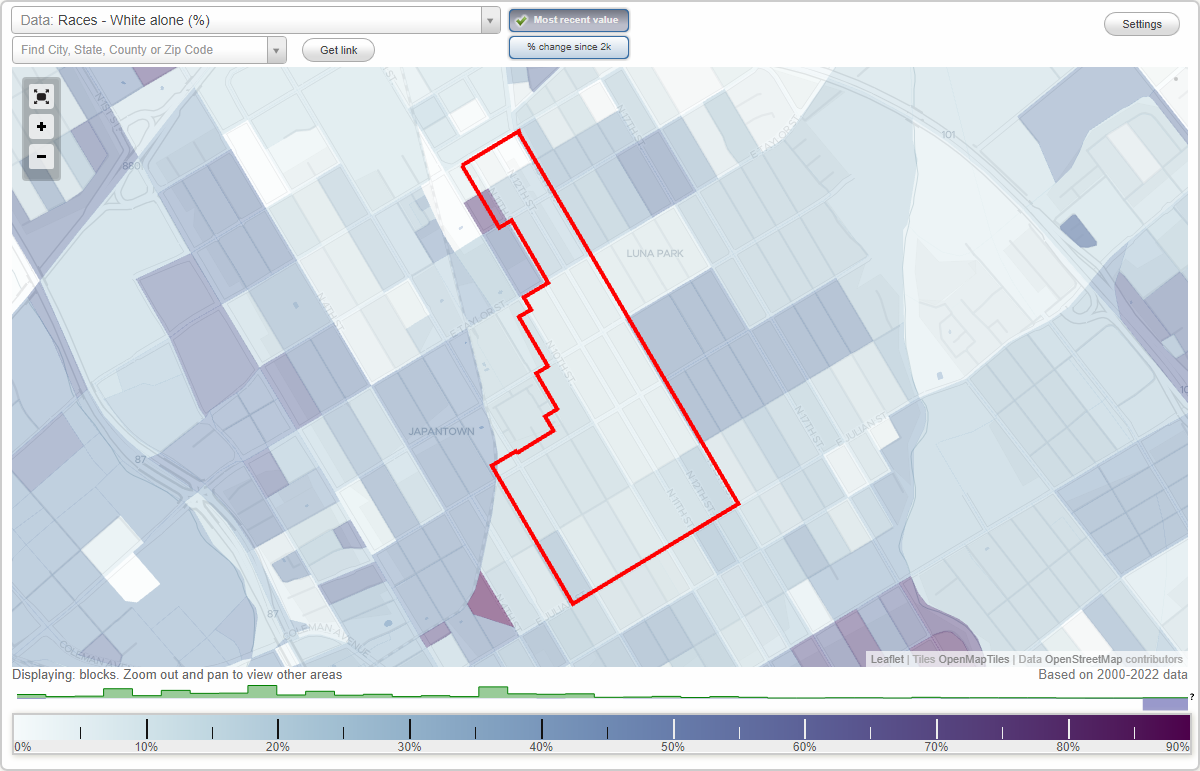
West Northside neighborhood in San Jose, California (CA), 95112 detailed profile
Settings
X

Business Search - 14 Million verified businesses
Area: 0.289 square miles
Population: 4,274
Population density:
| West Northside: | 14,805 people per square mile |
| San Jose: | 5,554 people per square mile |

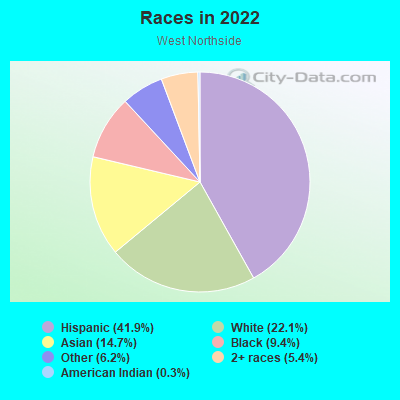
- 1,96441.9%Hispanic or Latino
- 1,03722.1%White
- 68914.7%Asian
- 4409.4%Black
- 2896.2%Some other race
- 2535.4%Two or more races
- 130.3%American Indian
Median household income in 2022:
| West Northside: | $115,882 |
| San Jose: | $133,835 |
Distribution of median household income
![Distribution of median household income]()
- 33Less than $10,000
- 120$10,000 to $19,999
- 135$20,000 to $29,999
- 235$30,000 to $39,999
- 143$40,000 to $49,999
- 257$50,000 to $59,999
- 71$60,000 to $74,999
- 245$75,000 to $99,999
- 169$100,000 to $124,999
- 138$125,000 to $149,999
- 256$150,000 to $199,999
- 484$200,000 or more

Distribution of owner-occupied house/condo value
![Distribution of owner-occupied house/condo value]()
- 41$100,000 to $149,999
- 22$200,000 to $249,999
- 9$400,000 to $499,999
- 81$500,000 to $749,999
- 223$750,000 to $999,999
- 338$1,000,000 or more

Distribution of rent paid by renters
![Distribution of rent paid by renters]()
- 47Less than $100
- 22$100 to $199
- 233$200 to $299
- 24$300 to $399
- 186$400 to $499
- 33$500 to $599
- 9$600 to $699
- 63$700 to $799
- 35$800 to $899
- 51$900 to $999
- 56$1,000 to $1,249
- 75$1,250 to $1,499
- 277$1,500 to $1,999
- 938$2,000 or more

Median rent in 2022:
| West Northside: | $2,070 |
| San Jose: | $2,001 |
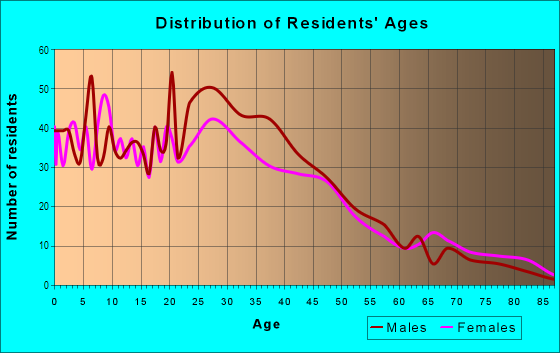
| Males: | 1,973 |
| Females: | 2,301 |
Males:
| This neighborhood: | 31.2 years |
| Whole city: | 37.6 years |
| This neighborhood: | 30.4 years |
| Whole city: | 39.1 years |
Average household size:
| West Northside: | 19.5 people |
| San Jose: | 2.9 people |
Percentage of family households:
| West Northside: | 41.8% |
| San Jose: | 49.9% |
| Here: | 39.0% |
| San Jose: | 53.0% |
Percentage of married-couple families with children (among all households):
| West Northside: | 32.9% |
| San Jose: | 25.8% |
Percentage of single-mother households (among all households):
| West Northside: | 6.3% |
| San Jose: | 5.2% |
Percentage of never married males 15 years old and over:
Percentage of never married females 15 years old and over:
| West Northside: | 23.0% |
| San Jose: | 20.9% |
Percentage of never married females 15 years old and over:
| West Northside: | 25.1% |
| city: | 16.7% |
Percentage of people that speak English not well or not at all:
| West Northside: | 3.1% |
| San Jose: | 11.4% |
Percentage of people born in this state:
Percentage of people born in another U.S. state:
Percentage of native residents but born outside the U.S.:
Percentage of foreign born residents:
| Here: | 48.9% |
| San Jose: | 46.1% |
Percentage of people born in another U.S. state:
| West Northside: | 13.8% |
| San Jose: | 10.4% |
Percentage of native residents but born outside the U.S.:
| Here: | 2.1% |
| city: | 1.7% |
Percentage of foreign born residents:
| Here: | 35.2% |
| San Jose: | 41.8% |
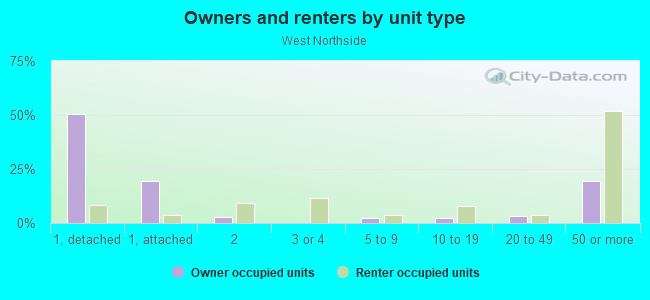
Owner-occupied
Renter-occupied

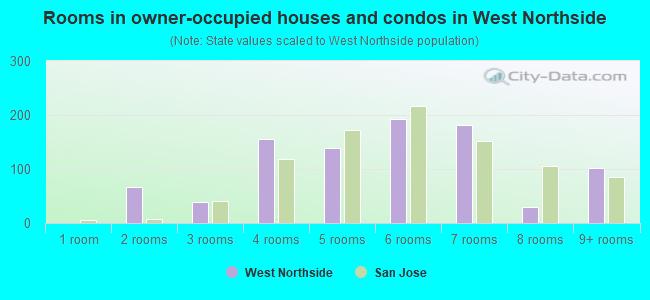
- Rooms in owner-occupied houses and condos in West Northside
- 01 room
- 672 rooms
- 383 rooms
- 1554 rooms
- 1385 rooms
- 1926 rooms
- 1817 rooms
- 298 rooms
- 1019+ rooms
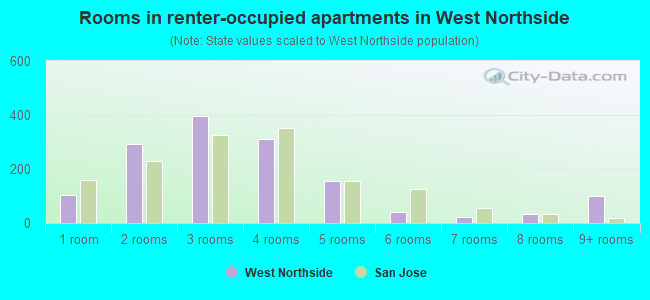
- Rooms in renter-occupied apartments in West Northside
- 1021 room
- 2912 rooms
- 3983 rooms
- 3104 rooms
- 1575 rooms
- 416 rooms
- 237 rooms
- 358 rooms
- 999+ rooms
Owner-occupied
Renter-occupied
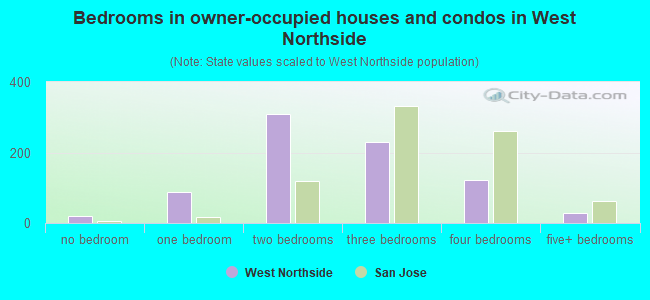
- Bedrooms in owner-occupied houses and condos in West Northside
- 21no bedroom
- 881 bedroom
- 3082 bedrooms
- 2303 bedrooms
- 1214 bedrooms
- 295+ bedrooms
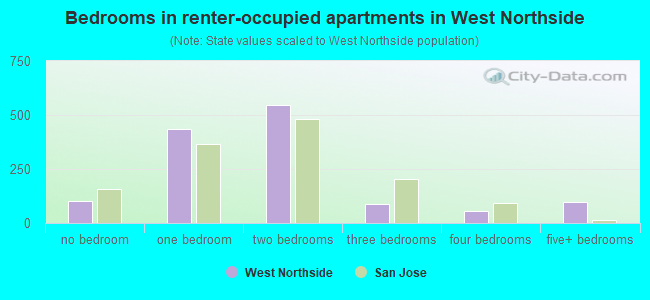
- Bedrooms in renter-occupied apartments in West Northside
- 100no bedroom
- 4331 bedroom
- 5442 bedrooms
- 903 bedrooms
- 574 bedrooms
- 995+ bedrooms
Average number of cars or other vehicles available in houses/condos:
Average number of cars or other vehicles available in apartments:
| This neighborhood: | 2.0 |
| San Jose: | 2.3 |
Average number of cars or other vehicles available in apartments:
| Here: | 1.7 |
| city: | 1.6 |
Percentage of units with a mortgage:
| West Northside: | 74.3% |
| San Jose: | 66.9% |
Average estimated value of detached houses in 2022 (33.4% of all units):
| West Northside: | $1,094,904 |
| San Jose: | $1,532,815 |
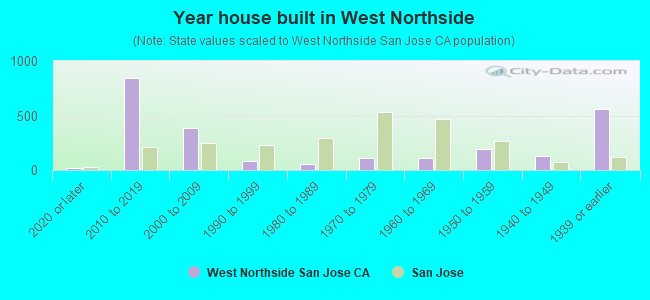
- Year house built in West Northside
- 142020 or later
- 8412010 to 2019
- 3822000 to 2009
- 831990 to 1999
- 561980 to 1989
- 1121970 to 1979
- 1071960 to 1969
- 1901950 to 1959
- 1251940 to 1949
- 5621939 or earlier
City-data.com crime index for city in 2020 (higher means more crime):
| City: | 268.4 |
| U.S. average: | 219.5 |
Travel time to work (commute)
![Travel time to work (commute)]()
- 17Less than 5 minutes
- 1865 to 9 minutes
- 23810 to 14 minutes
- 54815 to 19 minutes
- 31420 to 24 minutes
- 6825 to 29 minutes
- 36130 to 34 minutes
- 5735 to 39 minutes
- 8740 to 44 minutes
- 6945 to 59 minutes
- 17860 to 89 minutes
- 6690 or more minutes

Means of transportation to work
![Means of transportation to work]()
- 55.6%1,529Drove a car alone
- 14.4%395Carpooled
- 3.6%98Bus
- 2.8%76Subway or elevated rail
- 2.0%56Long-distance train or commuter rail
- 3.3%90Light rail, streetcar or trolley
- 0.8%23Taxi
- 0.8%23Motorcycle
- 7.5%206Bicycle
- 5.1%139Walked
- 0.8%22Other means
- 18.0%496Worked at home

Time leaving home to go to work
![Time leaving home to go to work]()
- 14112:00 a.m. to 4:59 a.m.
- 865:00 a.m. to 5:29 a.m.
- 935:30 a.m. to 5:59 a.m.
- 1036:00 a.m. to 6:29 a.m.
- 1716:30 a.m. to 6:59 a.m.
- 3897:00 a.m. to 7:29 a.m.
- 1757:30 a.m. to 7:59 a.m.
- 2198:00 a.m. to 8:29 a.m.
- 1988:30 a.m. to 8:59 a.m.
- 2609:00 a.m. to 9:59 a.m.
- 12210:00 a.m. to 10:59 a.m.
- 1511:00 a.m. to 11:59 a.m.
- 15112:00 p.m. to 3:59 p.m.
- 1184:00 p.m. to 11:59 p.m.

Occupations of males:
- Percentage of males in management occupations (except farmers):
Here: 17.8% city: 13.0%
- Percentage of males in business and financial operations occupations:
Here: 6.9% city: 4.6%
- Percentage of males in computer and mathematical occupations:
Here: 17.4% city: 13.6%
- Percentage of males in architecture and engineering occupations:
Here: 6.3% city: 10.2%
- Percentage of males in life, physical, and social science occupations:
Here: 2.4% city: 1.1%
- Percentage of males in legal occupations:
Here: 2.4% city: 0.8%
- Percentage of males in education, training, and library occupations:
Here: 1.2% city: 2.8%
- Percentage of males in healthcare practitioners and technical occupations:
Here: 6.8% city: 2.0%
- Percentage of males in service occupations:
Here: 10.3% city: 12.7%
- Percentage of males in sales and office occupations:
Here: 8.0% city: 12.8%
- Percentage of males in construction, extraction, and maintenance occupations:
Here: 11.4% city: 7.8%
- Percentage of males in production occupations:
Here: 2.1% city: 5.5%
- Percentage of males in transportation occupations:
Here: 1.0% city: 3.6%
- Percentage of males in material moving occupations:
Here: 3.5% city: 3.1%
Occupations of females:
- Percentage of females in management occupations (except farmers):
Here: 17.5% city: 11.0%
- Percentage of females in business and financial operations occupations:
Here: 13.1% city: 8.6%
- Percentage of females in computer and mathematical occupations:
Here: 10.6% city: 5.4%
- Percentage of females in life, physical, and social science occupations:
Here: 4.3% city: 1.7%
- Percentage of females in community and social services occupations:
Here: 6.2% city: 1.8%
- Percentage of females in education, training, and library occupations:
Here: 9.2% city: 8.1%
- Percentage of females in arts, design, entertainment, sports, and media occupations:
Here: 1.1% city: 2.0%
- Percentage of females in healthcare practitioners and technical occupations:
Here: 5.5% city: 6.8%
- Percentage of females in service occupations:
Here: 9.8% city: 21.7%
- Percentage of females in sales and office occupations:
Here: 20.4% city: 22.0%
- Percentage of females in farming, fishing, and forestry occupations:
Here: 1.2% city: 0.2%
- Percentage of females in production occupations:
Here: 1.2% city: 4.0%
- Percentage of females in material moving occupations:
Here: 1.4% city: 1.5%
Percentage of people 16-64 in Armed Forces:
| West Northside: | 0.1% |
| San Jose: | 0.0% |
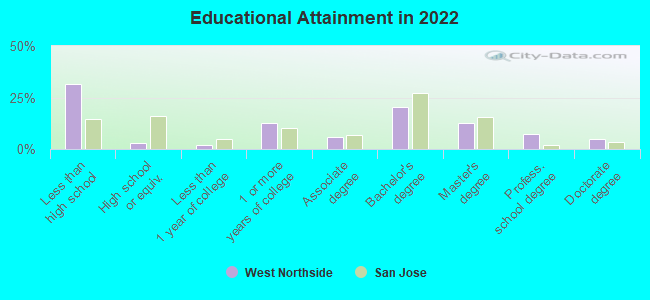
Education in this neighborhood (subdivision or community):
- Percentage of people 3 years and older in K-12 schools:
West Northside: 26.3% San Jose: 16.1%
- Percentage of people 3 years and older in undergraduate colleges:
West Northside: 12.1% San Jose: 6.5%
- Percentage of people 3 years and older in grad. or professional schools:
West Northside: 4.2% San Jose: 2.0%
- Percentage of students K-12 enrolled in private schools:
West Northside: 13.5% San Jose: 14.9%
Percentage of population below poverty level:
| West Northside: | 12.6% |
| San Jose: | 9.0% |
Median year owner moved in (as recorded in 2022):
Median year renter moved in (as recorded in 2022):
| West Northside: | 2009 |
| San Jose: | 2008 |
Median year renter moved in (as recorded in 2022):
| West Northside: | 2016 |
| San Jose: | 2020 |
Percentage of married-couple families with both working:
| West Northside: | 62.2% |
| San Jose: | 72.5% |
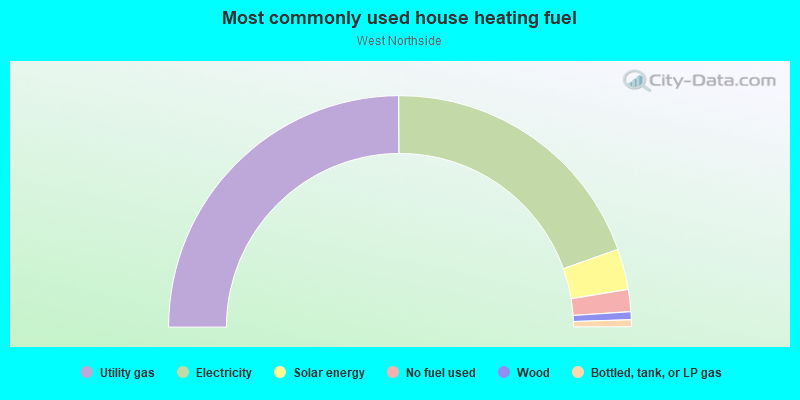
- 49.9%Utility gas
- 39.3%Electricity
- 5.7%Solar energy
- 3.1%No fuel used
- 1.1%Wood
- 1.0%Bottled, tank, or LP gas
Roads and streets:
N 12th St
Length: 1.01 miles
Direction: SE-NW
Address range: 300 to 850
Direction: SE-NW
Address range: 300 to 850
N 13th St
Length: 1.01 miles
Direction: SE-NW
Address range: 300 to 848
Direction: SE-NW
Address range: 300 to 848
N 11th St
Length: 0.64 miles
Direction: SE-NW
Address range: 300 to 849
Direction: SE-NW
Address range: 300 to 849
N 10th St
Length: 0.55 miles
Direction: SE-NW
Address range: 300 to 599
Direction: SE-NW
Address range: 300 to 599
E Julian St
Length: 0.46 miles
Direction: SW-NE
Address range: 300 to 599
Direction: SW-NE
Address range: 300 to 599
E Empire St
Length: 0.46 miles
Direction: SW-NE
Address range: 300 to 599
Direction: SW-NE
Address range: 300 to 599
Washington St
Length: 0.46 miles
Direction: SW-NE
Address range: 300 to 599
Direction: SW-NE
Address range: 300 to 599
N 9th St
Length: 0.37 miles
Direction: SE-NW
Address range: 300 to 499
Direction: SE-NW
Address range: 300 to 499
N 7th St
Length: 0.37 miles
Direction: SE-NW
Address range: 300 to 499
Direction: SE-NW
Address range: 300 to 499
N 8th St
Length: 0.37 miles
Direction: SE-NW
Address range: 300 to 499
Direction: SE-NW
Address range: 300 to 499
Jackson St
Length: 0.22 miles
Direction: SW-NE
Address range: 451 to 599
Direction: SW-NE
Address range: 451 to 599
E Mission St
Length: 0.14 miles
Direction: SW-NE
Address range: 500 to 599
Direction: SW-NE
Address range: 500 to 599
Vestal St
Length: 0.14 miles
Direction: SW-NE
Address range: 500 to 599
Direction: SW-NE
Address range: 500 to 599
E Taylor St
Length: 0.07 miles
Direction: SW-NE
Address range: 550 to 599
Direction: SW-NE
Address range: 550 to 599