Washington Square neighborhood in San Leandro, California (CA), 94578 detailed profile
Settings
X


Business Search - 14 Million verified businesses
Area: 0.085 square miles
Population: 686
Population density:
| Washington Square: | 8,038 people per square mile |
| San Leandro: | 6,610 people per square mile |

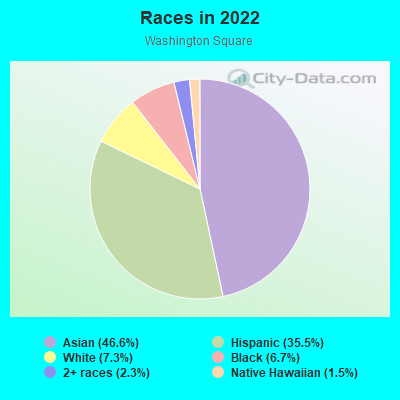
- 31946.6%Asian
- 24335.5%Hispanic or Latino
- 507.3%White
- 466.7%Black
- 162.3%Two or more races
- 101.5%Native Hawaiian and Other
Pacific Islander
Median household income in 2022:
| Washington Square: | $120,661 |
| San Leandro: | $92,651 |
Distribution of median household income
![Distribution of median household income]()
- 6Less than $10,000
- 20$10,000 to $19,999
- 10$20,000 to $29,999
- 17$30,000 to $39,999
- 13$40,000 to $49,999
- 7$50,000 to $59,999
- 7$60,000 to $74,999
- 35$75,000 to $99,999
- 32$100,000 to $124,999
- 15$125,000 to $149,999
- 39$150,000 to $199,999
- 32$200,000 or more

Distribution of owner-occupied house/condo value
![Distribution of owner-occupied house/condo value]()
- 6$50,000 to $99,999
- 3$200,000 to $249,999
- 3$250,000 to $299,999
- 2$300,000 to $399,999
- 14$400,000 to $499,999
- 42$500,000 to $749,999
- 56$750,000 to $999,999
- 27$1,000,000 or more

Distribution of rent paid by renters
![Distribution of rent paid by renters]()
- 9$200 to $299
- 1$600 to $699
- 5$900 to $999
- 6$1,000 to $1,249
- 21$1,250 to $1,499
- 13$1,500 to $1,999
- 46$2,000 or more

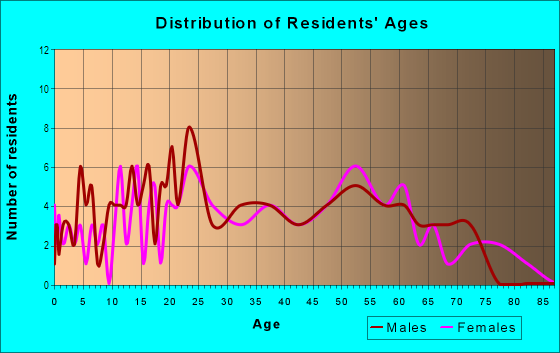
| Males: | 293 |
| Females: | 393 |
Males:
| This neighborhood: | 42.8 years |
| Whole city: | 40.3 years |
| This neighborhood: | 46.8 years |
| Whole city: | 45.2 years |
Average household size:
| Washington Square: | 3.2 people |
| San Leandro: | 2.9 people |
Percentage of family households:
| Washington Square: | 53.9% |
| San Leandro: | 44.4% |
| Here: | 55.7% |
| San Leandro: | 49.6% |
Percentage of married-couple families with children (among all households):
| Washington Square: | 21.6% |
| San Leandro: | 26.2% |
Percentage of single-mother households (among all households):
| Washington Square: | 5.7% |
| San Leandro: | 7.1% |
Percentage of never married males 15 years old and over:
Percentage of never married females 15 years old and over:
| Washington Square: | 13.8% |
| San Leandro: | 18.2% |
Percentage of never married females 15 years old and over:
| Washington Square: | 22.2% |
| city: | 16.0% |
Percentage of people that speak English not well or not at all:
| Washington Square: | 15.5% |
| San Leandro: | 12.0% |
Percentage of people born in this state:
Percentage of people born in another U.S. state:
Percentage of native residents but born outside the U.S.:
Percentage of foreign born residents:
| Here: | 44.9% |
| San Leandro: | 44.1% |
Percentage of people born in another U.S. state:
| Washington Square: | 6.4% |
| San Leandro: | 9.8% |
Percentage of native residents but born outside the U.S.:
| Here: | 2.0% |
| city: | 1.7% |
Percentage of foreign born residents:
| Here: | 46.7% |
| San Leandro: | 44.4% |
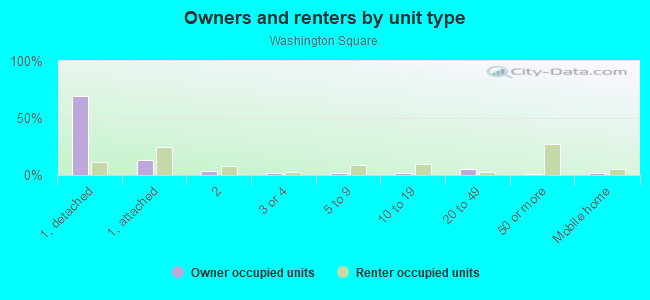
Owner-occupied
Renter-occupied

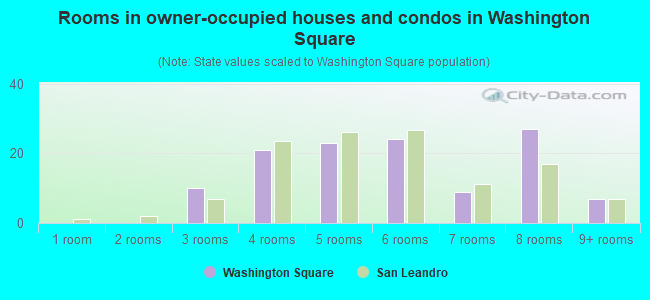
- Rooms in owner-occupied houses and condos in Washington Square
- 01 room
- 02 rooms
- 103 rooms
- 214 rooms
- 235 rooms
- 246 rooms
- 97 rooms
- 278 rooms
- 79+ rooms
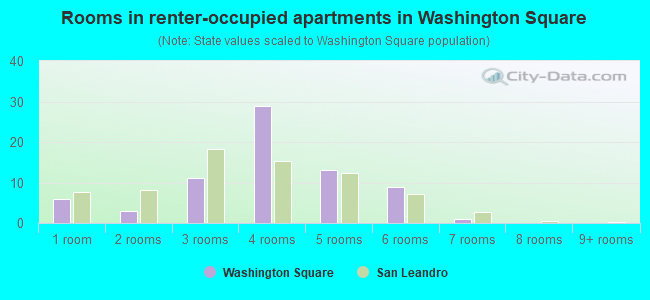
- Rooms in renter-occupied apartments in Washington Square
- 61 room
- 32 rooms
- 113 rooms
- 294 rooms
- 135 rooms
- 96 rooms
- 17 rooms
- 08 rooms
- 09+ rooms
Owner-occupied
Renter-occupied
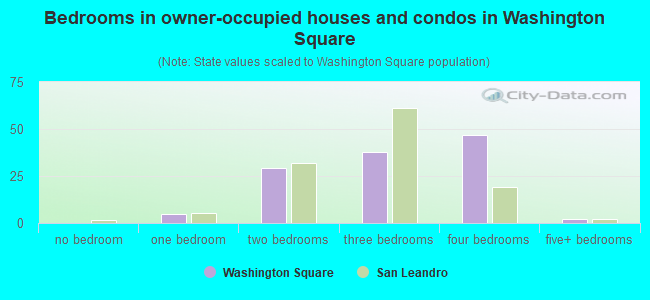
- Bedrooms in owner-occupied houses and condos in Washington Square
- 0no bedroom
- 51 bedroom
- 292 bedrooms
- 383 bedrooms
- 474 bedrooms
- 25+ bedrooms
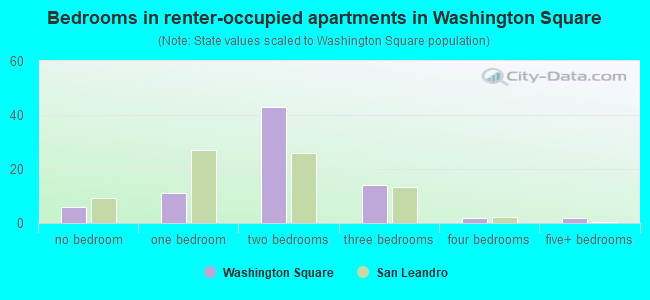
- Bedrooms in renter-occupied apartments in Washington Square
- 6no bedroom
- 111 bedroom
- 432 bedrooms
- 143 bedrooms
- 24 bedrooms
- 25+ bedrooms
Average number of cars or other vehicles available in houses/condos:
Average number of cars or other vehicles available in apartments:
| This neighborhood: | 2.8 |
| San Leandro: | 2.2 |
Average number of cars or other vehicles available in apartments:
| Here: | 1.7 |
| city: | 1.3 |
Percentage of units with a mortgage:
| Washington Square: | 53.6% |
| San Leandro: | 63.4% |
Average estimated value of detached houses in 2022 (56.6% of all units):
| Washington Square: | $763,921 |
| California: | $988,808 |
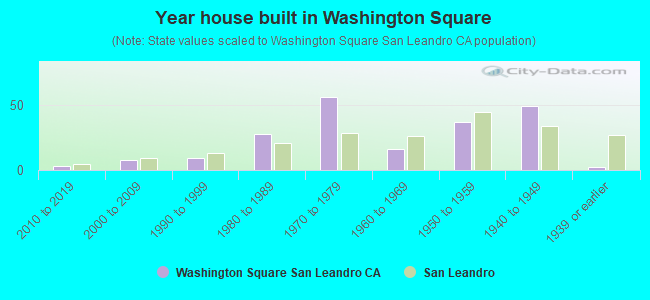
- Year house built in Washington Square
- 02020 or later
- 32010 to 2019
- 82000 to 2009
- 91990 to 1999
- 281980 to 1989
- 561970 to 1979
- 161960 to 1969
- 371950 to 1959
- 491940 to 1949
- 21939 or earlier
City-data.com crime index for city in 2020 (higher means more crime):
| City: | 374.8 |
| U.S. average: | 219.5 |
Travel time to work (commute)
![Travel time to work (commute)]()
- 185 to 9 minutes
- 1310 to 14 minutes
- 3515 to 19 minutes
- 2020 to 24 minutes
- 1525 to 29 minutes
- 6830 to 34 minutes
- 1135 to 39 minutes
- 3240 to 44 minutes
- 2145 to 59 minutes
- 4960 to 89 minutes
- 3990 or more minutes

Means of transportation to work
![Means of transportation to work]()
- 62.8%242Drove a car alone
- 12.2%47Carpooled
- 2.1%8Bus
- 10.9%42Subway or elevated rail
- 0.8%3Long-distance train or commuter rail
- 1.8%7Other means
- 10.9%42Worked at home

Time leaving home to go to work
![Time leaving home to go to work]()
- 2612:00 a.m. to 4:59 a.m.
- 135:00 a.m. to 5:29 a.m.
- 145:30 a.m. to 5:59 a.m.
- 246:00 a.m. to 6:29 a.m.
- 596:30 a.m. to 6:59 a.m.
- 267:00 a.m. to 7:29 a.m.
- 297:30 a.m. to 7:59 a.m.
- 428:00 a.m. to 8:29 a.m.
- 198:30 a.m. to 8:59 a.m.
- 319:00 a.m. to 9:59 a.m.
- 1610:00 a.m. to 10:59 a.m.
- 611:00 a.m. to 11:59 a.m.
- 812:00 p.m. to 3:59 p.m.
- 154:00 p.m. to 11:59 p.m.

Occupations of males:
- Percentage of males in management occupations (except farmers):
Here: 6.8% city: 9.9%
- Percentage of males in business and financial operations occupations:
Here: 2.3% city: 4.3%
- Percentage of males in computer and mathematical occupations:
Here: 4.6% city: 6.7%
- Percentage of males in architecture and engineering occupations:
Here: 3.7% city: 3.6%
- Percentage of males in community and social services occupations:
Here: 1.3% city: 1.7%
- Percentage of males in legal occupations:
Here: 1.5% city: 0.7%
- Percentage of males in education, training, and library occupations:
Here: 8.4% city: 3.0%
- Percentage of males in arts, design, entertainment, sports, and media occupations:
Here: 6.6% city: 1.5%
- Percentage of males in service occupations:
Here: 21.3% city: 14.6%
- Percentage of males in sales and office occupations:
Here: 3.9% city: 14.8%
- Percentage of males in construction, extraction, and maintenance occupations:
Here: 6.4% city: 10.0%
- Percentage of males in production occupations:
Here: 18.9% city: 7.8%
- Percentage of males in transportation occupations:
Here: 1.1% city: 7.3%
- Percentage of males in material moving occupations:
Here: 5.1% city: 6.8%
Occupations of females:
- Percentage of females in management occupations (except farmers):
Here: 10.3% city: 9.2%
- Percentage of females in business and financial operations occupations:
Here: 7.5% city: 7.3%
- Percentage of females in architecture and engineering occupations:
Here: 1.9% city: 0.9%
- Percentage of females in legal occupations:
Here: 1.2% city: 1.5%
- Percentage of females in education, training, and library occupations:
Here: 7.5% city: 6.9%
- Percentage of females in healthcare practitioners and technical occupations:
Here: 10.4% city: 6.5%
- Percentage of females in service occupations:
Here: 20.5% city: 23.3%
- Percentage of females in sales and office occupations:
Here: 32.5% city: 26.6%
- Percentage of females in production occupations:
Here: 6.7% city: 5.3%
- Percentage of females in material moving occupations:
Here: 1.5% city: 3.5%
Percentage of people 16-64 in Armed Forces:
| Washington Square: | 0.7% |
| San Leandro: | 0.1% |
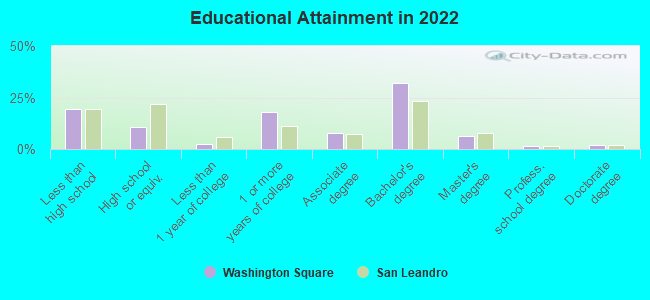
Education in this neighborhood (subdivision or community):
- Percentage of people 3 years and older in K-12 schools:
Washington Square: 14.0% San Leandro: 14.4%
- Percentage of people 3 years and older in undergraduate colleges:
Washington Square: 5.6% San Leandro: 5.5%
- Percentage of people 3 years and older in grad. or professional schools:
Washington Square: 2.7% San Leandro: 1.6%
- Percentage of students K-12 enrolled in private schools:
Washington Square: 52.7% San Leandro: 9.9%
Percentage of population below poverty level:
| Washington Square: | 2.9% |
| San Leandro: | 7.4% |
Median year owner moved in (as recorded in 2022):
| Washington Square: | 2002 |
| San Leandro: | 2006 |
Percentage of married-couple families with both working:
| Washington Square: | 62.1% |
| San Leandro: | 62.2% |
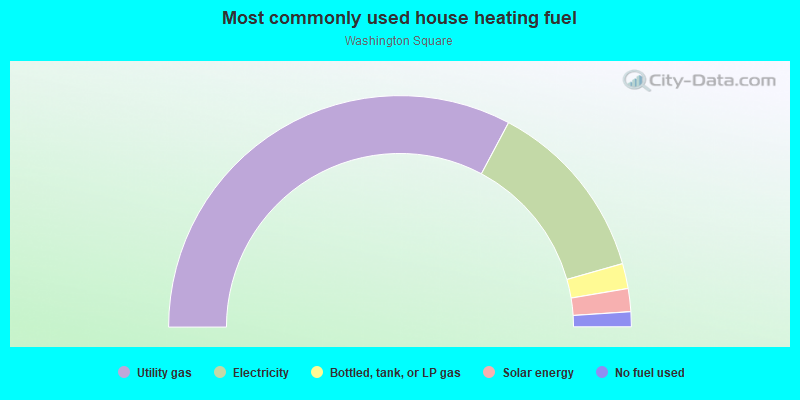
- 65.5%Utility gas
- 25.6%Electricity
- 3.5%Bottled, tank, or LP gas
- 3.2%Solar energy
- 2.1%No fuel used
Roads and streets:
Halcyon Dr
Length: 0.61 miles
Direction: E-W
Address range: 2700 to 2859
Direction: E-W
Address range: 2700 to 2859
Hollyhock Dr
Length: 0.51 miles
Directions: E-W, N-S, SE-NW, SW-NE
Address range: 500 to 999
Directions: E-W, N-S, SE-NW, SW-NE
Address range: 500 to 999
Begonia Dr
Length: 0.38 miles
Directions: E-W, N-S, SE-NW
Address range: 600 to 999
Directions: E-W, N-S, SE-NW
Address range: 600 to 999
Oleander St
Length: 0.22 miles
Directions: E-W, N-S, SE-NW, SW-NE
Address range: 14701 to 14998
Directions: E-W, N-S, SE-NW, SW-NE
Address range: 14701 to 14998
Crocus Dr
Length: 0.17 miles
Direction: E-W
Address range: 600 to 899
Direction: E-W
Address range: 600 to 899
Begonia Ct
Length: 0.11 miles
Direction: E-W
Address range: 400 to 599
Direction: E-W
Address range: 400 to 599
Elderberry Way
Length: 0.10 miles
Direction: E-W
Address range: 600 to 799
Direction: E-W
Address range: 600 to 799
Narcissus Ct
Length: 0.07 miles
Direction: E-W
Address range: 900 to 999
Direction: E-W
Address range: 900 to 999
Dahlia Ct
Length: 0.05 miles
Direction: E-W
Address range: 500 to 599
Direction: E-W
Address range: 500 to 599
Zinnia St
Length: 0.05 miles
Directions: N-S, SE-NW
Address range: 15000 to 15041
Directions: N-S, SE-NW
Address range: 15000 to 15041
Sunflower Dr
Length: 0.05 miles
Direction: N-S
Direction: N-S
Freesia Ct
Length: 0.05 miles
Directions: E-W, SW-NE
Address range: 600 to 699
Directions: E-W, SW-NE
Address range: 600 to 699
Olivia St
Length: 0.04 miles
Direction: N-S
Direction: N-S
Muscari St
Length: 0.03 miles
Direction: E-W
Direction: E-W
Railroad features:
Bay Area Rapid Transit RR
Length: 0.15 miles
Direction: SE-NW
Direction: SE-NW