Van Vorst Park neighborhood in Jersey City, New Jersey (NJ), 07302 detailed profile
Settings
X

Business Search - 14 Million verified businesses
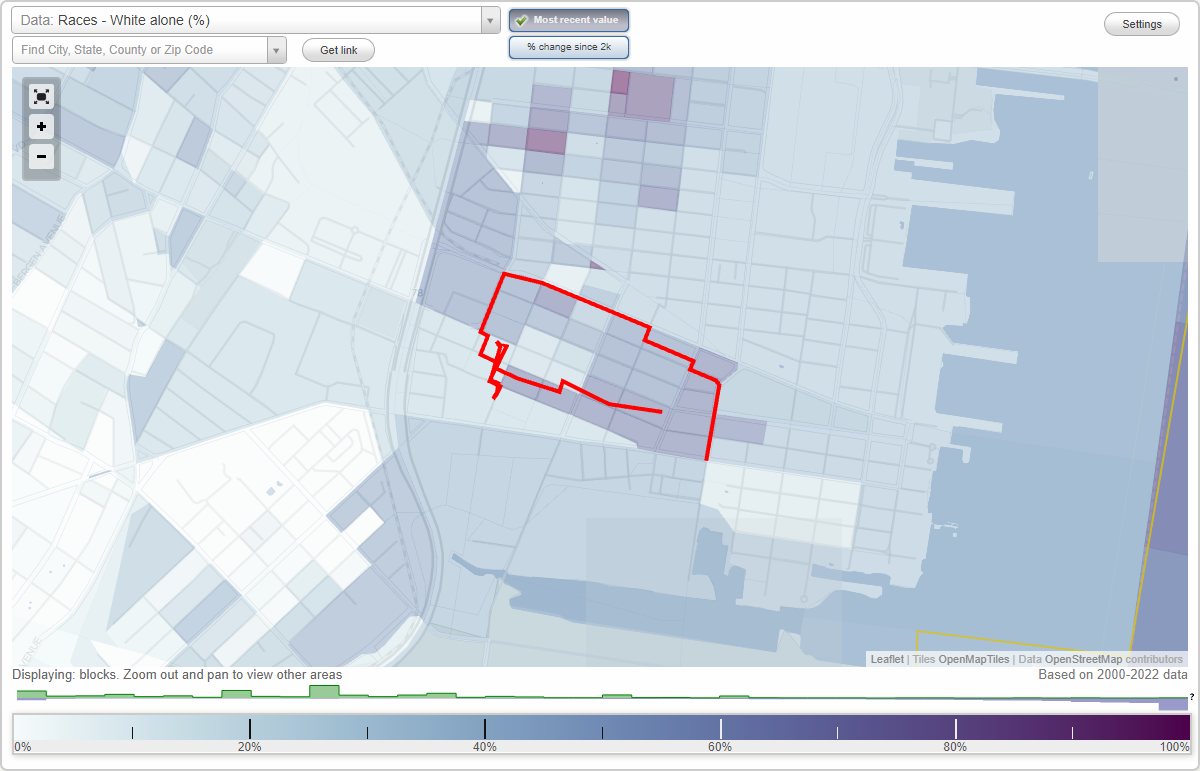
Area: 0.132 square miles
Population: 5,973
Population density:
| Van Vorst Park: | 45,359 people per square mile |
| Jersey City: | 19,218 people per square mile |

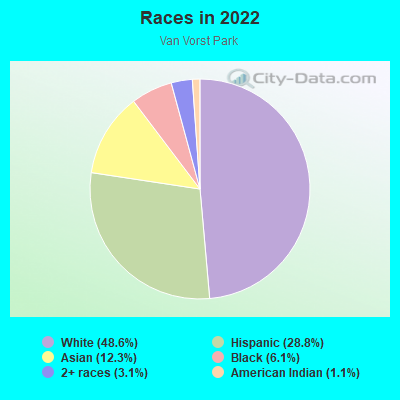
- 2,90148.6%White
- 1,72128.8%Hispanic or Latino
- 73512.3%Asian
- 3636.1%Black
- 1853.1%Two or more races
- 651.1%American Indian
Median household income in 2022:
| Van Vorst Park: | $137,385 |
| Jersey City: | $94,080 |
Distribution of median household income
![Distribution of median household income]()
- 59Less than $10,000
- 230$10,000 to $19,999
- 20$20,000 to $29,999
- 244$30,000 to $39,999
- 26$40,000 to $49,999
- 201$50,000 to $59,999
- 204$60,000 to $74,999
- 223$75,000 to $99,999
- 164$100,000 to $124,999
- 587$125,000 to $149,999
- 357$150,000 to $199,999
- 914$200,000 or more

Distribution of owner-occupied house/condo value
![Distribution of owner-occupied house/condo value]()
- 53Less than $50,000
- 102$200,000 to $249,999
- 62$250,000 to $299,999
- 84$300,000 to $399,999
- 37$400,000 to $499,999
- 383$500,000 to $749,999
- 299$750,000 to $999,999
- 184$1,000,000 or more

Distribution of rent paid by renters
![Distribution of rent paid by renters]()
- 99Less than $100
- 56$200 to $299
- 102$400 to $499
- 22$800 to $899
- 41$1,000 to $1,249
- 139$1,250 to $1,499
- 405$1,500 to $1,999
- 1,183$2,000 or more

Median rent in 2022:
| Van Vorst Park: | $2,114 |
| Jersey City: | $1,738 |
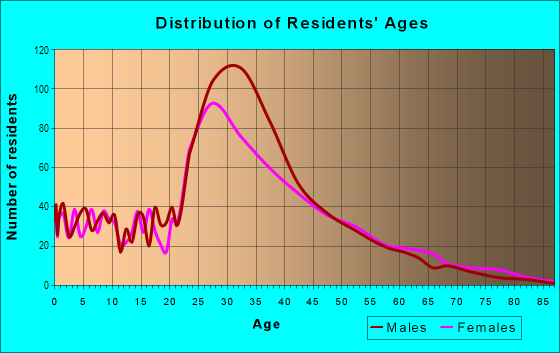
| Males: | 3,250 |
| Females: | 2,722 |
Males:
| This neighborhood: | 33.8 years |
| Whole city: | 34.1 years |
| This neighborhood: | 33.7 years |
| Whole city: | 36.2 years |
Average household size:
| Van Vorst Park: | 1.9 people |
| Jersey City: | 2.2 people |
Percentage of family households:
| Van Vorst Park: | 35.5% |
| Jersey City: | 39.8% |
| Here: | 39.0% |
| Jersey City: | 34.2% |
Percentage of married-couple families with children (among all households):
| Van Vorst Park: | 47.3% |
| Jersey City: | 29.4% |
Percentage of single-mother households (among all households):
| Van Vorst Park: | 33.5% |
| Jersey City: | 13.3% |
Percentage of never married males 15 years old and over:
Percentage of never married females 15 years old and over:
| Van Vorst Park: | 29.5% |
| Jersey City: | 23.6% |
Percentage of never married females 15 years old and over:
| Van Vorst Park: | 17.6% |
| city: | 22.6% |
Percentage of people that speak English not well or not at all:
| Van Vorst Park: | 6.5% |
| Jersey City: | 7.2% |
Percentage of people born in this state:
Percentage of people born in another U.S. state:
Percentage of native residents but born outside the U.S.:
Percentage of foreign born residents:
| Here: | 33.3% |
| Jersey City: | 34.5% |
Percentage of people born in another U.S. state:
| Van Vorst Park: | 41.5% |
| Jersey City: | 22.1% |
Percentage of native residents but born outside the U.S.:
| Here: | 3.2% |
| city: | 3.8% |
Percentage of foreign born residents:
| Here: | 21.9% |
| Jersey City: | 39.6% |
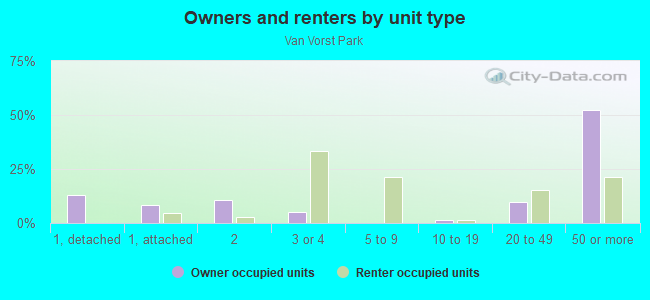
Owner-occupied
Renter-occupied

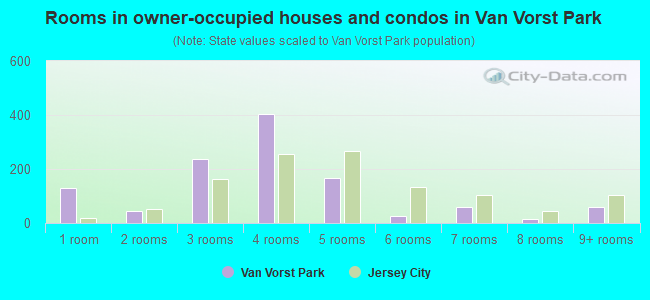
- Rooms in owner-occupied houses and condos in Van Vorst Park
- 1311 room
- 432 rooms
- 2363 rooms
- 4044 rooms
- 1675 rooms
- 256 rooms
- 587 rooms
- 138 rooms
- 589+ rooms
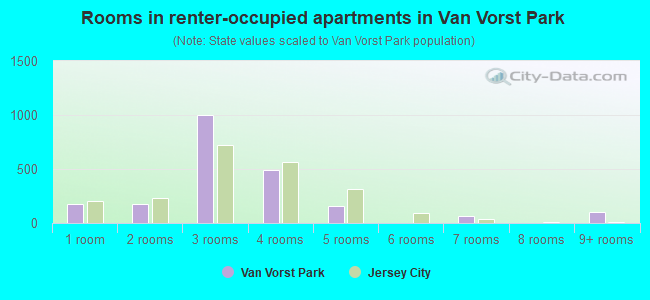
- Rooms in renter-occupied apartments in Van Vorst Park
- 1781 room
- 1742 rooms
- 1,0043 rooms
- 4954 rooms
- 1605 rooms
- 06 rooms
- 657 rooms
- 08 rooms
- 1019+ rooms
Owner-occupied
Renter-occupied
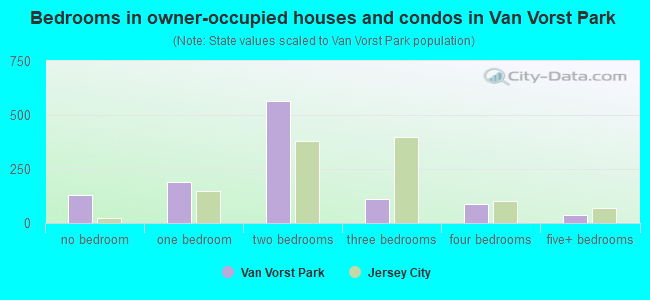
- Bedrooms in owner-occupied houses and condos in Van Vorst Park
- 131no bedroom
- 1921 bedroom
- 5642 bedrooms
- 1123 bedrooms
- 874 bedrooms
- 365+ bedrooms
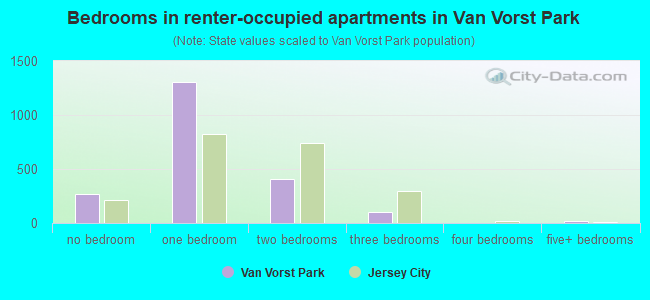
- Bedrooms in renter-occupied apartments in Van Vorst Park
- 265no bedroom
- 1,3031 bedroom
- 4072 bedrooms
- 1013 bedrooms
- 04 bedrooms
- 235+ bedrooms
Average number of cars or other vehicles available in houses/condos:
Average number of cars or other vehicles available in apartments:
| This neighborhood: | 0.9 |
| Jersey City: | 1.3 |
Average number of cars or other vehicles available in apartments:
| Here: | 0.8 |
| city: | 0.6 |
Percentage of units with a mortgage:
| Van Vorst Park: | 84.1% |
| Jersey City: | 69.4% |
Housing prices:
- Average estimated value of detached houses in 2022 (4.2% of all units):
Van Vorst Park: $752,870 Jersey City: $732,576
- Average estimated value of townhouses or other attached units in 2022 (5.7% of all units):
This neighborhood: $1,234,805 city: $695,567
- Average estimated value of housing units in 2-unit structures in 2022 (5.3% of all units):
This neighborhood: $2,520,422 Jersey City: $571,976
- Average estimated '22 value of housing units in 3-to-4-unit structures (23.8% of all units):
Van Vorst Park: $938,903 city: $581,467
- Average estimated '22 value of housing units in 5-or-more-unit structures (32.2% of all units):
Van Vorst Park: $649,288 Jersey City: $666,445
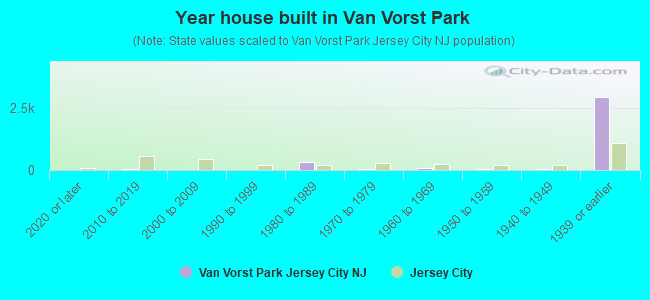
- Year house built in Van Vorst Park
- 02020 or later
- 262010 to 2019
- 02000 to 2009
- 01990 to 1999
- 3271980 to 1989
- 501970 to 1979
- 871960 to 1969
- 291950 to 1959
- 401940 to 1949
- 2,9191939 or earlier
City-data.com crime index for city in 2020 (higher means more crime):
| City: | 198.8 |
| U.S. average: | 219.5 |
Travel time to work (commute)
![Travel time to work (commute)]()
- 785 to 9 minutes
- 25610 to 14 minutes
- 14415 to 19 minutes
- 26920 to 24 minutes
- 1925 to 29 minutes
- 47030 to 34 minutes
- 43735 to 39 minutes
- 22040 to 44 minutes
- 77845 to 59 minutes
- 27660 to 89 minutes
- 5290 or more minutes

Means of transportation to work
![Means of transportation to work]()
- 12.9%560Drove a car alone
- 1.5%65Carpooled
- 1.3%58Bus
- 28.5%1,237Subway or elevated rail
- 2.1%90Long-distance train or commuter rail
- 6.4%276Light rail, streetcar or trolley
- 1.4%61Bicycle
- 9.9%429Walked
- 35.9%1,561Worked at home

Time leaving home to go to work
![Time leaving home to go to work]()
- 5912:00 a.m. to 4:59 a.m.
- 165:30 a.m. to 5:59 a.m.
- 1186:00 a.m. to 6:29 a.m.
- 2406:30 a.m. to 6:59 a.m.
- 1807:00 a.m. to 7:29 a.m.
- 2897:30 a.m. to 7:59 a.m.
- 8748:00 a.m. to 8:29 a.m.
- 4048:30 a.m. to 8:59 a.m.
- 5139:00 a.m. to 9:59 a.m.
- 6210:00 a.m. to 10:59 a.m.
- 4911:00 a.m. to 11:59 a.m.
- 5912:00 p.m. to 3:59 p.m.
- 2664:00 p.m. to 11:59 p.m.

Occupations of males:
- Percentage of males in management occupations (except farmers):
Here: 14.2% city: 12.9%
- Percentage of males in business and financial operations occupations:
Here: 9.5% city: 9.9%
- Percentage of males in computer and mathematical occupations:
Here: 14.9% city: 13.5%
- Percentage of males in architecture and engineering occupations:
Here: 2.1% city: 3.7%
- Percentage of males in life, physical, and social science occupations:
Here: 4.1% city: 1.1%
- Percentage of males in legal occupations:
Here: 7.1% city: 1.8%
- Percentage of males in education, training, and library occupations:
Here: 3.4% city: 3.6%
- Percentage of males in arts, design, entertainment, sports, and media occupations:
Here: 14.2% city: 3.5%
- Percentage of males in service occupations:
Here: 9.9% city: 10.4%
- Percentage of males in sales and office occupations:
Here: 15.7% city: 13.4%
- Percentage of males in construction, extraction, and maintenance occupations:
Here: 5.3% city: 5.6%
- Percentage of males in transportation occupations:
Here: 2.7% city: 7.2%
Occupations of females:
- Percentage of females in management occupations (except farmers):
Here: 26.8% city: 11.5%
- Percentage of females in business and financial operations occupations:
Here: 13.0% city: 11.7%
- Percentage of females in architecture and engineering occupations:
Here: 1.1% city: 1.1%
- Percentage of females in life, physical, and social science occupations:
Here: 4.0% city: 1.1%
- Percentage of females in community and social services occupations:
Here: 1.7% city: 2.2%
- Percentage of females in legal occupations:
Here: 2.2% city: 2.6%
- Percentage of females in education, training, and library occupations:
Here: 6.4% city: 8.3%
- Percentage of females in arts, design, entertainment, sports, and media occupations:
Here: 11.2% city: 4.9%
- Percentage of females in healthcare practitioners and technical occupations:
Here: 11.5% city: 6.5%
- Percentage of females in service occupations:
Here: 9.5% city: 17.9%
- Percentage of females in sales and office occupations:
Here: 13.8% city: 21.2%
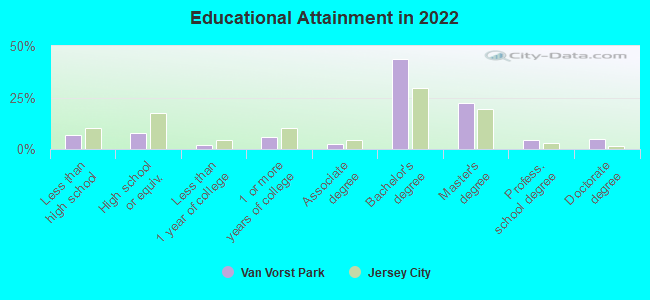
Education in this neighborhood (subdivision or community):
- Percentage of people 3 years and older in K-12 schools:
Van Vorst Park: 6.5% Jersey City: 12.9%
- Percentage of people 3 years and older in undergraduate colleges:
Van Vorst Park: 6.2% Jersey City: 4.5%
- Percentage of people 3 years and older in grad. or professional schools:
Van Vorst Park: 3.2% Jersey City: 2.2%
- Percentage of students K-12 enrolled in private schools:
Van Vorst Park: 53.3% Jersey City: 10.8%
Percentage of population below poverty level:
| Van Vorst Park: | 15.9% |
| Jersey City: | 12.8% |
Median year owner moved in (as recorded in 2022):
Median year renter moved in (as recorded in 2022):
| Van Vorst Park: | 2011 |
| Jersey City: | 2010 |
Median year renter moved in (as recorded in 2022):
| Van Vorst Park: | 2014 |
| Jersey City: | 2019 |
Percentage of married-couple families with both working:
| Van Vorst Park: | 88.6% |
| Jersey City: | 63.9% |
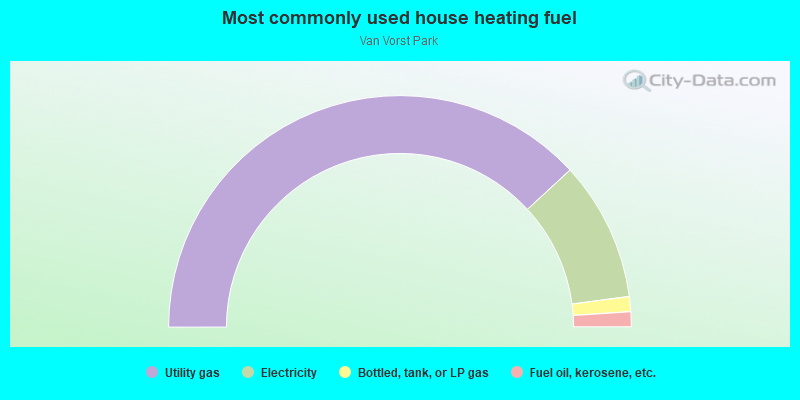
- 76.2%Utility gas
- 19.5%Electricity
- 2.1%Bottled, tank, or LP gas
- 2.1%Fuel oil, kerosene, etc.
Roads and streets:
Co Rd 618 (York St)
Length: 0.62 miles
Direction: E-W
Address range: 184 to 399
Direction: E-W
Address range: 184 to 399
Montgomery St
Length: 0.61 miles
Direction: E-W
Address range: 171 to 351
Direction: E-W
Address range: 171 to 351
Wayne St
Length: 0.49 miles
Direction: E-W
Address range: 31 to 170
Direction: E-W
Address range: 31 to 170
Paulmier Pl
Length: 0.48 miles
Direction: E-W
Address range: 1 to 145
Direction: E-W
Address range: 1 to 145
Bright St (Co Rd 620)
Length: 0.33 miles
Direction: E-W
Address range: 47 to 160
Direction: E-W
Address range: 47 to 160
Varick St
Length: 0.26 miles
Direction: SW-NE
Address range: 265 to 394
Direction: SW-NE
Address range: 265 to 394
Monmouth St
Length: 0.26 miles
Direction: SW-NE
Address range: 269 to 354
Direction: SW-NE
Address range: 269 to 354
Jersey Ave (Co Rd 631)
Length: 0.26 miles
Direction: SW-NE
Address range: 439 to 516
Direction: SW-NE
Address range: 439 to 516
Grove St
Length: 0.22 miles
Direction: SW-NE
Address range: 229 to 304
Direction: SW-NE
Address range: 229 to 304
Barrow St
Length: 0.21 miles
Direction: SW-NE
Address range: 241 to 306
Direction: SW-NE
Address range: 241 to 306
Grand St
Length: 0.16 miles
Direction: E-W
Address range: 194 to 258
Direction: E-W
Address range: 194 to 258
Luis Munoz Marin Blvd (Henderson St)
Length: 0.15 miles
Direction: N-S
Address range: 102 to 299
Direction: N-S
Address range: 102 to 299
Mercer St
Length: 0.11 miles
Direction: E-W
Address range: 1 to 361
Direction: E-W
Address range: 1 to 361