Valley Citrus Estates neighborhood in Yuma, Arizona (AZ), 85364 detailed profile
Settings
X

Business Search - 14 Million verified businesses
Area: 0.335 square miles
Population: 471
Population density:
| Valley Citrus Estates: | 1,404 people per square mile |
| Yuma: | 924 people per square mile |

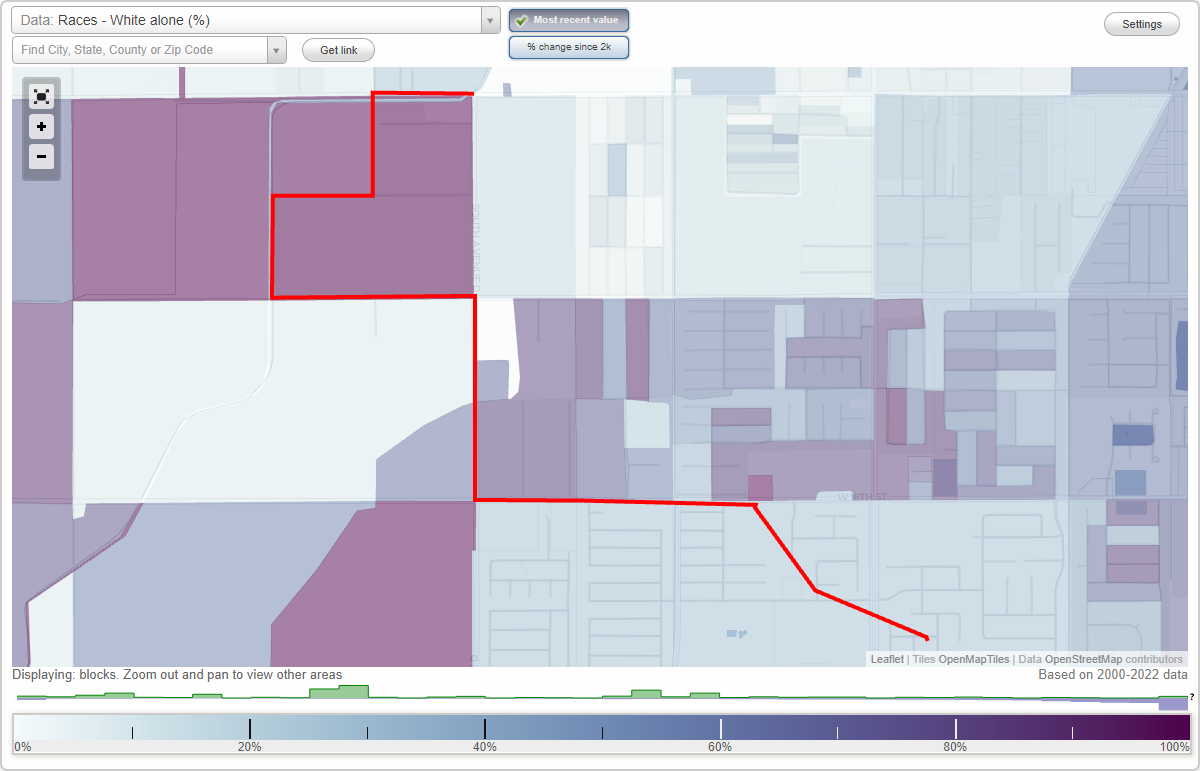
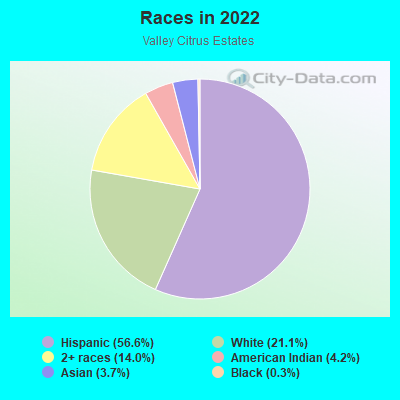
- 33556.6%Hispanic or Latino
- 12521.1%White
- 8314.0%Two or more races
- 254.2%American Indian
- 223.7%Asian
- 20.3%Black
Median household income in 2022:
| Valley Citrus Estates: | $69,864 |
| Yuma: | $58,043 |
Distribution of median household income
![Distribution of median household income]()
- 6Less than $10,000
- 3$10,000 to $19,999
- 76$20,000 to $29,999
- 100$30,000 to $39,999
- 45$40,000 to $49,999
- 13$50,000 to $59,999
- 36$60,000 to $74,999
- 26$75,000 to $99,999
- 24$100,000 to $124,999
- 9$125,000 to $149,999
- 47$150,000 to $199,999
- 26$200,000 or more

Distribution of owner-occupied house/condo value
![Distribution of owner-occupied house/condo value]()
- 59Less than $50,000
- 94$50,000 to $99,999
- 4$100,000 to $149,999
- 50$150,000 to $199,999
- 26$200,000 to $249,999
- 43$250,000 to $299,999
- 4$300,000 to $399,999
- 6$400,000 to $499,999
- 6$500,000 to $749,999
- 15$750,000 to $999,999
- 5$1,000,000 or more

Distribution of rent paid by renters
![Distribution of rent paid by renters]()
- 1Less than $100
- 1$200 to $299
- 1$300 to $399
- 2$400 to $499
- 21$500 to $599
- 1$600 to $699
- 25$700 to $799
- 23$800 to $899
- 9$900 to $999
- 53$1,000 to $1,249
- 21$1,250 to $1,499
- 6$1,500 to $1,999

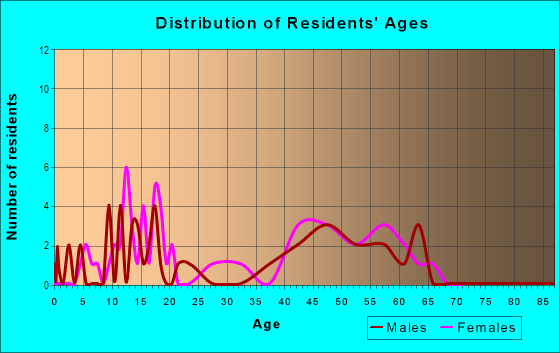
| Males: | 244 |
| Females: | 227 |
Males:
| This neighborhood: | 36.8 years |
| Whole city: | 30.9 years |
| This neighborhood: | 41.4 years |
| Whole city: | 34.5 years |
Average household size:
| Valley Citrus Estates: | 9.1 people |
| Yuma: | 2.5 people |
Percentage of family households:
| Valley Citrus Estates: | 54.1% |
| Yuma: | 50.2% |
| Here: | 43.1% |
| Yuma: | 48.2% |
Percentage of married-couple families with children (among all households):
| Valley Citrus Estates: | 23.4% |
| Yuma: | 27.1% |
Percentage of single-mother households (among all households):
| Valley Citrus Estates: | 7.9% |
| Yuma: | 9.1% |
Percentage of never married males 15 years old and over:
Percentage of never married females 15 years old and over:
| Valley Citrus Estates: | 19.7% |
| Yuma: | 17.2% |
Percentage of never married females 15 years old and over:
| Valley Citrus Estates: | 18.5% |
| city: | 14.0% |
Percentage of people that speak English not well or not at all:
| Valley Citrus Estates: | 6.8% |
| Yuma: | 8.1% |
Percentage of people born in this state:
Percentage of people born in another U.S. state:
Percentage of native residents but born outside the U.S.:
Percentage of foreign born residents:
| Here: | 39.5% |
| Yuma: | 41.5% |
Percentage of people born in another U.S. state:
| Valley Citrus Estates: | 34.9% |
| Yuma: | 36.5% |
Percentage of native residents but born outside the U.S.:
| Here: | 2.2% |
| city: | 2.6% |
Percentage of foreign born residents:
| Here: | 23.4% |
| Yuma: | 19.4% |
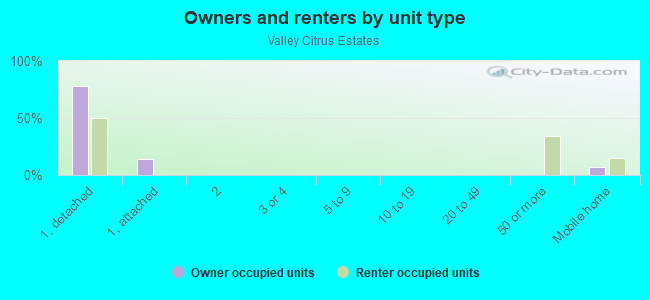
Owner-occupied
Renter-occupied

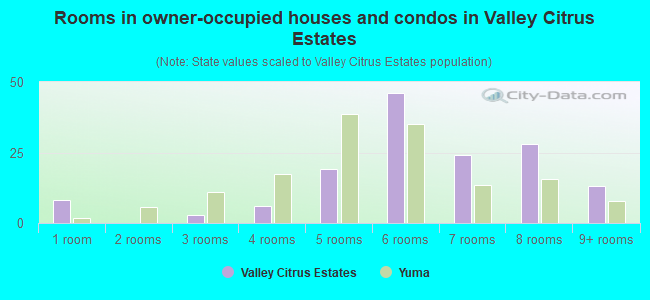
- Rooms in owner-occupied houses and condos in Valley Citrus Estates
- 81 room
- 02 rooms
- 33 rooms
- 64 rooms
- 195 rooms
- 466 rooms
- 247 rooms
- 288 rooms
- 139+ rooms
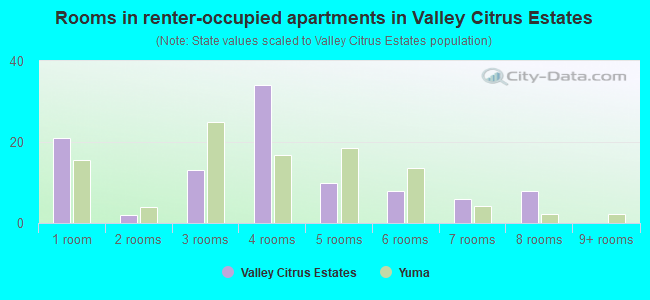
- Rooms in renter-occupied apartments in Valley Citrus Estates
- 211 room
- 22 rooms
- 133 rooms
- 344 rooms
- 105 rooms
- 86 rooms
- 67 rooms
- 88 rooms
- 09+ rooms
Owner-occupied
Renter-occupied
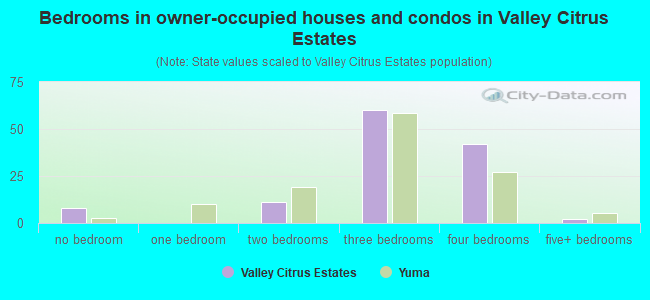
- Bedrooms in owner-occupied houses and condos in Valley Citrus Estates
- 8no bedroom
- 01 bedroom
- 112 bedrooms
- 603 bedrooms
- 424 bedrooms
- 25+ bedrooms
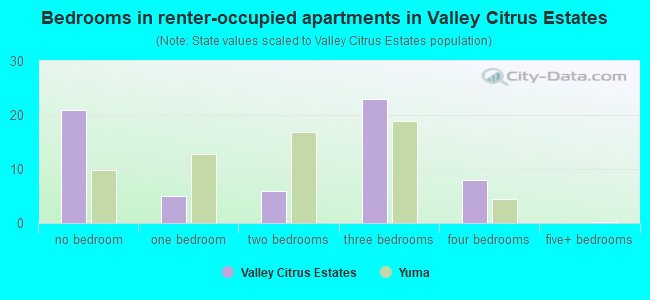
- Bedrooms in renter-occupied apartments in Valley Citrus Estates
- 21no bedroom
- 51 bedroom
- 62 bedrooms
- 233 bedrooms
- 84 bedrooms
- 05+ bedrooms
Average number of cars or other vehicles available in houses/condos:
Average number of cars or other vehicles available in apartments:
| This neighborhood: | 2.3 |
| Yuma: | 2.1 |
Average number of cars or other vehicles available in apartments:
| Here: | 1.6 |
| city: | 1.3 |
Percentage of units with a mortgage:
| Valley Citrus Estates: | 59.7% |
| Yuma: | 59.1% |
Average estimated value of detached houses in 2022 (66.7% of all units):
| Valley Citrus Estates: | $208,757 |
| Yuma: | $212,447 |
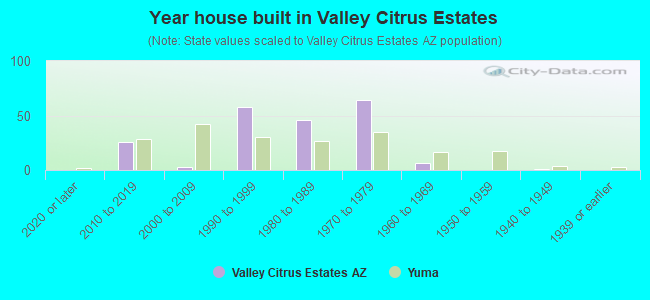
- Year house built in Valley Citrus Estates
- 02020 or later
- 262010 to 2019
- 32000 to 2009
- 581990 to 1999
- 461980 to 1989
- 641970 to 1979
- 61960 to 1969
- 01950 to 1959
- 11940 to 1949
- 01939 or earlier
City-data.com crime index for city in 2020 (higher means more crime):
| City: | 243.7 |
| U.S. average: | 219.5 |
Travel time to work (commute)
![Travel time to work (commute)]()
- 245 to 9 minutes
- 5510 to 14 minutes
- 9915 to 19 minutes
- 3220 to 24 minutes
- 1025 to 29 minutes
- 230 to 34 minutes
- 440 to 44 minutes
- 1445 to 59 minutes
- 560 to 89 minutes
- 2690 or more minutes

Means of transportation to work
![Means of transportation to work]()
- 71.1%154Drove a car alone
- 52.6%114Carpooled
- 0.9%2Motorcycle
- 0.5%1Other means
- 6.0%13Worked at home

Time leaving home to go to work
![Time leaving home to go to work]()
- 612:00 a.m. to 4:59 a.m.
- 105:00 a.m. to 5:29 a.m.
- 195:30 a.m. to 5:59 a.m.
- 116:00 a.m. to 6:29 a.m.
- 96:30 a.m. to 6:59 a.m.
- 497:00 a.m. to 7:29 a.m.
- 417:30 a.m. to 7:59 a.m.
- 198:00 a.m. to 8:29 a.m.
- 318:30 a.m. to 8:59 a.m.
- 59:00 a.m. to 9:59 a.m.
- 210:00 a.m. to 10:59 a.m.
- 311:00 a.m. to 11:59 a.m.
- 1012:00 p.m. to 3:59 p.m.
- 394:00 p.m. to 11:59 p.m.

Occupations of males:
- Percentage of males in management occupations (except farmers):
Here: 4.7% city: 7.9%
- Percentage of males in business and financial operations occupations:
Here: 2.6% city: 2.8%
- Percentage of males in computer and mathematical occupations:
Here: 10.2% city: 1.6%
- Percentage of males in architecture and engineering occupations:
Here: 12.8% city: 3.7%
- Percentage of males in community and social services occupations:
Here: 1.7% city: 1.0%
- Percentage of males in healthcare practitioners and technical occupations:
Here: 10.7% city: 3.4%
- Percentage of males in service occupations:
Here: 23.2% city: 18.5%
- Percentage of males in sales and office occupations:
Here: 4.6% city: 16.9%
- Percentage of males in construction, extraction, and maintenance occupations:
Here: 3.7% city: 6.9%
- Percentage of males in production occupations:
Here: 4.0% city: 5.7%
- Percentage of males in transportation occupations:
Here: 11.9% city: 9.0%
- Percentage of males in material moving occupations:
Here: 1.4% city: 7.3%
Occupations of females:
- Percentage of females in management occupations (except farmers):
Here: 18.0% city: 8.0%
- Percentage of females in community and social services occupations:
Here: 4.0% city: 2.7%
- Percentage of females in legal occupations:
Here: 1.2% city: 0.9%
- Percentage of females in education, training, and library occupations:
Here: 7.4% city: 8.8%
- Percentage of females in healthcare practitioners and technical occupations:
Here: 13.5% city: 9.2%
- Percentage of females in service occupations:
Here: 16.4% city: 24.0%
- Percentage of females in sales and office occupations:
Here: 37.4% city: 32.5%
- Percentage of females in material moving occupations:
Here: 2.4% city: 2.2%
Percentage of people 16-64 in Armed Forces:
| Valley Citrus Estates: | 3.9% |
| Yuma: | 7.0% |
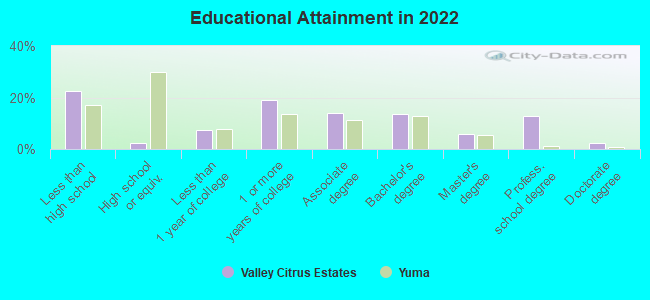
Education in this neighborhood (subdivision or community):
- Percentage of people 3 years and older in K-12 schools:
Valley Citrus Estates: 31.4% Yuma: 18.6%
- Percentage of people 3 years and older in undergraduate colleges:
Valley Citrus Estates: 17.0% Yuma: 4.4%
- Percentage of people 3 years and older in grad. or professional schools:
Valley Citrus Estates: 1.1% Yuma: 0.6%
- Percentage of students K-12 enrolled in private schools:
Valley Citrus Estates: 9.6% Yuma: 14.7%
Percentage of population below poverty level:
| Valley Citrus Estates: | 2.7% |
| Yuma: | 9.8% |
Median year owner moved in (as recorded in 2022):
Median year renter moved in (as recorded in 2022):
| Valley Citrus Estates: | 2013 |
| Yuma: | 2015 |
Median year renter moved in (as recorded in 2022):
| Valley Citrus Estates: | 2017 |
| Yuma: | 2021 |
Percentage of married-couple families with both working:
| Valley Citrus Estates: | 39.7% |
| Yuma: | 58.7% |
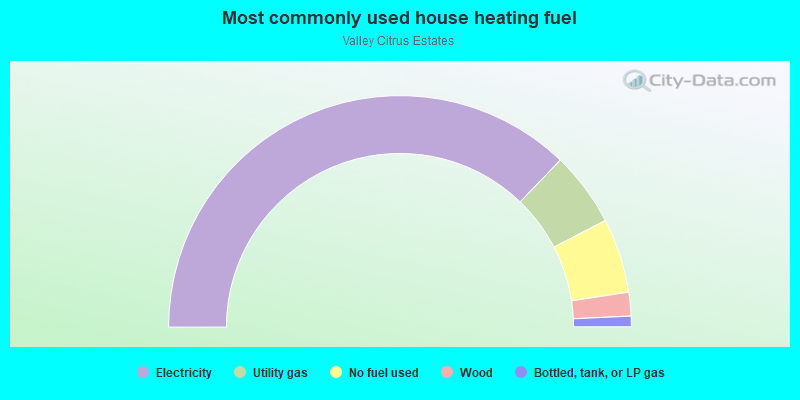
- 74.3%Electricity
- 10.4%Utility gas
- 10.4%No fuel used
- 3.3%Wood
- 1.5%Bottled, tank, or LP gas
Roads and streets:
W Francis St
Length: 0.66 miles
Directions: E-W, N-S
Address range: 5117 to 5499
Directions: E-W, N-S
Address range: 5117 to 5499
W Poppy St
Length: 0.28 miles
Direction: E-W
Address range: 5100 to 5299
Direction: E-W
Address range: 5100 to 5299
S Ave D
Length: 0.26 miles
Direction: N-S
Address range: 8014 to 8298
Direction: N-S
Address range: 8014 to 8298
S 47th Ave
Length: 0.24 miles
Direction: N-S
Address range: 8600 to 8899
Direction: N-S
Address range: 8600 to 8899
W 8th St
Length: 0.23 miles
Direction: E-W
Address range: 5100 to 5349
Direction: E-W
Address range: 5100 to 5349
W Clip St (County 8 1/2 St, W 12th St)
Length: 0.19 miles
Direction: E-W
Address range: 4700 to 4941
Direction: E-W
Address range: 4700 to 4941
S Tobacco Rd
Length: 0.10 miles
Direction: N-S
Address range: 8532 to 8699
Direction: N-S
Address range: 8532 to 8699
Other features:
Central Stub 2 Drn
Length: 0.50 miles
Direction: N-S
Direction: N-S
Cloyd Lateral
Length: 0.27 miles
Directions: E-W, N-S, SE-NW, SW-NE
Directions: E-W, N-S, SE-NW, SW-NE