Valley neighborhood in Buffalo, New York (NY), 14210 detailed profile
Settings
X


Business Search - 14 Million verified businesses
Area: 0.508 square miles
Population: 5,394
Population density:
| Valley: | 10,612 people per square mile |
| Buffalo: | 6,808 people per square mile |

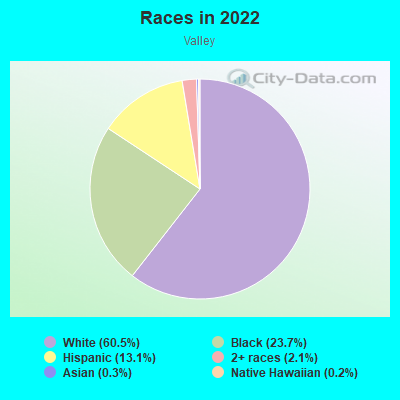
- 3,36060.5%White
- 1,31823.7%Black
- 73013.1%Hispanic or Latino
- 1192.1%Two or more races
- 190.3%Asian
- 100.2%Native Hawaiian and Other
Pacific Islander
Median household income in 2022:
| Valley: | $45,202 |
| Buffalo: | $48,904 |
Distribution of median household income
![Distribution of median household income]()
- 53Less than $10,000
- 230$10,000 to $19,999
- 355$20,000 to $29,999
- 196$30,000 to $39,999
- 143$40,000 to $49,999
- 282$50,000 to $59,999
- 140$60,000 to $74,999
- 87$75,000 to $99,999
- 374$100,000 to $124,999
- 9$125,000 to $149,999
- 61$150,000 to $199,999
- 15$200,000 or more

Distribution of owner-occupied house/condo value
![Distribution of owner-occupied house/condo value]()
- 82Less than $50,000
- 407$50,000 to $99,999
- 284$100,000 to $149,999
- 18$150,000 to $199,999
- 61$200,000 to $249,999
- 13$300,000 to $399,999
- 34$400,000 to $499,999
- 4$500,000 to $749,999
- 10$1,000,000 or more

Distribution of rent paid by renters
![Distribution of rent paid by renters]()
- 20$100 to $199
- 91$200 to $299
- 80$300 to $399
- 145$400 to $499
- 302$500 to $599
- 195$600 to $699
- 153$700 to $799
- 91$800 to $899
- 57$900 to $999
- 214$1,000 to $1,249
- 25$1,250 to $1,499
- 11$1,500 to $1,999

Median rent in 2022:
| Valley: | $594 |
| Buffalo: | $797 |
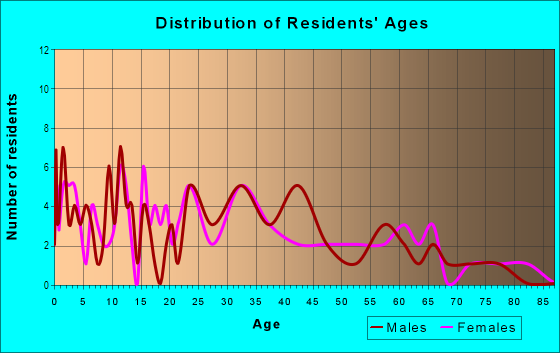
| Males: | 3,070 |
| Females: | 2,323 |
Males:
| This neighborhood: | 37.3 years |
| Whole city: | 34.6 years |
| This neighborhood: | 41.3 years |
| Whole city: | 35.0 years |
Average household size:
| Valley: | 13.1 people |
| Buffalo: | 2.2 people |
Percentage of family households:
| Valley: | 63.2% |
| Buffalo: | 35.8% |
| Here: | 44.2% |
| Buffalo: | 24.5% |
Percentage of married-couple families with children (among all households):
| Valley: | 13.1% |
| Buffalo: | 22.3% |
Percentage of single-mother households (among all households):
| Valley: | 15.4% |
| Buffalo: | 17.8% |
Percentage of never married males 15 years old and over:
Percentage of never married females 15 years old and over:
| Valley: | 23.1% |
| Buffalo: | 25.6% |
Percentage of never married females 15 years old and over:
| Valley: | 18.8% |
| city: | 26.3% |
Percentage of people that speak English not well or not at all:
| Valley: | 0.0% |
| Buffalo: | 4.0% |
Percentage of people born in this state:
Percentage of people born in another U.S. state:
Percentage of native residents but born outside the U.S.:
Percentage of foreign born residents:
| Here: | 90.1% |
| Buffalo: | 75.1% |
Percentage of people born in another U.S. state:
| Valley: | 3.0% |
| Buffalo: | 10.9% |
Percentage of native residents but born outside the U.S.:
| Here: | 4.9% |
| city: | 3.9% |
Percentage of foreign born residents:
| Here: | 1.9% |
| Buffalo: | 10.0% |
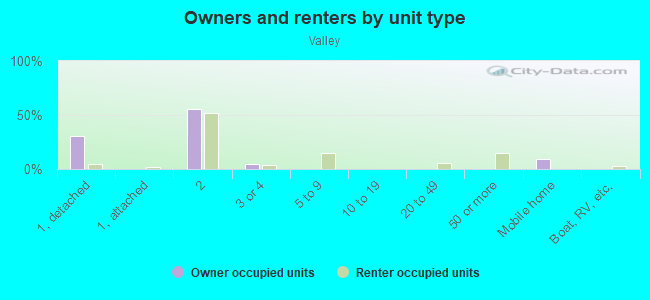
Owner-occupied
Renter-occupied

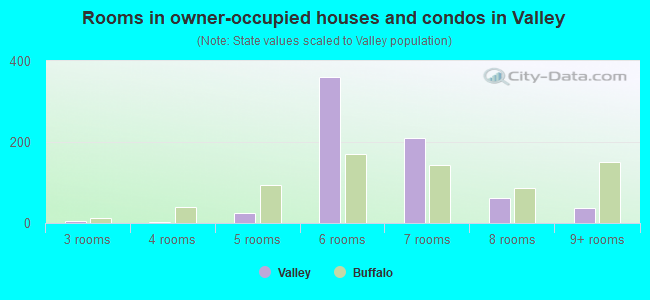
- Rooms in owner-occupied houses and condos in Valley
- 01 room
- 02 rooms
- 43 rooms
- 34 rooms
- 245 rooms
- 3616 rooms
- 2117 rooms
- 618 rooms
- 379+ rooms
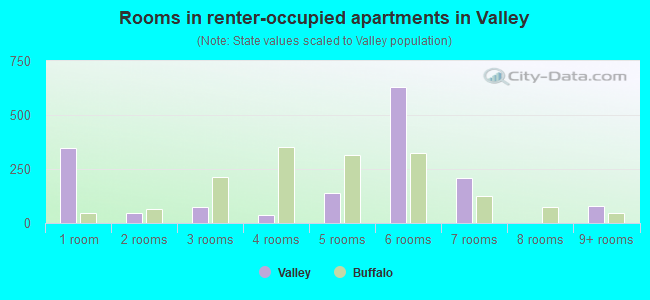
- Rooms in renter-occupied apartments in Valley
- 3461 room
- 472 rooms
- 753 rooms
- 354 rooms
- 1415 rooms
- 6296 rooms
- 2077 rooms
- 18 rooms
- 789+ rooms
Owner-occupied
Renter-occupied
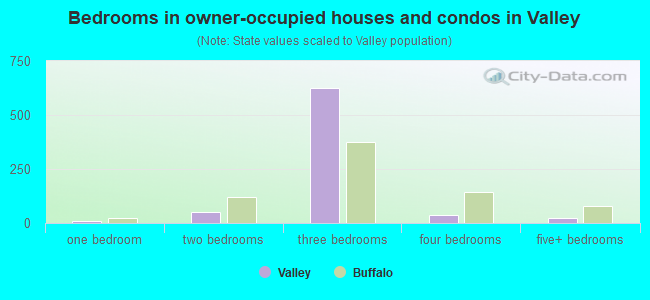
- Bedrooms in owner-occupied houses and condos in Valley
- 0no bedroom
- 111 bedroom
- 492 bedrooms
- 6273 bedrooms
- 354 bedrooms
- 235+ bedrooms
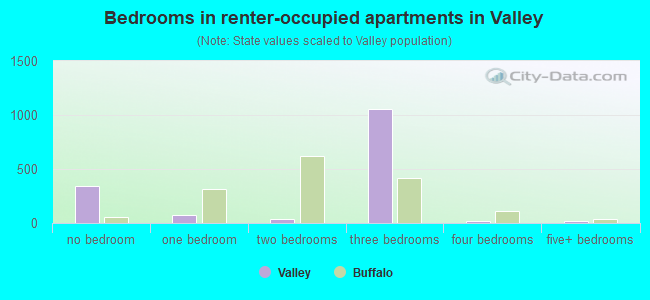
- Bedrooms in renter-occupied apartments in Valley
- 346no bedroom
- 761 bedroom
- 412 bedrooms
- 1,0513 bedrooms
- 144 bedrooms
- 165+ bedrooms
Average number of cars or other vehicles available in houses/condos:
Average number of cars or other vehicles available in apartments:
| This neighborhood: | 1.0 |
| Buffalo: | 1.5 |
Average number of cars or other vehicles available in apartments:
| Here: | 1.5 |
| city: | 0.9 |
Percentage of units with a mortgage:
| Valley: | 86.5% |
| Buffalo: | 48.3% |
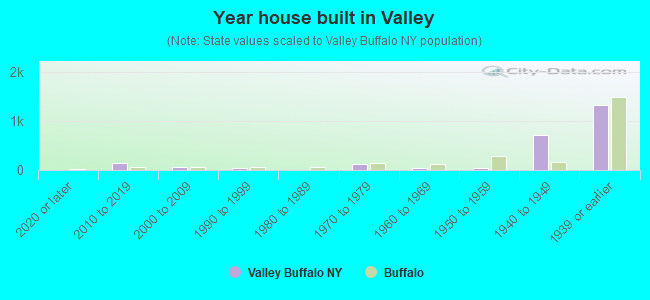
- Year house built in Valley
- 02020 or later
- 1332010 to 2019
- 712000 to 2009
- 371990 to 1999
- 101980 to 1989
- 1251970 to 1979
- 331960 to 1969
- 341950 to 1959
- 7051940 to 1949
- 1,3131939 or earlier
City-data.com crime index for city in 2020 (higher means more crime):
| City: | 441.3 |
| U.S. average: | 219.5 |
Travel time to work (commute)
![Travel time to work (commute)]()
- 2295 to 9 minutes
- 43610 to 14 minutes
- 77215 to 19 minutes
- 31220 to 24 minutes
- 7025 to 29 minutes
- 15430 to 34 minutes
- 1045 to 59 minutes
- 1560 to 89 minutes
- 5190 or more minutes

Means of transportation to work
![Means of transportation to work]()
- 79.2%1,294Drove a car alone
- 12.8%209Carpooled
- 1.1%18Bus
- 2.2%36Taxi
- 0.4%7Bicycle
- 4.0%65Walked
- 4.3%70Other means
- 3.2%53Worked at home

Time leaving home to go to work
![Time leaving home to go to work]()
- 10112:00 a.m. to 4:59 a.m.
- 2305:00 a.m. to 5:29 a.m.
- 145:30 a.m. to 5:59 a.m.
- 2756:00 a.m. to 6:29 a.m.
- 2276:30 a.m. to 6:59 a.m.
- 2147:00 a.m. to 7:29 a.m.
- 1547:30 a.m. to 7:59 a.m.
- 2458:00 a.m. to 8:29 a.m.
- 888:30 a.m. to 8:59 a.m.
- 799:00 a.m. to 9:59 a.m.
- 8010:00 a.m. to 10:59 a.m.
- 4011:00 a.m. to 11:59 a.m.
- 11212:00 p.m. to 3:59 p.m.
- 2624:00 p.m. to 11:59 p.m.

Occupations of males:
- Percentage of males in business and financial operations occupations:
Here: 6.0% city: 4.0%
- Percentage of males in computer and mathematical occupations:
Here: 2.2% city: 3.5%
- Percentage of males in architecture and engineering occupations:
Here: 9.2% city: 2.9%
- Percentage of males in legal occupations:
Here: 6.0% city: 1.8%
- Percentage of males in education, training, and library occupations:
Here: 1.1% city: 4.7%
- Percentage of males in arts, design, entertainment, sports, and media occupations:
Here: 6.5% city: 1.7%
- Percentage of males in healthcare practitioners and technical occupations:
Here: 3.6% city: 2.6%
- Percentage of males in sales and office occupations:
Here: 15.5% city: 15.9%
- Percentage of males in construction, extraction, and maintenance occupations:
Here: 18.1% city: 5.6%
- Percentage of males in production occupations:
Here: 22.6% city: 7.3%
- Percentage of males in material moving occupations:
Here: 21.6% city: 7.6%
Occupations of females:
- Percentage of females in management occupations (except farmers):
Here: 28.6% city: 7.4%
- Percentage of females in business and financial operations occupations:
Here: 11.5% city: 5.0%
- Percentage of females in computer and mathematical occupations:
Here: 1.5% city: 1.1%
- Percentage of females in community and social services occupations:
Here: 14.4% city: 3.5%
- Percentage of females in legal occupations:
Here: 11.2% city: 1.8%
- Percentage of females in education, training, and library occupations:
Here: 40.1% city: 10.9%
- Percentage of females in healthcare practitioners and technical occupations:
Here: 4.0% city: 8.0%
- Percentage of females in production occupations:
Here: 18.6% city: 3.4%
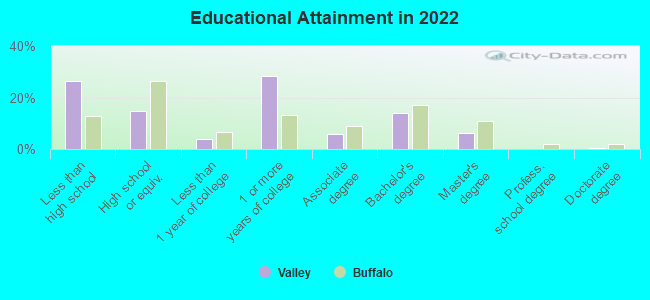
Education in this neighborhood (subdivision or community):
- Percentage of people 3 years and older in K-12 schools:
Valley: 39.3% Buffalo: 16.7%
- Percentage of people 3 years and older in undergraduate colleges:
Valley: 0.4% Buffalo: 6.6%
- Percentage of people 3 years and older in grad. or professional schools:
Valley: 0.4% Buffalo: 2.5%
- Percentage of students K-12 enrolled in private schools:
Valley: 5.7% Buffalo: 11.8%
Percentage of population below poverty level:
| Valley: | 14.2% |
| Buffalo: | 23.6% |
Median year owner moved in (as recorded in 2022):
Median year renter moved in (as recorded in 2022):
| Valley: | 1998 |
| Buffalo: | 2008 |
Median year renter moved in (as recorded in 2022):
| Valley: | 2012 |
| Buffalo: | 2019 |
Percentage of married-couple families with both working:
| Valley: | 73.3% |
| Buffalo: | 64.1% |
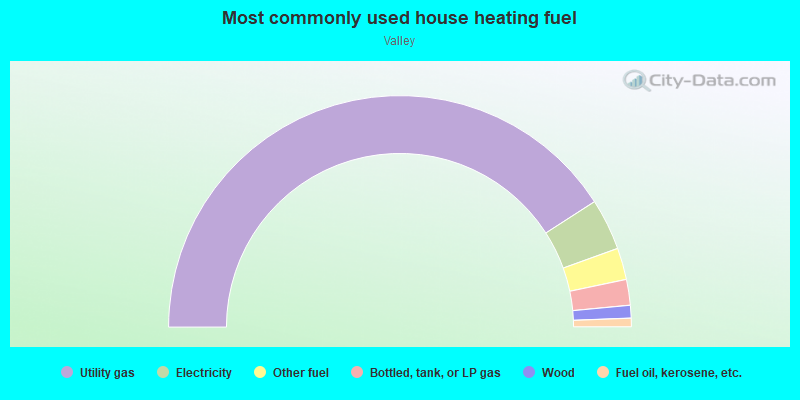
- 81.8%Utility gas
- 7.2%Electricity
- 4.4%Other fuel
- 3.6%Bottled, tank, or LP gas
- 1.8%Wood
- 1.2%Fuel oil, kerosene, etc.
Highways in this neighborhood:
US Hwy 62 (Bailey Ave)
Length: 0.34 miles
Directions: N-S, SE-NW, SW-NE
Address range: 166 to 321
Directions: N-S, SE-NW, SW-NE
Address range: 166 to 321
Roads and streets:
Elk St
Length: 1.34 miles
Direction: E-W
Address range: 275 to 784
Direction: E-W
Address range: 275 to 784
S Park Ave
Length: 0.39 miles
Direction: SE-NW
Address range: 929 to 1080
Direction: SE-NW
Address range: 929 to 1080
Perry St
Length: 0.35 miles
Direction: E-W
Address range: 1180 to 1399
Direction: E-W
Address range: 1180 to 1399
Lee St
Length: 0.33 miles
Directions: E-W, N-S, SW-NE
Address range: 1 to 199
Directions: E-W, N-S, SW-NE
Address range: 1 to 199
Babcock St
Length: 0.21 miles
Direction: N-S
Address range: 1 to 71
Direction: N-S
Address range: 1 to 71
Orlando St
Length: 0.15 miles
Direction: N-S
Address range: 1 to 83
Direction: N-S
Address range: 1 to 83
Dole St
Length: 0.15 miles
Direction: SW-NE
Address range: 1 to 99
Direction: SW-NE
Address range: 1 to 99
Bradford St
Length: 0.14 miles
Directions: N-S, SW-NE
Address range: 1 to 99
Directions: N-S, SW-NE
Address range: 1 to 99
Gorham St
Length: 0.14 miles
Direction: N-S
Address range: 1 to 99
Direction: N-S
Address range: 1 to 99
Owahn Pl
Length: 0.13 miles
Direction: SW-NE
Address range: 1 to 99
Direction: SW-NE
Address range: 1 to 99
Smith St
Length: 0.11 miles
Direction: SW-NE
Address range: 137 to 190
Direction: SW-NE
Address range: 137 to 190
Winona St
Length: 0.11 miles
Direction: N-S
Address range: 100 to 299
Direction: N-S
Address range: 100 to 299
Duncan St
Length: 0.11 miles
Direction: SW-NE
Address range: 1 to 57
Direction: SW-NE
Address range: 1 to 57
Kellogg St
Length: 0.10 miles
Direction: SW-NE
Address range: 1 to 99
Direction: SW-NE
Address range: 1 to 99
Prenatt St
Length: 0.09 miles
Direction: E-W
Address range: 100 to 149
Direction: E-W
Address range: 100 to 149
Keating St
Length: 0.08 miles
Direction: SW-NE
Address range: 2 to 68
Direction: SW-NE
Address range: 2 to 68
Maurice St
Length: 0.04 miles
Direction: N-S
Address range: 1 to 80
Direction: N-S
Address range: 1 to 80
Railroad features:
Erie-Lackawanna RR
Length: 0.47 miles
Direction: SW-NE
Direction: SW-NE
Norfolk and Western Rlwy
Length: 0.28 miles
Direction: SW-NE
Direction: SW-NE
Other features:
Cazenovia Crk
Length: 0.15 miles
Direction: E-W
Direction: E-W