Valencia neighborhood in San Bernardino, California (CA), 92404 detailed profile
Settings
X


Business Search - 14 Million verified businesses
Area: 0.087 square miles
Population: 689
Population density:
| Valencia: | 7,923 people per square mile |
| San Bernardino: | 3,746 people per square mile |

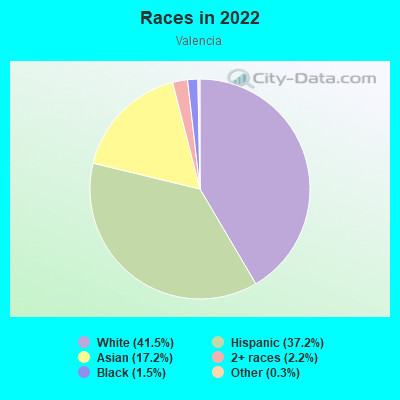
- 53573.3%Hispanic or Latino
- 8812.1%White
- 496.7%Asian
- 364.9%Two or more races
- 223.0%Black
Median household income in 2022:
| Valencia: | $73,158 |
| San Bernardino: | $62,801 |
Distribution of median household income
![Distribution of median household income]()
- 29Less than $10,000
- 11$10,000 to $19,999
- 18$20,000 to $29,999
- 13$30,000 to $39,999
- 44$40,000 to $49,999
- 31$50,000 to $59,999
- 21$60,000 to $74,999
- 34$75,000 to $99,999
- 33$100,000 to $124,999
- 24$125,000 to $149,999
- 19$150,000 to $199,999
- 3$200,000 or more

Distribution of owner-occupied house/condo value
![Distribution of owner-occupied house/condo value]()
- 1Less than $50,000
- 2$50,000 to $99,999
- 3$100,000 to $149,999
- 21$150,000 to $199,999
- 37$200,000 to $249,999
- 30$250,000 to $299,999
- 28$300,000 to $399,999
- 17$400,000 to $499,999
- 20$500,000 to $749,999
- 3$750,000 to $999,999
- 1$1,000,000 or more

Distribution of rent paid by renters
![Distribution of rent paid by renters]()
- 4$200 to $299
- 3$400 to $499
- 16$700 to $799
- 5$800 to $899
- 6$900 to $999
- 39$1,000 to $1,249
- 25$1,250 to $1,499
- 7$1,500 to $1,999
- 10$2,000 or more

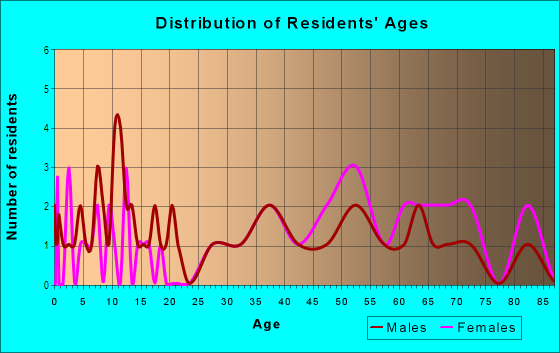
| Males: | 340 |
| Females: | 349 |
Males:
| This neighborhood: | 29.9 years |
| Whole city: | 31.7 years |
| This neighborhood: | 30.6 years |
| Whole city: | 32.5 years |
Average household size:
| Valencia: | 3.5 people |
| San Bernardino: | 3.3 people |
Percentage of family households:
| Valencia: | 57.7% |
| San Bernardino: | 56.8% |
| Here: | 51.8% |
| San Bernardino: | 43.4% |
Percentage of married-couple families with children (among all households):
| Valencia: | 16.8% |
| San Bernardino: | 16.8% |
Percentage of single-mother households (among all households):
| Valencia: | 18.5% |
| San Bernardino: | 9.3% |
Percentage of never married males 15 years old and over:
Percentage of never married females 15 years old and over:
| Valencia: | 20.9% |
| San Bernardino: | 24.3% |
Percentage of never married females 15 years old and over:
| Valencia: | 25.5% |
| city: | 23.1% |
Percentage of people that speak English not well or not at all:
| Valencia: | 5.6% |
| San Bernardino: | 9.9% |
Percentage of people born in this state:
Percentage of people born in another U.S. state:
Percentage of native residents but born outside the U.S.:
Percentage of foreign born residents:
| Here: | 70.2% |
| San Bernardino: | 68.5% |
Percentage of people born in another U.S. state:
| Valencia: | 7.3% |
| San Bernardino: | 8.1% |
Percentage of native residents but born outside the U.S.:
| Here: | 0.8% |
| city: | 1.1% |
Percentage of foreign born residents:
| Here: | 21.6% |
| San Bernardino: | 22.3% |
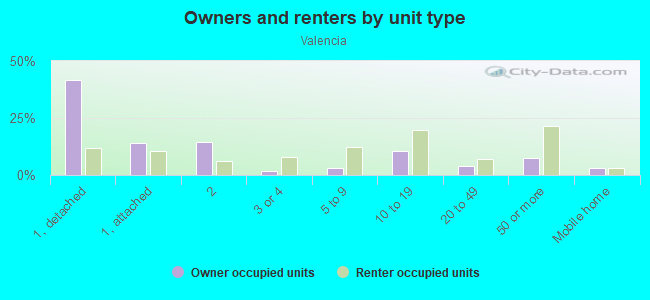
Owner-occupied
Renter-occupied

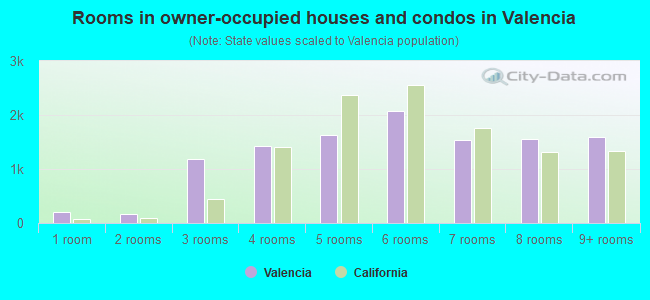
- Rooms in owner-occupied houses and condos in Valencia
- 01 room
- 02 rooms
- 43 rooms
- 144 rooms
- 595 rooms
- 186 rooms
- 97 rooms
- 268 rooms
- 179+ rooms
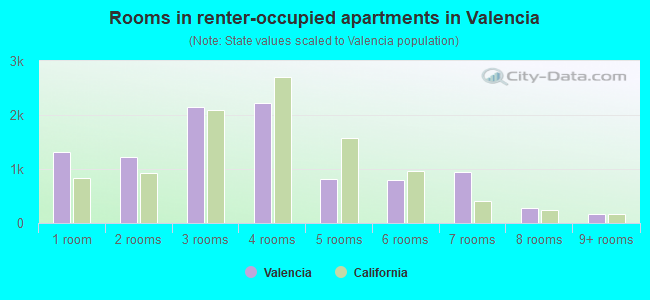
- Rooms in renter-occupied apartments in Valencia
- 01 room
- 222 rooms
- 43 rooms
- 164 rooms
- 265 rooms
- 186 rooms
- 67 rooms
- 28 rooms
- 09+ rooms
Owner-occupied
Renter-occupied
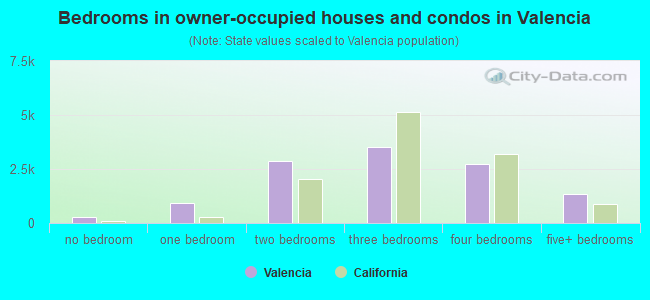
- Bedrooms in owner-occupied houses and condos in Valencia
- 0no bedroom
- 01 bedroom
- 142 bedrooms
- 933 bedrooms
- 144 bedrooms
- 105+ bedrooms
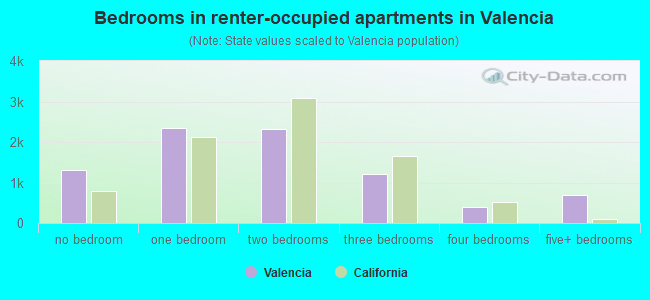
- Bedrooms in renter-occupied apartments in Valencia
- 0no bedroom
- 371 bedroom
- 352 bedrooms
- 143 bedrooms
- 44 bedrooms
- 65+ bedrooms
Average number of cars or other vehicles available in houses/condos:
Average number of cars or other vehicles available in apartments:
| This neighborhood: | 2.3 |
| San Bernardino: | 2.5 |
Average number of cars or other vehicles available in apartments:
| Here: | 2.5 |
| city: | 1.6 |
Percentage of units with a mortgage:
| Valencia: | 69.4% |
| San Bernardino: | 62.7% |
Average estimated value of detached houses in 2022 (77.7% of all units):
| Valencia: | $352,588 |
| San Bernardino: | $387,676 |

- Year house built in Valencia
- 02020 or later
- 02010 to 2019
- 02000 to 2009
- 221990 to 1999
- 91980 to 1989
- 231970 to 1979
- 191960 to 1969
- 941950 to 1959
- 121940 to 1949
- 251939 or earlier
City-data.com crime index for city in 2020 (higher means more crime):
| City: | 568.1 |
| U.S. average: | 219.5 |
Travel time to work (commute)
![Travel time to work (commute)]()
- 7Less than 5 minutes
- 205 to 9 minutes
- 3010 to 14 minutes
- 3215 to 19 minutes
- 2320 to 24 minutes
- 925 to 29 minutes
- 3730 to 34 minutes
- 1435 to 39 minutes
- 240 to 44 minutes
- 2645 to 59 minutes
- 1160 to 89 minutes
- 1190 or more minutes

Means of transportation to work
![Means of transportation to work]()
- 84.9%230Drove a car alone
- 17.7%48Carpooled
- 0.4%1Bus
- 2.6%7Walked
- 1.1%3Other means
- 8.5%23Worked at home

Time leaving home to go to work
![Time leaving home to go to work]()
- 4512:00 a.m. to 4:59 a.m.
- 165:00 a.m. to 5:29 a.m.
- 55:30 a.m. to 5:59 a.m.
- 396:00 a.m. to 6:29 a.m.
- 216:30 a.m. to 6:59 a.m.
- 207:00 a.m. to 7:29 a.m.
- 147:30 a.m. to 7:59 a.m.
- 88:00 a.m. to 8:29 a.m.
- 28:30 a.m. to 8:59 a.m.
- 219:00 a.m. to 9:59 a.m.
- 310:00 a.m. to 10:59 a.m.
- 712:00 p.m. to 3:59 p.m.
- 174:00 p.m. to 11:59 p.m.

Occupations of males:
- Percentage of males in management occupations (except farmers):
Here: 3.1% city: 4.9%
- Percentage of males in computer and mathematical occupations:
Here: 1.3% city: 1.4%
- Percentage of males in architecture and engineering occupations:
Here: 1.5% city: 1.0%
- Percentage of males in community and social services occupations:
Here: 3.0% city: 1.0%
- Percentage of males in education, training, and library occupations:
Here: 4.8% city: 2.4%
- Percentage of males in arts, design, entertainment, sports, and media occupations:
Here: 3.6% city: 1.7%
- Percentage of males in service occupations:
Here: 31.2% city: 15.6%
- Percentage of males in sales and office occupations:
Here: 3.7% city: 11.9%
- Percentage of males in construction, extraction, and maintenance occupations:
Here: 8.5% city: 15.2%
- Percentage of males in production occupations:
Here: 9.7% city: 8.1%
- Percentage of males in transportation occupations:
Here: 5.4% city: 8.9%
- Percentage of males in material moving occupations:
Here: 18.2% city: 15.8%
Occupations of females:
- Percentage of females in management occupations (except farmers):
Here: 7.7% city: 6.2%
- Percentage of females in business and financial operations occupations:
Here: 1.2% city: 3.2%
- Percentage of females in community and social services occupations:
Here: 1.6% city: 2.2%
- Percentage of females in education, training, and library occupations:
Here: 7.6% city: 5.7%
- Percentage of females in healthcare practitioners and technical occupations:
Here: 5.0% city: 6.0%
- Percentage of females in service occupations:
Here: 19.7% city: 26.5%
- Percentage of females in sales and office occupations:
Here: 43.4% city: 28.8%
- Percentage of females in production occupations:
Here: 3.5% city: 5.6%
- Percentage of females in material moving occupations:
Here: 18.1% city: 9.9%
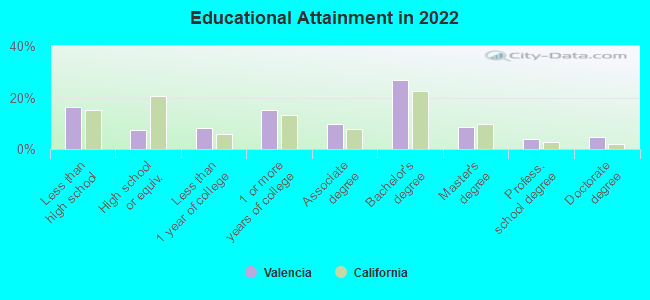
Education in this neighborhood (subdivision or community):
- Percentage of people 3 years and older in K-12 schools:
Valencia: 33.6% San Bernardino: 20.4%
- Percentage of people 3 years and older in undergraduate colleges:
Valencia: 7.8% San Bernardino: 5.8%
- Percentage of people 3 years and older in grad. or professional schools:
Valencia: 1.7% San Bernardino: 0.8%
- Percentage of students K-12 enrolled in private schools:
Valencia: 0.9% San Bernardino: 4.3%
Percentage of population below poverty level:
| Valencia: | 12.7% |
| San Bernardino: | 17.5% |
Median year owner moved in (as recorded in 2022):
| Valencia: | 2008 |
| San Bernardino: | 2008 |
Percentage of married-couple families with both working:
| Valencia: | 82.6% |
| San Bernardino: | 52.9% |
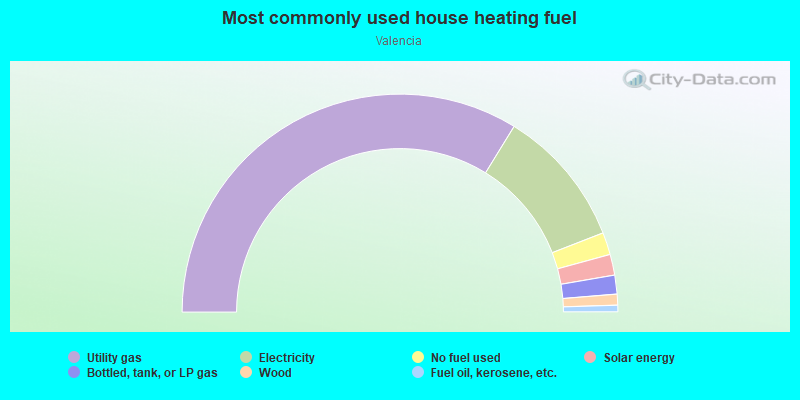
- 58.9%Utility gas
- 21.3%Electricity
- 14.5%Solar energy
- 5.4%No fuel used
Roads and streets:
Valencia Ave
Length: 0.23 miles
Direction: N-S
Address range: 3000 to 3181
Direction: N-S
Address range: 3000 to 3181
E Val Mar Dr
Length: 0.22 miles
Direction: E-W
Address range: 700 to 899
Direction: E-W
Address range: 700 to 899
North Rd
Length: 0.22 miles
Direction: E-W
Address range: 700 to 899
Direction: E-W
Address range: 700 to 899
Lynwood Dr E
Length: 0.21 miles
Direction: E-W
Address range: 650 to 799
Direction: E-W
Address range: 650 to 799
Mockingbird Ln
Length: 0.19 miles
Direction: E-W
Address range: 700 to 899
Direction: E-W
Address range: 700 to 899
N San Gabriel St
Length: 0.17 miles
Direction: N-S
Address range: 3000 to 3199
Direction: N-S
Address range: 3000 to 3199
Fremontia Dr
Length: 0.08 miles
Direction: N-S
Address range: 3000 to 3099
Direction: N-S
Address range: 3000 to 3099
E 30th St
Length: 0.07 miles
Direction: E-W
Address range: 651 to 699
Direction: E-W
Address range: 651 to 699
Windsor Dr
Length: 0.05 miles
Direction: N-S
Address range: 3100 to 3167
Direction: N-S
Address range: 3100 to 3167
E North St
Length: 0.03 miles
Direction: E-W
Address range: 850 to 899
Direction: E-W
Address range: 850 to 899