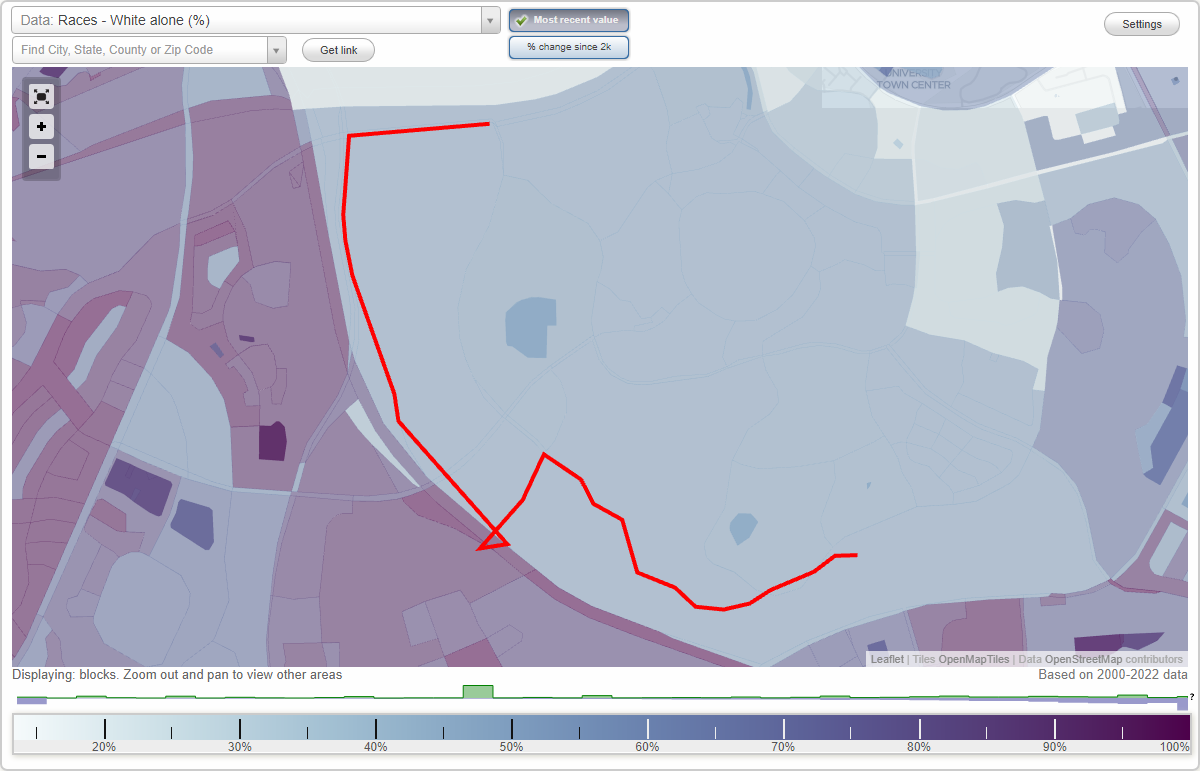
University Research Park neighborhood in Irvine, California (CA), 92612 detailed profile
Settings
X

Business Search - 14 Million verified businesses
Area: 0.290 square miles
Population: 682
Population density:
| University Research Park: | 2,349 people per square mile |
| Irvine: | 6,793 people per square mile |

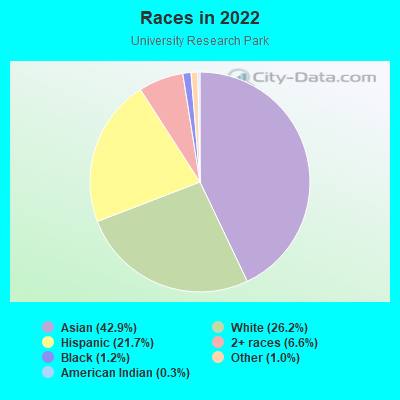
- 31042.9%Asian
- 18926.2%White
- 15721.7%Hispanic or Latino
- 486.6%Two or more races
- 91.2%Black
- 71.0%Some other race
- 20.3%American Indian
Median household income in 2022:
| University Research Park: | $182,873 |
| Irvine: | $123,003 |
Distribution of median household income
![Distribution of median household income]()
- 44Less than $10,000
- 17$10,000 to $19,999
- 32$20,000 to $29,999
- 24$30,000 to $39,999
- 17$40,000 to $49,999
- 4$50,000 to $59,999
- 45$60,000 to $74,999
- 23$75,000 to $99,999
- 23$100,000 to $124,999
- 3$125,000 to $149,999
- 15$150,000 to $199,999
- 29$200,000 or more

Distribution of owner-occupied house/condo value
![Distribution of owner-occupied house/condo value]()
- 1Less than $50,000
- 3$100,000 to $149,999
- 1$150,000 to $199,999
- 5$200,000 to $249,999
- 3$250,000 to $299,999
- 2$300,000 to $399,999
- 28$400,000 to $499,999
- 27$500,000 to $749,999
- 39$750,000 to $999,999
- 15$1,000,000 or more

Distribution of rent paid by renters
![Distribution of rent paid by renters]()
- 4Less than $100
- 3$200 to $299
- 10$600 to $699
- 12$700 to $799
- 27$800 to $899
- 13$900 to $999
- 24$1,000 to $1,249
- 38$1,250 to $1,499
- 121$1,500 to $1,999
- 26$2,000 or more

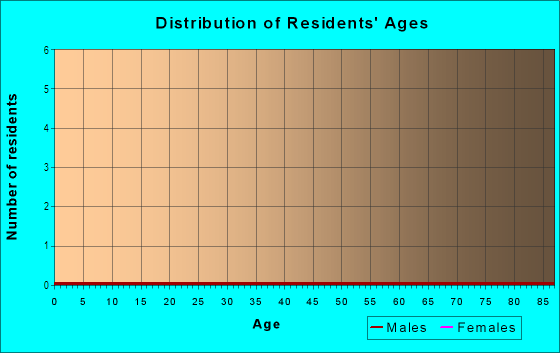
| Males: | 309 |
| Females: | 372 |
Males:
| This neighborhood: | 40.5 years |
| Whole city: | 32.6 years |
| This neighborhood: | 49.3 years |
| Whole city: | 33.9 years |
Average household size:
| University Research Park: | 9.8 people |
| Irvine: | 2.6 people |
Percentage of family households:
| University Research Park: | 25.2% |
| Irvine: | 53.4% |
| Here: | 20.6% |
| Irvine: | 49.9% |
Percentage of married-couple families with children (among all households):
| University Research Park: | 11.4% |
| Irvine: | 28.7% |
Percentage of single-mother households (among all households):
| University Research Park: | 24.4% |
| Irvine: | 6.0% |
Percentage of never married males 15 years old and over:
Percentage of never married females 15 years old and over:
| University Research Park: | 32.3% |
| Irvine: | 19.8% |
Percentage of never married females 15 years old and over:
| University Research Park: | 46.2% |
| city: | 19.0% |
Percentage of people that speak English not well or not at all:
| University Research Park: | 3.2% |
| Irvine: | 6.2% |
Percentage of people born in this state:
Percentage of people born in another U.S. state:
Percentage of native residents but born outside the U.S.:
Percentage of foreign born residents:
| Here: | 53.8% |
| Irvine: | 42.7% |
Percentage of people born in another U.S. state:
| University Research Park: | 14.9% |
| Irvine: | 16.2% |
Percentage of native residents but born outside the U.S.:
| Here: | 3.0% |
| city: | 1.5% |
Percentage of foreign born residents:
| Here: | 28.4% |
| Irvine: | 39.6% |
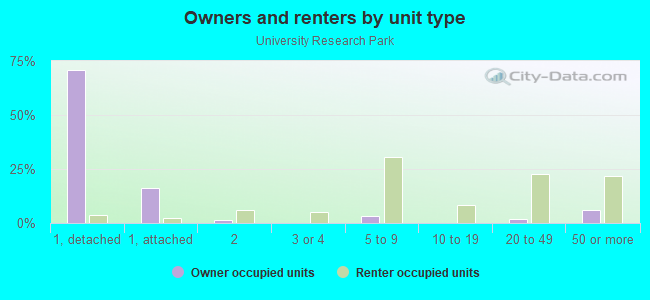
Owner-occupied
Renter-occupied

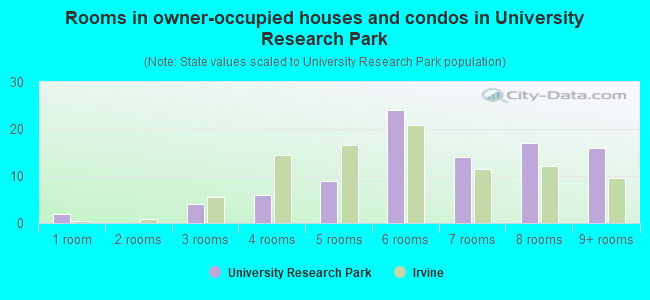
- Rooms in owner-occupied houses and condos in University Research Park
- 21 room
- 02 rooms
- 43 rooms
- 64 rooms
- 95 rooms
- 246 rooms
- 147 rooms
- 178 rooms
- 169+ rooms
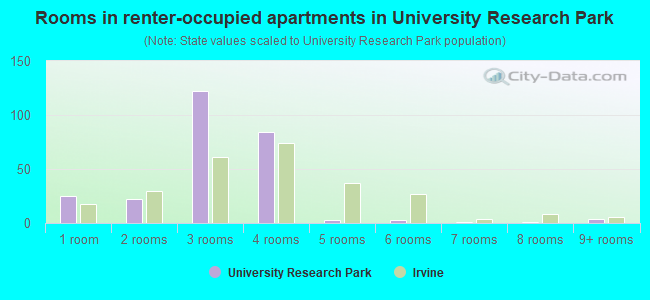
- Rooms in renter-occupied apartments in University Research Park
- 251 room
- 222 rooms
- 1223 rooms
- 844 rooms
- 35 rooms
- 36 rooms
- 17 rooms
- 18 rooms
- 49+ rooms
Owner-occupied
Renter-occupied
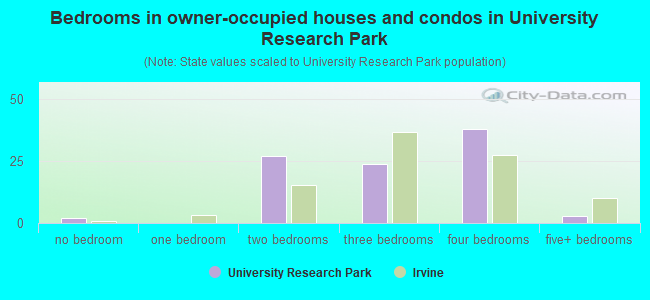
- Bedrooms in owner-occupied houses and condos in University Research Park
- 2no bedroom
- 01 bedroom
- 272 bedrooms
- 243 bedrooms
- 384 bedrooms
- 35+ bedrooms
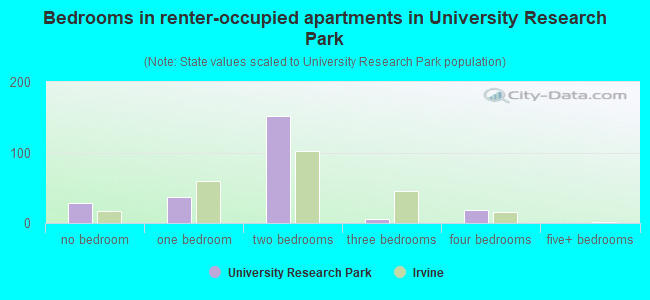
- Bedrooms in renter-occupied apartments in University Research Park
- 28no bedroom
- 371 bedroom
- 1522 bedrooms
- 63 bedrooms
- 194 bedrooms
- 05+ bedrooms
Average number of cars or other vehicles available in houses/condos:
Average number of cars or other vehicles available in apartments:
| This neighborhood: | |
| Irvine: |
Average number of cars or other vehicles available in apartments:
| Here: | 1.2 |
| city: | 1.5 |
Percentage of units with a mortgage:
| University Research Park: | 38.3% |
| Irvine: | 67.0% |
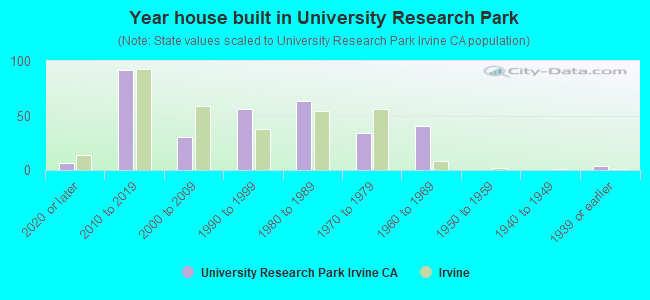
- Year house built in University Research Park
- 62020 or later
- 922010 to 2019
- 302000 to 2009
- 561990 to 1999
- 631980 to 1989
- 341970 to 1979
- 401960 to 1969
- 01950 to 1959
- 01940 to 1949
- 41939 or earlier
City-data.com crime index for city in 2020 (higher means more crime):
| City: | 91.9 |
| U.S. average: | 219.5 |
Travel time to work (commute)
![Travel time to work (commute)]()
- 4Less than 5 minutes
- 495 to 9 minutes
- 9010 to 14 minutes
- 8215 to 19 minutes
- 5920 to 24 minutes
- 1725 to 29 minutes
- 3330 to 34 minutes
- 335 to 39 minutes
- 140 to 44 minutes
- 145 to 59 minutes
- 760 to 89 minutes
- 790 or more minutes

Means of transportation to work
![Means of transportation to work]()
- 26.1%91Drove a car alone
- 1.7%6Carpooled
- 3.4%12Bus
- 15.8%55Bicycle
- 28.1%98Walked
- 1.1%4Other means
- 24.7%86Worked at home

Time leaving home to go to work
![Time leaving home to go to work]()
- 912:00 a.m. to 4:59 a.m.
- 25:00 a.m. to 5:29 a.m.
- 45:30 a.m. to 5:59 a.m.
- 46:00 a.m. to 6:29 a.m.
- 26:30 a.m. to 6:59 a.m.
- 277:00 a.m. to 7:29 a.m.
- 427:30 a.m. to 7:59 a.m.
- 428:00 a.m. to 8:29 a.m.
- 568:30 a.m. to 8:59 a.m.
- 599:00 a.m. to 9:59 a.m.
- 3110:00 a.m. to 10:59 a.m.
- 1211:00 a.m. to 11:59 a.m.
- 4312:00 p.m. to 3:59 p.m.
- 254:00 p.m. to 11:59 p.m.

Occupations of males:
- Percentage of males in management occupations (except farmers):
Here: 7.7% city: 19.7%
- Percentage of males in business and financial operations occupations:
Here: 4.2% city: 9.2%
- Percentage of males in computer and mathematical occupations:
Here: 3.7% city: 14.7%
- Percentage of males in architecture and engineering occupations:
Here: 10.0% city: 9.3%
- Percentage of males in life, physical, and social science occupations:
Here: 8.0% city: 1.6%
- Percentage of males in community and social services occupations:
Here: 4.2% city: 1.1%
- Percentage of males in legal occupations:
Here: 1.4% city: 2.1%
- Percentage of males in education, training, and library occupations:
Here: 42.7% city: 5.0%
- Percentage of males in healthcare practitioners and technical occupations:
Here: 2.2% city: 3.7%
- Percentage of males in service occupations:
Here: 11.0% city: 7.4%
- Percentage of males in sales and office occupations:
Here: 4.3% city: 15.2%
Occupations of females:
- Percentage of females in management occupations (except farmers):
Here: 3.5% city: 11.8%
- Percentage of females in business and financial operations occupations:
Here: 5.3% city: 13.3%
- Percentage of females in computer and mathematical occupations:
Here: 1.3% city: 5.9%
- Percentage of females in life, physical, and social science occupations:
Here: 23.0% city: 2.5%
- Percentage of females in education, training, and library occupations:
Here: 37.9% city: 10.3%
- Percentage of females in arts, design, entertainment, sports, and media occupations:
Here: 2.2% city: 3.5%
- Percentage of females in healthcare practitioners and technical occupations:
Here: 6.2% city: 10.3%
- Percentage of females in service occupations:
Here: 10.6% city: 10.2%
- Percentage of females in sales and office occupations:
Here: 9.9% city: 23.1%
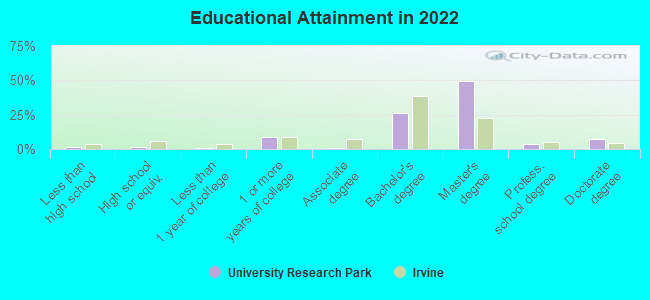
Education in this neighborhood (subdivision or community):
- Percentage of people 3 years and older in K-12 schools:
University Research Park: 7.0% Irvine: 17.2%
- Percentage of people 3 years and older in undergraduate colleges:
University Research Park: 50.6% Irvine: 12.6%
- Percentage of people 3 years and older in grad. or professional schools:
University Research Park: 38.1% Irvine: 3.7%
- Percentage of students K-12 enrolled in private schools:
University Research Park: 21.3% Irvine: 11.1%
Percentage of population below poverty level:
| University Research Park: | 28.9% |
| Irvine: | 11.2% |
Percentage of married-couple families with both working:
| University Research Park: | 122.5% |
| Irvine: | 58.4% |
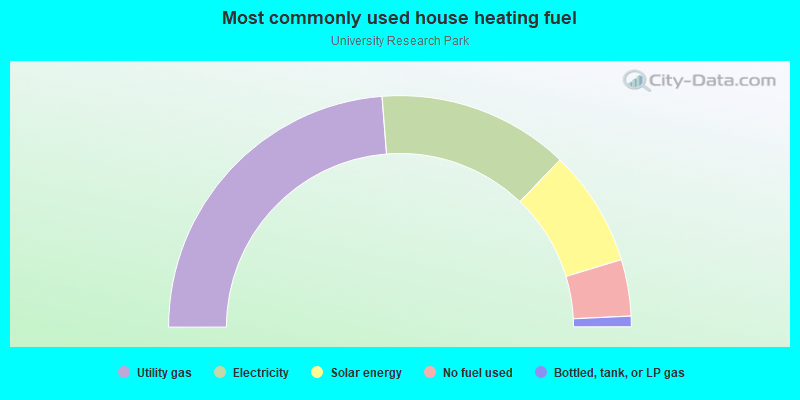
- 47.6%Utility gas
- 26.8%Electricity
- 16.3%Solar energy
- 7.9%No fuel used
- 1.5%Bottled, tank, or LP gas
Roads and streets:
California Ave
Length: 0.20 miles
Directions: N-S, SW-NE
Address range: 3700 to 3793
Directions: N-S, SW-NE
Address range: 3700 to 3793
Innovation
Length: 0.19 miles
Directions: E-W, SE-NW
Address range: 100 to 198
Directions: E-W, SE-NW
Address range: 100 to 198
Theory
Length: 0.08 miles
Direction: SW-NE
Direction: SW-NE