University Park neighborhood in Palo Alto, California (CA), 94301 detailed profile
Settings
X


Business Search - 14 Million verified businesses
Area: 0.224 square miles
Population: 2,711
Population density:
| University Park: | 12,094 people per square mile |
| Palo Alto: | 2,789 people per square mile |

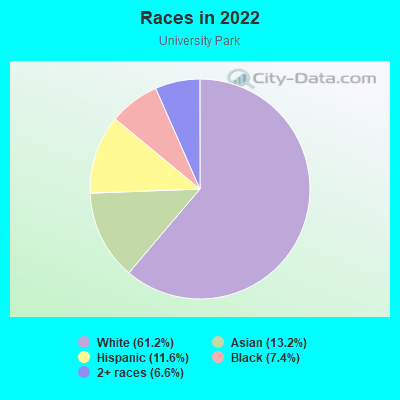
- 1,34441.2%White
- 68421.0%Asian
- 42012.9%Hispanic or Latino
- 2959.1%Some other race
- 2929.0%Two or more races
- 1946.0%Native Hawaiian and Other
Pacific Islander - 300.9%Black
Median household income in 2022:
| University Park: | $250,001 |
| Palo Alto: | $179,707 |
Distribution of median household income
![Distribution of median household income]()
- 4Less than $10,000
- 19$20,000 to $29,999
- 27$30,000 to $39,999
- 50$40,000 to $49,999
- 8$50,000 to $59,999
- 21$60,000 to $74,999
- 7$75,000 to $99,999
- 53$100,000 to $124,999
- 64$125,000 to $149,999
- 132$150,000 to $199,999
- 586$200,000 or more

Distribution of owner-occupied house/condo value
![Distribution of owner-occupied house/condo value]()
- 26$300,000 to $399,999
- 19$500,000 to $749,999
- 4$750,000 to $999,999
- 707$1,000,000 or more

Distribution of rent paid by renters
![Distribution of rent paid by renters]()
- 8$1,000 to $1,249
- 6$1,500 to $1,999
- 315$2,000 or more

Median rent in 2022:
| University Park: | $3,384 |
| Palo Alto: | $2,001 |
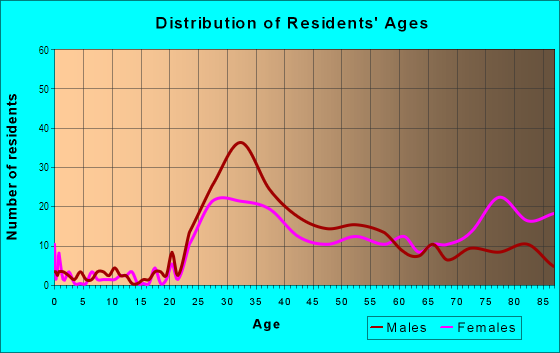
| Males: | 1,403 |
| Females: | 1,308 |
Males:
| This neighborhood: | 42.8 years |
| Whole city: | 47.1 years |
| This neighborhood: | 43.7 years |
| Whole city: | 48.1 years |
Average household size:
| University Park: | 10.9 people |
| Palo Alto: | 2.3 people |
Percentage of family households:
| University Park: | 57.1% |
| Palo Alto: | 42.2% |
| Here: | 64.3% |
| Palo Alto: | 52.1% |
Percentage of married-couple families with children (among all households):
| University Park: | 28.8% |
| Palo Alto: | 37.5% |
Percentage of single-mother households (among all households):
| University Park: | 3.2% |
| Palo Alto: | 3.5% |
Percentage of never married males 15 years old and over:
Percentage of never married females 15 years old and over:
| University Park: | 15.0% |
| Palo Alto: | 17.4% |
Percentage of never married females 15 years old and over:
| University Park: | 15.9% |
| city: | 11.8% |
Percentage of people that speak English not well or not at all:
| University Park: | 0.0% |
| Palo Alto: | 3.7% |
Percentage of people born in this state:
Percentage of people born in another U.S. state:
Percentage of native residents but born outside the U.S.:
Percentage of foreign born residents:
| Here: | 44.6% |
| Palo Alto: | 36.4% |
Percentage of people born in another U.S. state:
| University Park: | 30.0% |
| Palo Alto: | 28.3% |
Percentage of native residents but born outside the U.S.:
| Here: | 3.4% |
| city: | 3.7% |
Percentage of foreign born residents:
| Here: | 22.0% |
| Palo Alto: | 31.6% |
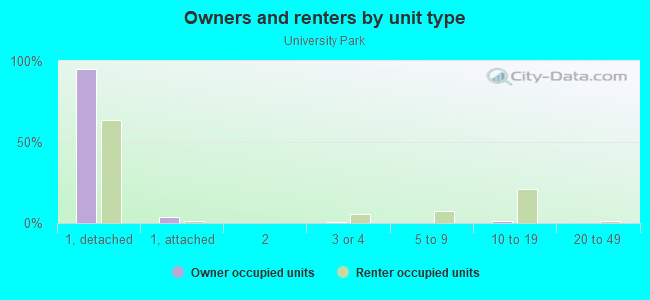
Owner-occupied
Renter-occupied

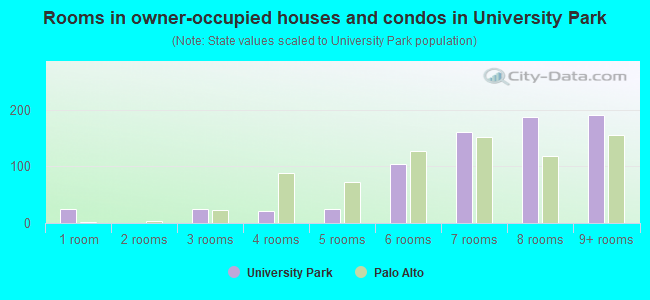
- Rooms in owner-occupied houses and condos in University Park
- 251 room
- 02 rooms
- 253 rooms
- 214 rooms
- 255 rooms
- 1046 rooms
- 1617 rooms
- 1888 rooms
- 1919+ rooms
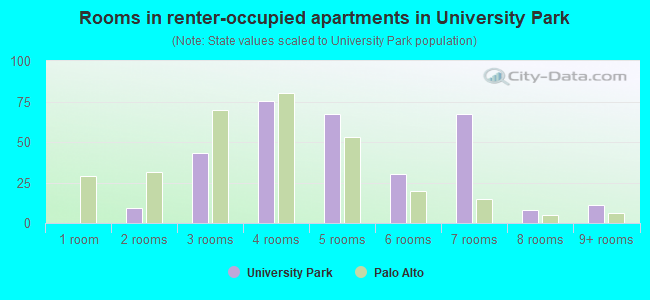
- Rooms in renter-occupied apartments in University Park
- 01 room
- 92 rooms
- 433 rooms
- 754 rooms
- 675 rooms
- 306 rooms
- 677 rooms
- 88 rooms
- 119+ rooms
Owner-occupied
Renter-occupied
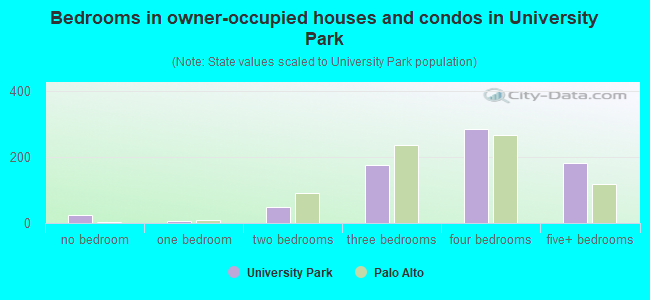
- Bedrooms in owner-occupied houses and condos in University Park
- 25no bedroom
- 61 bedroom
- 492 bedrooms
- 1763 bedrooms
- 2844 bedrooms
- 1825+ bedrooms
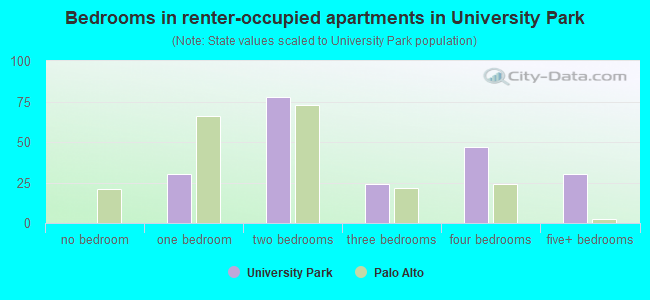
- Bedrooms in renter-occupied apartments in University Park
- 0no bedroom
- 301 bedroom
- 782 bedrooms
- 243 bedrooms
- 474 bedrooms
- 305+ bedrooms
Average number of cars or other vehicles available in houses/condos:
Average number of cars or other vehicles available in apartments:
| This neighborhood: | 2.2 |
| Palo Alto: | 2.1 |
Average number of cars or other vehicles available in apartments:
| Here: | 1.4 |
| city: | 1.1 |
Percentage of units with a mortgage:
| University Park: | 55.1% |
| Palo Alto: | 58.3% |
Average estimated value of detached houses in 2022 (95.7% of all units):
| University Park: | $3,908,532 |
| California: | $988,808 |
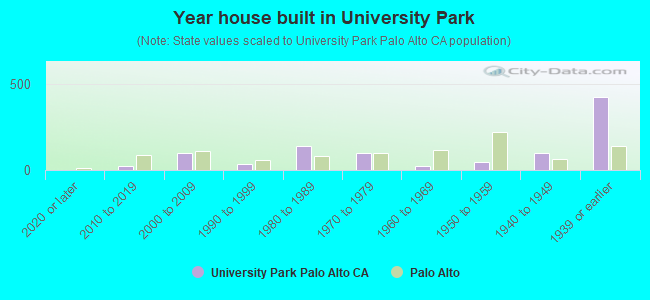
- Year house built in University Park
- 02020 or later
- 232010 to 2019
- 992000 to 2009
- 321990 to 1999
- 1401980 to 1989
- 971970 to 1979
- 211960 to 1969
- 461950 to 1959
- 971940 to 1949
- 4221939 or earlier
City-data.com crime index for city in 2020 (higher means more crime):
| City: | 180.8 |
| U.S. average: | 219.5 |
Travel time to work (commute)
![Travel time to work (commute)]()
- 9Less than 5 minutes
- 95 to 9 minutes
- 9310 to 14 minutes
- 11015 to 19 minutes
- 9120 to 24 minutes
- 3525 to 29 minutes
- 2930 to 34 minutes
- 535 to 39 minutes
- 2845 to 59 minutes
- 1360 to 89 minutes
- 1890 or more minutes

Means of transportation to work
![Means of transportation to work]()
- 45.4%563Drove a car alone
- 2.7%34Carpooled
- 0.8%10Subway or elevated rail
- 2.5%31Long-distance train or commuter rail
- 2.7%33Motorcycle
- 8.5%105Bicycle
- 2.0%25Walked
- 38.5%478Worked at home

Time leaving home to go to work
![Time leaving home to go to work]()
- 512:00 a.m. to 4:59 a.m.
- 35:30 a.m. to 5:59 a.m.
- 146:00 a.m. to 6:29 a.m.
- 66:30 a.m. to 6:59 a.m.
- 267:00 a.m. to 7:29 a.m.
- 537:30 a.m. to 7:59 a.m.
- 1148:00 a.m. to 8:29 a.m.
- 608:30 a.m. to 8:59 a.m.
- 739:00 a.m. to 9:59 a.m.
- 3910:00 a.m. to 10:59 a.m.
- 911:00 a.m. to 11:59 a.m.
- 912:00 p.m. to 3:59 p.m.
- 124:00 p.m. to 11:59 p.m.

Occupations of males:
- Percentage of males in management occupations (except farmers):
Here: 19.8% city: 19.1%
- Percentage of males in business and financial operations occupations:
Here: 4.0% city: 7.0%
- Percentage of males in computer and mathematical occupations:
Here: 21.6% city: 22.2%
- Percentage of males in architecture and engineering occupations:
Here: 8.7% city: 10.1%
- Percentage of males in life, physical, and social science occupations:
Here: 1.4% city: 6.4%
- Percentage of males in community and social services occupations:
Here: 1.6% city: 0.8%
- Percentage of males in legal occupations:
Here: 5.7% city: 2.5%
- Percentage of males in education, training, and library occupations:
Here: 6.1% city: 7.2%
- Percentage of males in arts, design, entertainment, sports, and media occupations:
Here: 4.3% city: 3.2%
- Percentage of males in healthcare practitioners and technical occupations:
Here: 1.1% city: 4.6%
- Percentage of males in service occupations:
Here: 6.2% city: 4.5%
- Percentage of males in sales and office occupations:
Here: 11.2% city: 5.7%
- Percentage of males in construction, extraction, and maintenance occupations:
Here: 2.9% city: 1.7%
- Percentage of males in production occupations:
Here: 5.4% city: 1.4%
Occupations of females:
- Percentage of females in management occupations (except farmers):
Here: 14.9% city: 19.0%
- Percentage of females in business and financial operations occupations:
Here: 11.5% city: 8.3%
- Percentage of females in computer and mathematical occupations:
Here: 12.4% city: 8.6%
- Percentage of females in architecture and engineering occupations:
Here: 1.9% city: 4.0%
- Percentage of females in life, physical, and social science occupations:
Here: 3.3% city: 6.8%
- Percentage of females in community and social services occupations:
Here: 2.7% city: 1.3%
- Percentage of females in legal occupations:
Here: 4.5% city: 4.8%
- Percentage of females in education, training, and library occupations:
Here: 18.5% city: 12.9%
- Percentage of females in arts, design, entertainment, sports, and media occupations:
Here: 4.8% city: 4.3%
- Percentage of females in healthcare practitioners and technical occupations:
Here: 7.5% city: 8.7%
- Percentage of females in service occupations:
Here: 3.3% city: 8.4%
- Percentage of females in sales and office occupations:
Here: 9.9% city: 11.7%
- Percentage of females in production occupations:
Here: 2.4% city: 0.8%
- Percentage of females in transportation occupations:
Here: 2.5% city: 0.4%
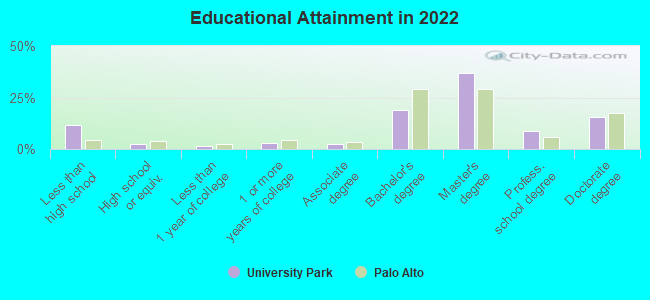
Education in this neighborhood (subdivision or community):
- Percentage of people 3 years and older in K-12 schools:
University Park: 33.3% Palo Alto: 14.2%
- Percentage of people 3 years and older in undergraduate colleges:
University Park: 9.6% Palo Alto: 2.4%
- Percentage of people 3 years and older in grad. or professional schools:
University Park: 2.2% Palo Alto: 2.8%
- Percentage of students K-12 enrolled in private schools:
University Park: 12.5% Palo Alto: 22.1%
Percentage of population below poverty level:
| University Park: | 1.0% |
| Palo Alto: | 4.5% |
Median year owner moved in (as recorded in 2022):
| University Park: | 2003 |
| Palo Alto: | 2001 |
Percentage of married-couple families with both working:
| University Park: | 61.8% |
| Palo Alto: | 68.5% |
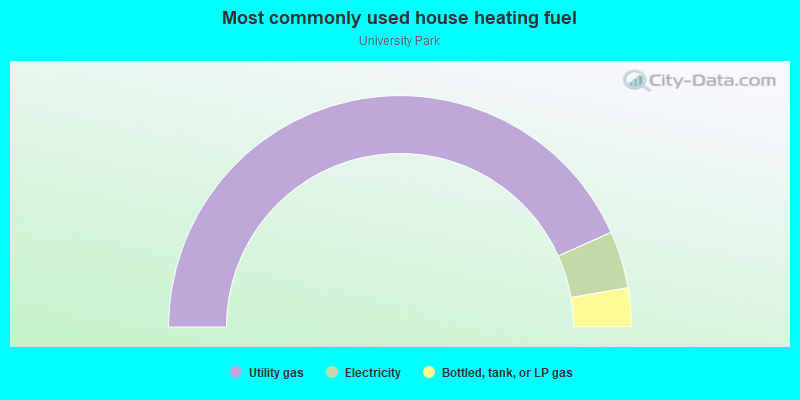
- 86.6%Utility gas
- 8.0%Electricity
- 5.4%Bottled, tank, or LP gas
Roads and streets:
University Ave
Length: 0.70 miles
Direction: SW-NE
Address range: 100 to 699
Direction: SW-NE
Address range: 100 to 699
Homer Ave
Length: 0.67 miles
Direction: SW-NE
Address range: 127 to 699
Direction: SW-NE
Address range: 127 to 699
Forest Ave
Length: 0.67 miles
Direction: SW-NE
Address range: 125 to 699
Direction: SW-NE
Address range: 125 to 699
Hamilton Ave
Length: 0.64 miles
Direction: SW-NE
Address range: 148 to 699
Direction: SW-NE
Address range: 148 to 699
Waverley St
Length: 0.35 miles
Direction: SE-NW
Address range: 448 to 799
Direction: SE-NW
Address range: 448 to 799
Bryant St
Length: 0.34 miles
Direction: SE-NW
Address range: 473 to 799
Direction: SE-NW
Address range: 473 to 799
Ramona St
Length: 0.34 miles
Direction: SE-NW
Address range: 482 to 799
Direction: SE-NW
Address range: 482 to 799
Middlefield Rd
Length: 0.31 miles
Direction: SE-NW
Address range: 500 to 799
Direction: SE-NW
Address range: 500 to 799
Cowper St
Length: 0.31 miles
Direction: SE-NW
Address range: 500 to 799
Direction: SE-NW
Address range: 500 to 799
Emerson St
Length: 0.31 miles
Direction: SE-NW
Address range: 500 to 799
Direction: SE-NW
Address range: 500 to 799
High St
Length: 0.30 miles
Direction: SE-NW
Address range: 500 to 799
Direction: SE-NW
Address range: 500 to 799
Webster St
Length: 0.30 miles
Direction: SE-NW
Address range: 500 to 799
Direction: SE-NW
Address range: 500 to 799
Ln 7 E
Length: 0.10 miles
Direction: SE-NW
Address range: 700 to 799
Direction: SE-NW
Address range: 700 to 799
Byron St
Length: 0.10 miles
Direction: SE-NW
Address range: 500 to 599
Direction: SE-NW
Address range: 500 to 599
Ln 7 W
Length: 0.10 miles
Direction: SE-NW
Address range: 700 to 799
Direction: SE-NW
Address range: 700 to 799
Ln 39
Length: 0.10 miles
Direction: SE-NW
Address range: 600 to 699
Direction: SE-NW
Address range: 600 to 699
Gilman St
Length: 0.10 miles
Direction: SE-NW
Address range: 600 to 699
Direction: SE-NW
Address range: 600 to 699
Downing Ln
Length: 0.08 miles
Direction: SE-NW
Address range: 700 to 799
Direction: SE-NW
Address range: 700 to 799
Ln 30 E
Length: 0.06 miles
Direction: SW-NE
Address range: 400 to 499
Direction: SW-NE
Address range: 400 to 499
Ln 20
Length: 0.06 miles
Direction: SW-NE
Address range: 300 to 399
Direction: SW-NE
Address range: 300 to 399
Ln 13 E
Length: 0.06 miles
Direction: SW-NE
Address range: 200 to 299
Direction: SW-NE
Address range: 200 to 299
Florence St
Length: 0.05 miles
Direction: SE-NW
Address range: 443 to 499
Direction: SE-NW
Address range: 443 to 499
Kipling St
Length: 0.04 miles
Direction: SE-NW
Address range: 433 to 499
Direction: SE-NW
Address range: 433 to 499