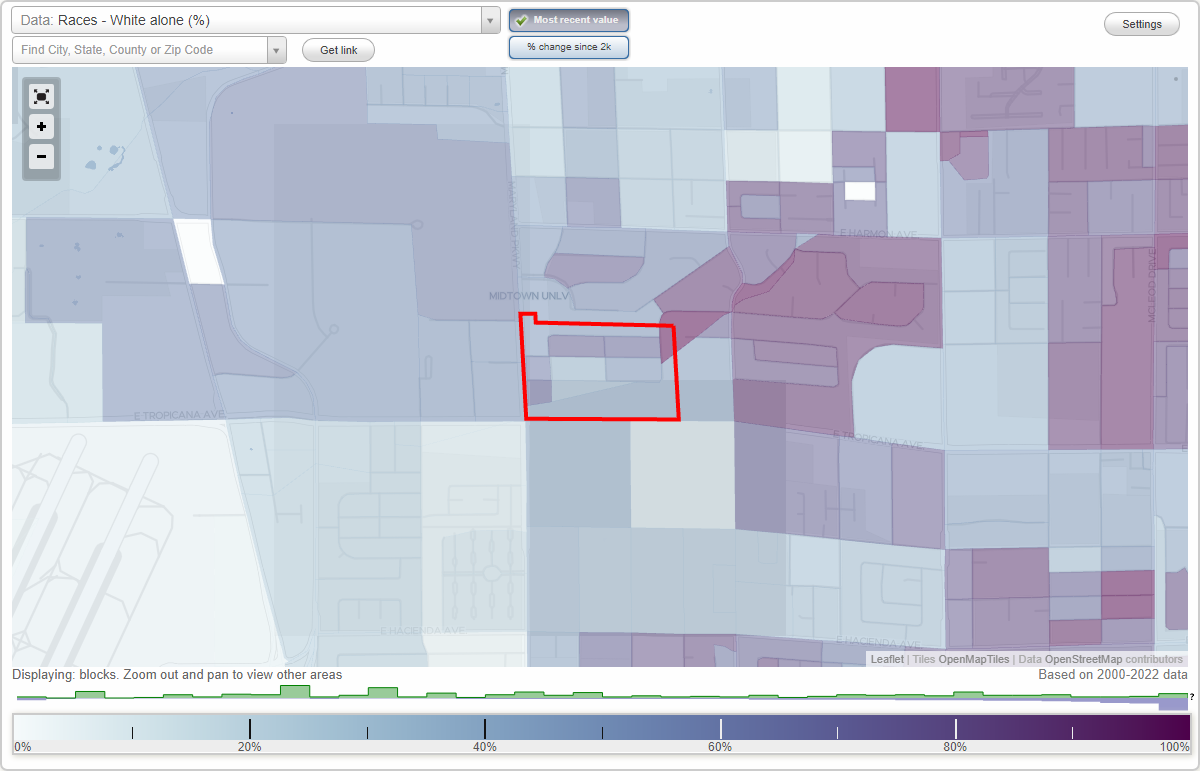
University Crest neighborhood in Las Vegas, Nevada (NV), 89119 detailed profile
Settings
X

Business Search - 14 Million verified businesses
Area: 0.084 square miles
Population: 868
Population density:
| University Crest: | 10,319 people per square mile |
| Las Vegas: | 5,792 people per square mile |

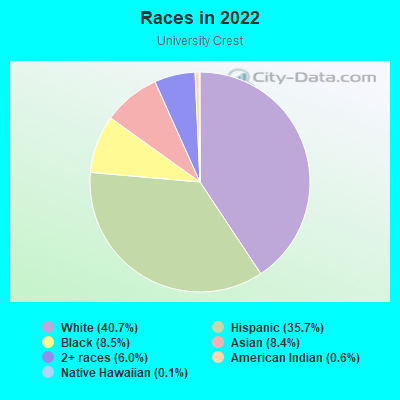
- 35340.7%White
- 31035.7%Hispanic or Latino
- 748.5%Black
- 738.4%Asian
- 526.0%Two or more races
- 50.6%American Indian
- 10.1%Native Hawaiian and Other
Pacific Islander
Median household income in 2022:
| University Crest: | $43,959 |
| Las Vegas: | $68,905 |
Distribution of median household income
![Distribution of median household income]()
- 46Less than $10,000
- 69$10,000 to $19,999
- 52$20,000 to $29,999
- 58$30,000 to $39,999
- 37$40,000 to $49,999
- 37$50,000 to $59,999
- 34$60,000 to $74,999
- 48$75,000 to $99,999
- 33$100,000 to $124,999
- 12$125,000 to $149,999
- 8$150,000 to $199,999
- 14$200,000 or more

Distribution of owner-occupied house/condo value
![Distribution of owner-occupied house/condo value]()
- 21Less than $50,000
- 3$50,000 to $99,999
- 28$100,000 to $149,999
- 16$150,000 to $199,999
- 14$200,000 to $249,999
- 7$250,000 to $299,999
- 33$300,000 to $399,999
- 18$400,000 to $499,999
- 4$500,000 to $749,999

Distribution of rent paid by renters
![Distribution of rent paid by renters]()
- 18$400 to $499
- 13$600 to $699
- 32$700 to $799
- 76$800 to $899
- 81$900 to $999
- 99$1,000 to $1,249
- 32$1,250 to $1,499
- 19$1,500 to $1,999
- 2$2,000 or more

Median rent in 2022:
| University Crest: | $965 |
| Las Vegas: | $1,277 |
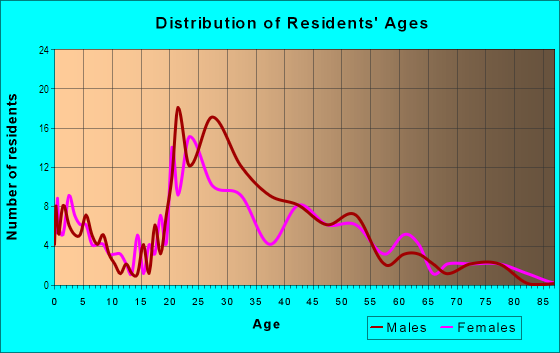
| Males: | 457 |
| Females: | 411 |
Males:
| This neighborhood: | 32.4 years |
| Whole city: | 38.4 years |
| This neighborhood: | 31.8 years |
| Whole city: | 38.9 years |
Average household size:
| University Crest: | 14.4 people |
| Las Vegas: | 2.7 people |
Percentage of family households:
| University Crest: | 38.2% |
| Las Vegas: | 45.8% |
| Here: | 18.9% |
| Las Vegas: | 40.9% |
Percentage of married-couple families with children (among all households):
| University Crest: | 8.4% |
| Las Vegas: | 23.4% |
Percentage of single-mother households (among all households):
| University Crest: | 22.4% |
| Las Vegas: | 10.1% |
Percentage of never married males 15 years old and over:
Percentage of never married females 15 years old and over:
| University Crest: | 31.8% |
| Las Vegas: | 19.7% |
Percentage of never married females 15 years old and over:
| University Crest: | 22.6% |
| city: | 17.0% |
Percentage of people that speak English not well or not at all:
| University Crest: | 11.6% |
| Las Vegas: | 7.0% |
Percentage of people born in this state:
Percentage of people born in another U.S. state:
Percentage of native residents but born outside the U.S.:
Percentage of foreign born residents:
| Here: | 23.0% |
| Las Vegas: | 27.3% |
Percentage of people born in another U.S. state:
| University Crest: | 49.1% |
| Las Vegas: | 49.8% |
Percentage of native residents but born outside the U.S.:
| Here: | 0.9% |
| city: | 1.9% |
Percentage of foreign born residents:
| Here: | 27.1% |
| Las Vegas: | 21.0% |
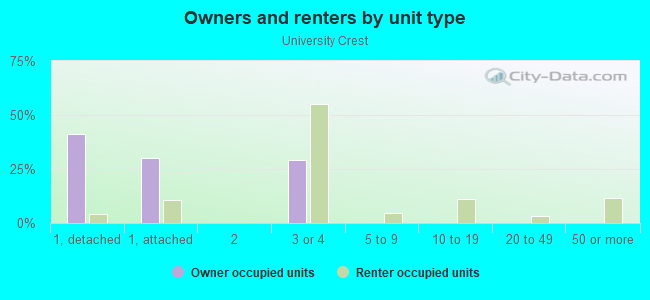
Owner-occupied
Renter-occupied

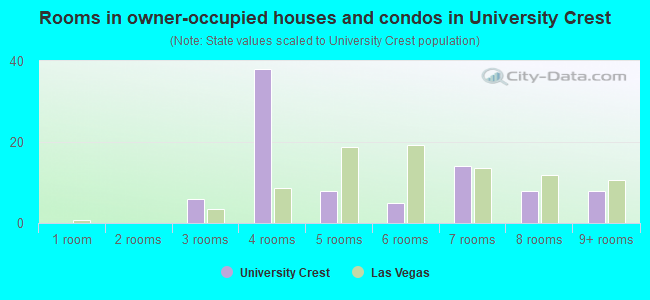
- Rooms in owner-occupied houses and condos in University Crest
- 01 room
- 02 rooms
- 63 rooms
- 384 rooms
- 85 rooms
- 56 rooms
- 147 rooms
- 88 rooms
- 89+ rooms
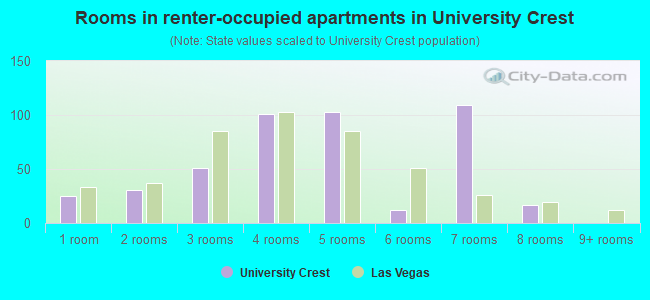
- Rooms in renter-occupied apartments in University Crest
- 251 room
- 312 rooms
- 513 rooms
- 1014 rooms
- 1035 rooms
- 126 rooms
- 1097 rooms
- 178 rooms
- 09+ rooms
Owner-occupied
Renter-occupied
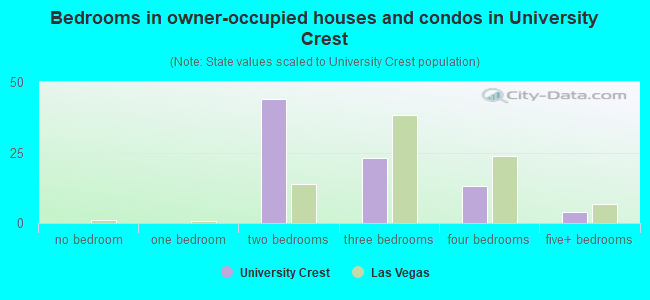
- Bedrooms in owner-occupied houses and condos in University Crest
- 0no bedroom
- 01 bedroom
- 442 bedrooms
- 233 bedrooms
- 134 bedrooms
- 45+ bedrooms
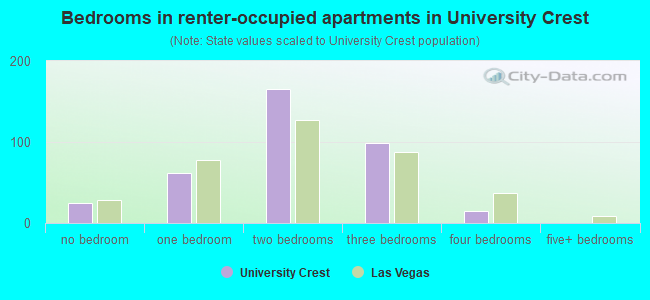
- Bedrooms in renter-occupied apartments in University Crest
- 25no bedroom
- 621 bedroom
- 1662 bedrooms
- 993 bedrooms
- 154 bedrooms
- 05+ bedrooms
Average number of cars or other vehicles available in houses/condos:
Average number of cars or other vehicles available in apartments:
| This neighborhood: | 1.6 |
| Las Vegas: | 2.0 |
Average number of cars or other vehicles available in apartments:
| Here: | 1.3 |
| city: | 1.3 |
Percentage of units with a mortgage:
| University Crest: | 57.1% |
| Las Vegas: | 69.3% |
Housing prices:
- Average estimated value of detached houses in 2022 (10.9% of all units):
University Crest: $287,100 Nevada: $549,327
- Average estimated value of townhouses or other attached units in 2022 (11.3% of all units):
This neighborhood: $114,463 Nevada: $328,893
- Average estimated '22 value of housing units in 3-to-4-unit structures (51.9% of all units):
University Crest: $102,956 Nevada: $295,216
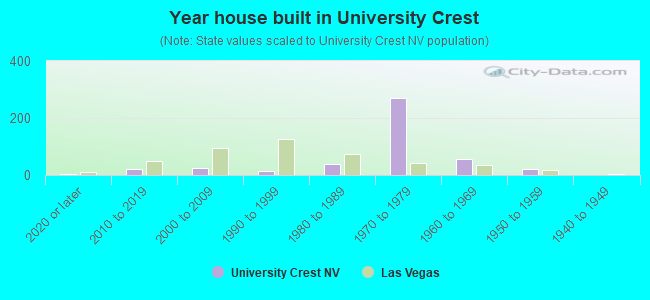
- Year house built in University Crest
- 52020 or later
- 212010 to 2019
- 252000 to 2009
- 141990 to 1999
- 371980 to 1989
- 2711970 to 1979
- 571960 to 1969
- 221950 to 1959
- 01940 to 1949
- 01939 or earlier
City-data.com crime index for city in 2020 (higher means more crime):
| City: | 280.7 |
| U.S. average: | 219.5 |
Travel time to work (commute)
![Travel time to work (commute)]()
- 8Less than 5 minutes
- 425 to 9 minutes
- 7610 to 14 minutes
- 5815 to 19 minutes
- 7420 to 24 minutes
- 3325 to 29 minutes
- 9330 to 34 minutes
- 235 to 39 minutes
- 2460 to 89 minutes
- 3690 or more minutes

Means of transportation to work
![Means of transportation to work]()
- 51.4%232Drove a car alone
- 23.9%108Carpooled
- 7.1%32Bus
- 1.3%6Taxi
- 9.7%44Walked
- 3.5%16Other means
- 5.1%23Worked at home

Time leaving home to go to work
![Time leaving home to go to work]()
- 1312:00 a.m. to 4:59 a.m.
- 235:00 a.m. to 5:29 a.m.
- 235:30 a.m. to 5:59 a.m.
- 166:00 a.m. to 6:29 a.m.
- 126:30 a.m. to 6:59 a.m.
- 317:00 a.m. to 7:29 a.m.
- 567:30 a.m. to 7:59 a.m.
- 348:00 a.m. to 8:29 a.m.
- 158:30 a.m. to 8:59 a.m.
- 189:00 a.m. to 9:59 a.m.
- 1910:00 a.m. to 10:59 a.m.
- 1411:00 a.m. to 11:59 a.m.
- 11312:00 p.m. to 3:59 p.m.
- 584:00 p.m. to 11:59 p.m.

Occupations of males:
- Percentage of males in management occupations (except farmers):
Here: 3.1% city: 9.6%
- Percentage of males in business and financial operations occupations:
Here: 7.1% city: 3.6%
- Percentage of males in computer and mathematical occupations:
Here: 13.5% city: 3.4%
- Percentage of males in education, training, and library occupations:
Here: 14.7% city: 2.5%
- Percentage of males in arts, design, entertainment, sports, and media occupations:
Here: 4.6% city: 2.5%
- Percentage of males in service occupations:
Here: 20.4% city: 23.3%
- Percentage of males in sales and office occupations:
Here: 16.2% city: 16.6%
- Percentage of males in construction, extraction, and maintenance occupations:
Here: 5.0% city: 10.6%
- Percentage of males in production occupations:
Here: 7.8% city: 3.3%
- Percentage of males in transportation occupations:
Here: 4.9% city: 6.6%
- Percentage of males in material moving occupations:
Here: 2.8% city: 5.4%
Occupations of females:
- Percentage of females in management occupations (except farmers):
Here: 7.4% city: 8.5%
- Percentage of females in business and financial operations occupations:
Here: 10.3% city: 5.7%
- Percentage of females in life, physical, and social science occupations:
Here: 1.4% city: 0.4%
- Percentage of females in education, training, and library occupations:
Here: 17.1% city: 8.0%
- Percentage of females in healthcare practitioners and technical occupations:
Here: 1.9% city: 7.4%
- Percentage of females in service occupations:
Here: 37.0% city: 26.5%
- Percentage of females in sales and office occupations:
Here: 24.4% city: 30.5%
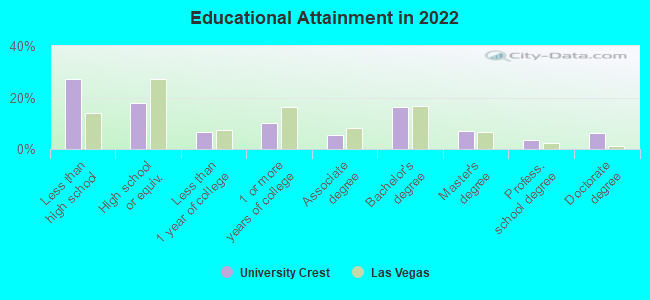
Education in this neighborhood (subdivision or community):
- Percentage of people 3 years and older in K-12 schools:
University Crest: 16.0% Las Vegas: 17.4%
- Percentage of people 3 years and older in undergraduate colleges:
University Crest: 11.5% Las Vegas: 4.2%
- Percentage of people 3 years and older in grad. or professional schools:
University Crest: 5.8% Las Vegas: 1.0%
- Percentage of students K-12 enrolled in private schools:
University Crest: 18.4% Las Vegas: 12.9%
Percentage of population below poverty level:
| University Crest: | 24.7% |
| Las Vegas: | 14.1% |
Median year owner moved in (as recorded in 2022):
Median year renter moved in (as recorded in 2022):
| University Crest: | 2012 |
| Las Vegas: | 2015 |
Median year renter moved in (as recorded in 2022):
| University Crest: | 2018 |
| Las Vegas: | 2020 |
Percentage of married-couple families with both working:
| University Crest: | 140.0% |
| Las Vegas: | 62.0% |
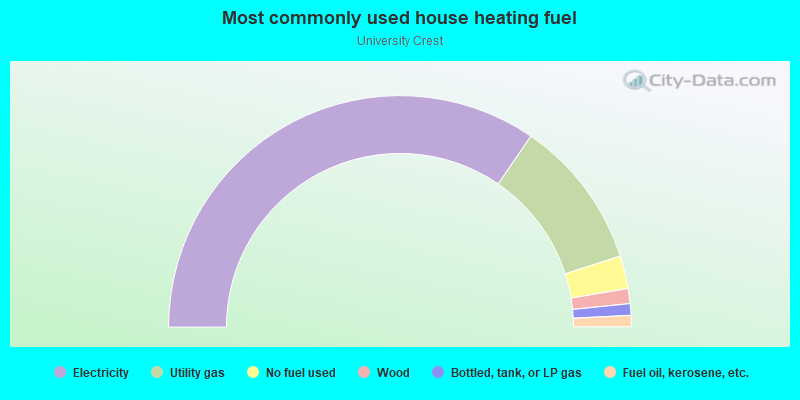
- 69.1%Electricity
- 20.9%Utility gas
- 4.6%No fuel used
- 2.1%Wood
- 1.6%Bottled, tank, or LP gas
- 1.6%Fuel oil, kerosene, etc.
Roads and streets:
Dorothy Ave
Length: 0.33 miles
Direction: E-W
Address range: 1300 to 1599
Direction: E-W
Address range: 1300 to 1599
Lorilyn Ave
Length: 0.33 miles
Directions: E-W, SW-NE
Address range: 1300 to 1599
Directions: E-W, SW-NE
Address range: 1300 to 1599
Elizabeth Ave
Length: 0.33 miles
Directions: E-W, SW-NE
Address range: 1300 to 1599
Directions: E-W, SW-NE
Address range: 1300 to 1599
Deirdre St
Length: 0.13 miles
Direction: N-S
Address range: 4700 to 4899
Direction: N-S
Address range: 4700 to 4899
Heidi St
Length: 0.11 miles
Direction: N-S
Address range: 4700 to 4899
Direction: N-S
Address range: 4700 to 4899
Roberta St
Length: 0.10 miles
Direction: N-S
Address range: 4724 to 4899
Direction: N-S
Address range: 4724 to 4899