Tremont neighborhood in Baltimore, Maryland (MD), 21229 detailed profile
Settings
X


Business Search - 14 Million verified businesses
Area: 0.035 square miles
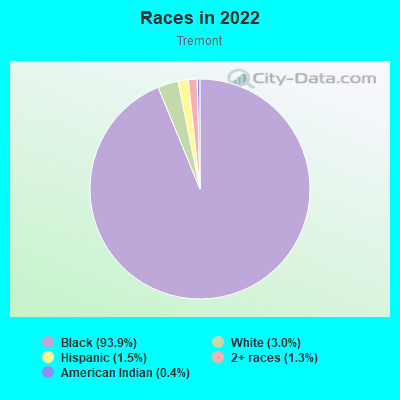
Population: 522
Population density:
| Tremont: | 14,973 people per square mile |
| Baltimore: | 7,053 people per square mile |

- 50693.9%Black
- 163.0%White
- 81.5%Hispanic or Latino
- 71.3%Two or more races
- 20.4%American Indian
Distribution of median household income
![Distribution of median household income]()
- 46Less than $10,000
- 40$10,000 to $19,999
- 9$20,000 to $29,999
- 26$30,000 to $39,999
- 51$40,000 to $49,999
- 19$50,000 to $59,999
- 12$60,000 to $74,999
- 58$75,000 to $99,999
- 3$100,000 to $124,999
- 5$125,000 to $149,999
- 22$150,000 to $199,999
- 24$200,000 or more

Distribution of owner-occupied house/condo value
![Distribution of owner-occupied house/condo value]()
- 2Less than $50,000
- 10$50,000 to $99,999
- 85$100,000 to $149,999
- 48$150,000 to $199,999
- 46$200,000 to $249,999
- 4$250,000 to $299,999
- 25$300,000 to $399,999
- 2$400,000 to $499,999
- 24$500,000 to $749,999
- 3$750,000 to $999,999

Distribution of rent paid by renters
![Distribution of rent paid by renters]()
- 59$100 to $199
- 8$200 to $299
- 3$500 to $599
- 11$600 to $699
- 8$700 to $799
- 16$800 to $899
- 5$900 to $999
- 17$1,000 to $1,249
- 3$1,250 to $1,499
- 3$1,500 to $1,999

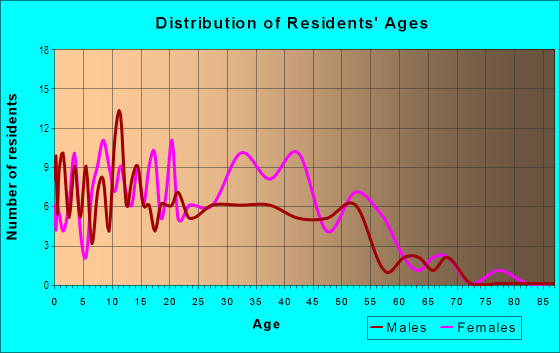
| Males: | 278 |
| Females: | 243 |
Males:
| This neighborhood: | 26.8 years |
| Whole city: | 35.0 years |
| This neighborhood: | 50.5 years |
| Whole city: | 38.2 years |
Average household size:
| Tremont: | 2.0 people |
| Baltimore: | 2.2 people |
Percentage of family households:
| Tremont: | 31.5% |
| Baltimore: | 34.2% |
| Here: | 30.4% |
| Baltimore: | 23.3% |
Percentage of married-couple families with children (among all households):
| Tremont: | 40.0% |
| Baltimore: | 22.4% |
Percentage of single-mother households (among all households):
| Tremont: | 46.8% |
| Baltimore: | 18.7% |
Percentage of never married males 15 years old and over:
Percentage of never married females 15 years old and over:
| Tremont: | 11.8% |
| Baltimore: | 25.1% |
Percentage of never married females 15 years old and over:
| Tremont: | 21.8% |
| city: | 27.5% |
Percentage of people that speak English not well or not at all:
| Tremont: | 1.1% |
| Baltimore: | 2.3% |
Percentage of people born in this state:
Percentage of people born in another U.S. state:
Percentage of native residents but born outside the U.S.:
Percentage of foreign born residents:
| Here: | 68.7% |
| Baltimore: | 64.4% |
Percentage of people born in another U.S. state:
| Tremont: | 25.9% |
| Baltimore: | 25.0% |
Percentage of native residents but born outside the U.S.:
| Here: | 2.2% |
| city: | 0.9% |
Percentage of foreign born residents:
| Here: | 3.3% |
| Baltimore: | 9.7% |
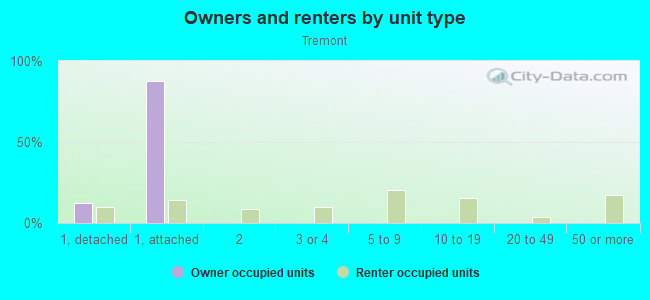
Owner-occupied
Renter-occupied

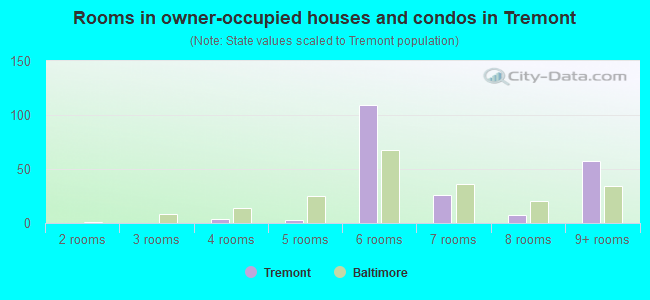
- Rooms in owner-occupied houses and condos in Tremont
- 01 room
- 02 rooms
- 03 rooms
- 44 rooms
- 35 rooms
- 1096 rooms
- 267 rooms
- 78 rooms
- 579+ rooms
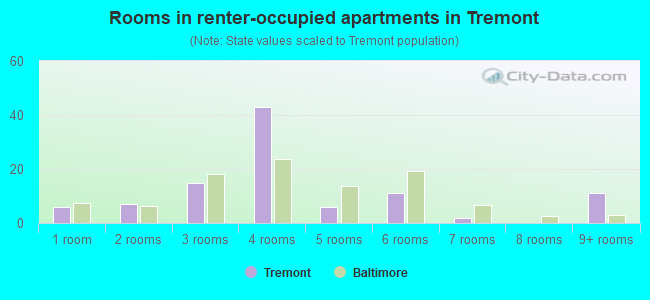
- Rooms in renter-occupied apartments in Tremont
- 61 room
- 72 rooms
- 153 rooms
- 434 rooms
- 65 rooms
- 116 rooms
- 27 rooms
- 08 rooms
- 119+ rooms
Owner-occupied
Renter-occupied
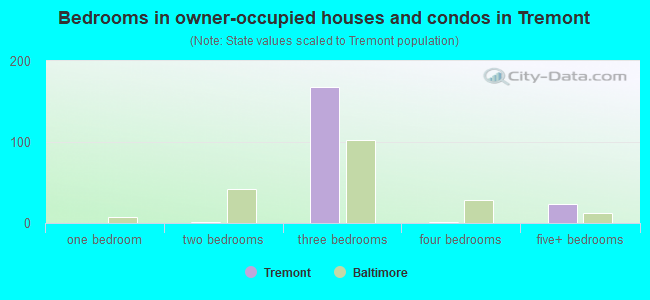
- Bedrooms in owner-occupied houses and condos in Tremont
- 0no bedroom
- 01 bedroom
- 12 bedrooms
- 1683 bedrooms
- 14 bedrooms
- 235+ bedrooms
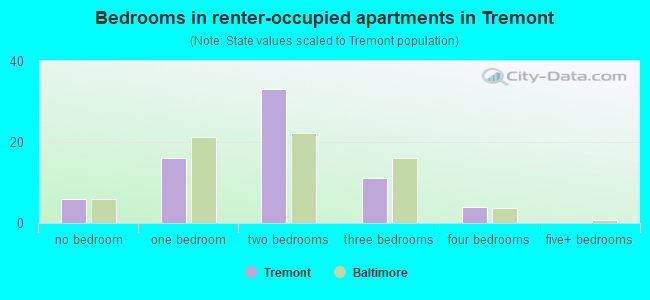
- Bedrooms in renter-occupied apartments in Tremont
- 6no bedroom
- 161 bedroom
- 332 bedrooms
- 113 bedrooms
- 44 bedrooms
- 05+ bedrooms
Average number of cars or other vehicles available in houses/condos:
Average number of cars or other vehicles available in apartments:
| This neighborhood: | 0.2 |
| Baltimore: | 1.5 |
Average number of cars or other vehicles available in apartments:
| Here: | 3.2 |
| city: | 0.8 |
Percentage of units with a mortgage:
| Tremont: | 64.0% |
| Baltimore: | 64.3% |
Average estimated value of townhouses or other attached units in 2022 (70.3% of all units):
| This neighborhood: | $175,102 |
| city: | $206,258 |
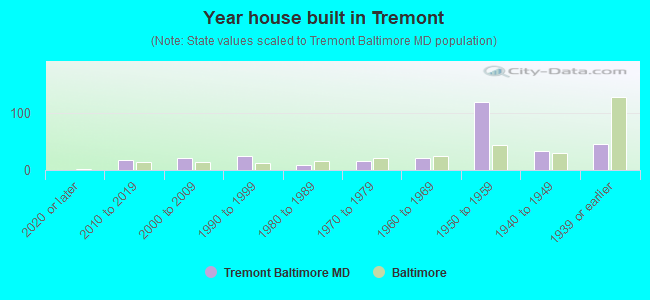
- Year house built in Tremont
- 02020 or later
- 182010 to 2019
- 222000 to 2009
- 241990 to 1999
- 81980 to 1989
- 151970 to 1979
- 211960 to 1969
- 1191950 to 1959
- 341940 to 1949
- 451939 or earlier
Travel time to work (commute)
![Travel time to work (commute)]()
- 125 to 9 minutes
- 1110 to 14 minutes
- 2915 to 19 minutes
- 7720 to 24 minutes
- 1025 to 29 minutes
- 9030 to 34 minutes
- 4035 to 39 minutes
- 1240 to 44 minutes
- 2245 to 59 minutes
- 1460 to 89 minutes
- 490 or more minutes

Means of transportation to work
![Means of transportation to work]()
- 82.9%276Drove a car alone
- 0.9%3Carpooled
- 7.2%24Bus
- 0.6%2Subway or elevated rail
- 0.9%3Long-distance train or commuter rail
- 0.6%2Bicycle
- 6.0%20Other means
- 9.6%32Worked at home

Time leaving home to go to work
![Time leaving home to go to work]()
- 15:00 a.m. to 5:29 a.m.
- 205:30 a.m. to 5:59 a.m.
- 636:00 a.m. to 6:29 a.m.
- 466:30 a.m. to 6:59 a.m.
- 417:00 a.m. to 7:29 a.m.
- 327:30 a.m. to 7:59 a.m.
- 88:00 a.m. to 8:29 a.m.
- 68:30 a.m. to 8:59 a.m.
- 129:00 a.m. to 9:59 a.m.
- 510:00 a.m. to 10:59 a.m.
- 2111:00 a.m. to 11:59 a.m.
- 1612:00 p.m. to 3:59 p.m.
- 544:00 p.m. to 11:59 p.m.

Occupations of males:
- Percentage of males in management occupations (except farmers):
Here: 34.2% city: 10.7%
- Percentage of males in life, physical, and social science occupations:
Here: 1.6% city: 2.3%
- Percentage of males in community and social services occupations:
Here: 20.0% city: 1.6%
- Percentage of males in legal occupations:
Here: 6.6% city: 1.8%
- Percentage of males in education, training, and library occupations:
Here: 8.0% city: 5.4%
- Percentage of males in healthcare practitioners and technical occupations:
Here: 41.7% city: 4.0%
- Percentage of males in sales and office occupations:
Here: 17.2% city: 14.2%
- Percentage of males in production occupations:
Here: 12.3% city: 4.2%
- Percentage of males in transportation occupations:
Here: 20.0% city: 6.8%
Occupations of females:
- Percentage of females in business and financial operations occupations:
Here: 17.8% city: 6.6%
- Percentage of females in computer and mathematical occupations:
Here: 3.0% city: 2.4%
- Percentage of females in legal occupations:
Here: 10.5% city: 1.8%
- Percentage of females in education, training, and library occupations:
Here: 23.9% city: 10.7%
- Percentage of females in sales and office occupations:
Here: 28.9% city: 22.3%
- Percentage of females in production occupations:
Here: 3.5% city: 2.3%
- Percentage of females in transportation occupations:
Here: 18.7% city: 1.7%
Percentage of people 16-64 in Armed Forces:
| Tremont: | 0.0% |
| Baltimore: | 0.4% |
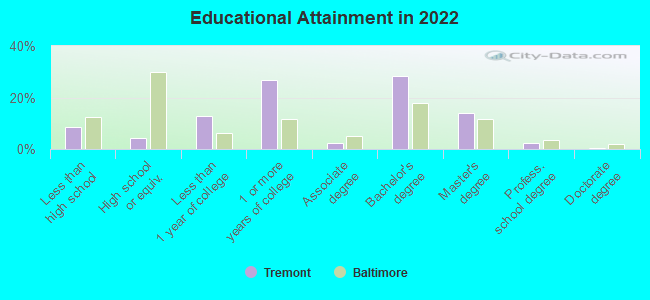
Education in this neighborhood (subdivision or community):
- Percentage of people 3 years and older in K-12 schools:
Tremont: 23.1% Baltimore: 14.7%
- Percentage of people 3 years and older in undergraduate colleges:
Tremont: 5.4% Baltimore: 6.0%
- Percentage of people 3 years and older in grad. or professional schools:
Tremont: 1.2% Baltimore: 2.8%
- Percentage of students K-12 enrolled in private schools:
Tremont: 63.4% Baltimore: 12.7%
Percentage of population below poverty level:
| Tremont: | 15.8% |
| Baltimore: | 18.5% |
Median year owner moved in (as recorded in 2022):
| Tremont: | 1999 |
| Baltimore: | 2009 |
Percentage of married-couple families with both working:
| Tremont: | 172.1% |
| Baltimore: | 79.2% |
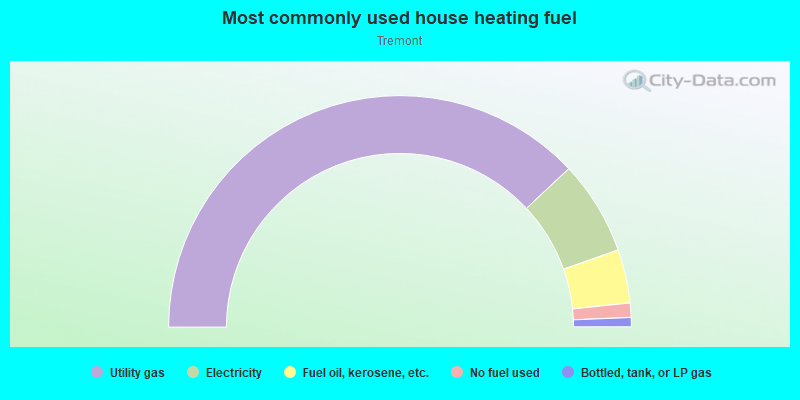
- 76.1%Utility gas
- 13.2%Electricity
- 7.5%Fuel oil, kerosene, etc.
- 2.0%No fuel used
- 1.3%Bottled, tank, or LP gas
Roads and streets:
S Tremont Rd
Length: 0.12 miles
Direction: N-S
Address range: 1 to 247
Direction: N-S
Address range: 1 to 247
Sayer Ave
Length: 0.10 miles
Direction: E-W
Address range: 4700 to 4713
Direction: E-W
Address range: 4700 to 4713
Pen Lucy Rd
Length: 0.06 miles
Direction: SW-NE
Address range: 4660 to 4699
Direction: SW-NE
Address range: 4660 to 4699
N Tremont Rd
Length: 0.05 miles
Direction: N-S
Address range: 1 to 99
Direction: N-S
Address range: 1 to 99
N Beechfield Ave
Length: 0.03 miles
Directions: N-S, SE-NW
Address range: 16 to 37
Directions: N-S, SE-NW
Address range: 16 to 37