Townlot neighborhood in Huntington Beach, California (CA), 92648 detailed profile
Settings
X


Business Search - 14 Million verified businesses
Area: 0.464 square miles
Population: 4,506
Population density:
| Townlot: | 9,711 people per square mile |
| Huntington Beach: | 7,362 people per square mile |

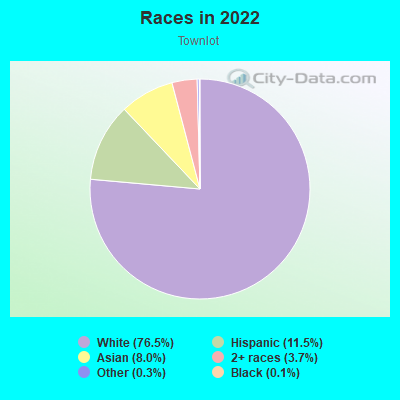
- 3,45376.5%White
- 51811.5%Hispanic or Latino
- 3598.0%Asian
- 1663.7%Two or more races
- 130.3%Some other race
- 50.1%Black
Median household income in 2022:
| Townlot: | $148,125 |
| Huntington Beach: | $111,122 |
Distribution of median household income
![Distribution of median household income]()
- 46Less than $10,000
- 118$10,000 to $19,999
- 83$20,000 to $29,999
- 169$30,000 to $39,999
- 245$40,000 to $49,999
- 69$50,000 to $59,999
- 171$60,000 to $74,999
- 421$75,000 to $99,999
- 242$100,000 to $124,999
- 293$125,000 to $149,999
- 246$150,000 to $199,999
- 521$200,000 or more

Distribution of owner-occupied house/condo value
![Distribution of owner-occupied house/condo value]()
- 48Less than $50,000
- 99$50,000 to $99,999
- 8$100,000 to $149,999
- 49$400,000 to $499,999
- 208$500,000 to $749,999
- 68$750,000 to $999,999
- 605$1,000,000 or more

Distribution of rent paid by renters
![Distribution of rent paid by renters]()
- 49$600 to $699
- 186$700 to $799
- 115$800 to $899
- 17$900 to $999
- 4$1,000 to $1,249
- 47$1,250 to $1,499
- 533$1,500 to $1,999
- 983$2,000 or more

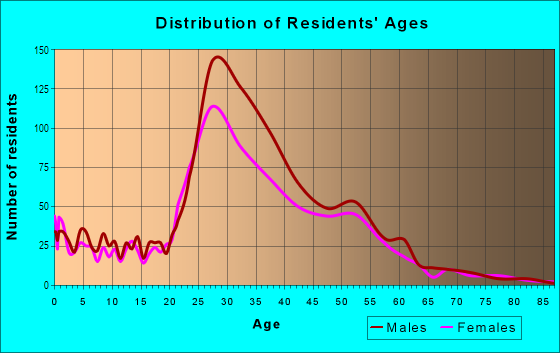
| Males: | 2,545 |
| Females: | 1,961 |
Males:
| This neighborhood: | 41.2 years |
| Whole city: | 43.6 years |
| This neighborhood: | 44.2 years |
| Whole city: | 44.2 years |
Average household size:
| Townlot: | 5.0 people |
| Huntington Beach: | 2.5 people |
Percentage of family households:
| Townlot: | 31.6% |
| Huntington Beach: | 42.1% |
| Here: | 31.0% |
| Huntington Beach: | 47.5% |
Percentage of married-couple families with children (among all households):
| Townlot: | 38.7% |
| Huntington Beach: | 31.5% |
Percentage of single-mother households (among all households):
| Townlot: | 15.7% |
| Huntington Beach: | 5.7% |
Percentage of never married males 15 years old and over:
Percentage of never married females 15 years old and over:
| Townlot: | 28.7% |
| Huntington Beach: | 18.9% |
Percentage of never married females 15 years old and over:
| Townlot: | 14.8% |
| city: | 16.3% |
Percentage of people that speak English not well or not at all:
| Townlot: | 0.2% |
| Huntington Beach: | 4.1% |
Percentage of people born in this state:
Percentage of people born in another U.S. state:
Percentage of native residents but born outside the U.S.:
Percentage of foreign born residents:
| Here: | 54.5% |
| Huntington Beach: | 57.7% |
Percentage of people born in another U.S. state:
| Townlot: | 31.7% |
| Huntington Beach: | 22.8% |
Percentage of native residents but born outside the U.S.:
| Here: | 0.8% |
| city: | 1.5% |
Percentage of foreign born residents:
| Here: | 12.9% |
| Huntington Beach: | 18.0% |
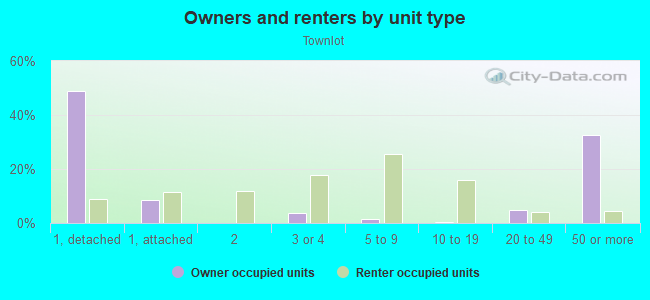
Owner-occupied
Renter-occupied

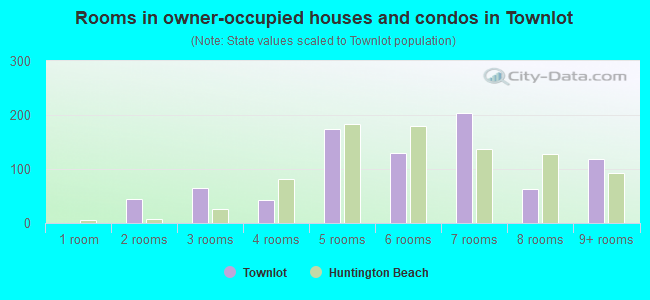
- Rooms in owner-occupied houses and condos in Townlot
- 01 room
- 452 rooms
- 653 rooms
- 424 rooms
- 1745 rooms
- 1296 rooms
- 2047 rooms
- 638 rooms
- 1199+ rooms
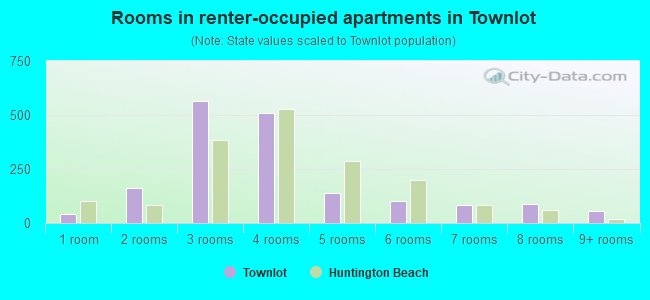
- Rooms in renter-occupied apartments in Townlot
- 411 room
- 1622 rooms
- 5673 rooms
- 5074 rooms
- 1405 rooms
- 1026 rooms
- 827 rooms
- 888 rooms
- 549+ rooms
Owner-occupied
Renter-occupied
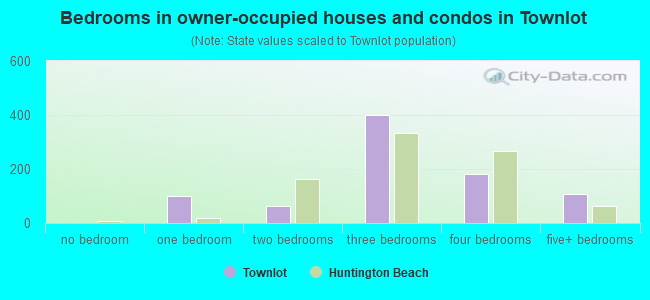
- Bedrooms in owner-occupied houses and condos in Townlot
- 0no bedroom
- 1011 bedroom
- 632 bedrooms
- 3993 bedrooms
- 1834 bedrooms
- 1065+ bedrooms
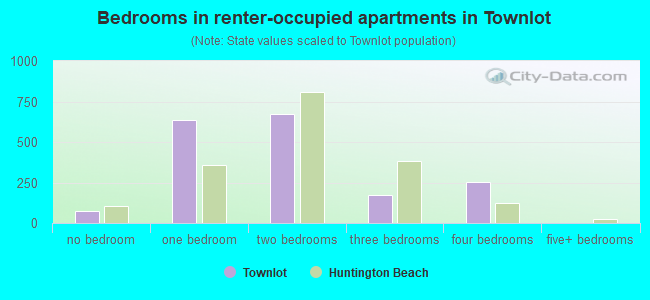
- Bedrooms in renter-occupied apartments in Townlot
- 71no bedroom
- 6361 bedroom
- 6702 bedrooms
- 1703 bedrooms
- 2564 bedrooms
- 05+ bedrooms
Average number of cars or other vehicles available in houses/condos:
Average number of cars or other vehicles available in apartments:
| This neighborhood: | 2.2 |
| Huntington Beach: | 2.1 |
Average number of cars or other vehicles available in apartments:
| Here: | 1.7 |
| city: | 1.8 |
Percentage of units with a mortgage:
| Townlot: | 56.0% |
| Huntington Beach: | 63.1% |
Housing prices:
- Average estimated value of detached houses in 2022 (31.4% of all units):
Townlot: $1,787,579 Huntington Beach: $1,395,007
- Average estimated value of townhouses or other attached units in 2022 (8.1% of all units):
This neighborhood: $1,026,187 city: $1,007,080
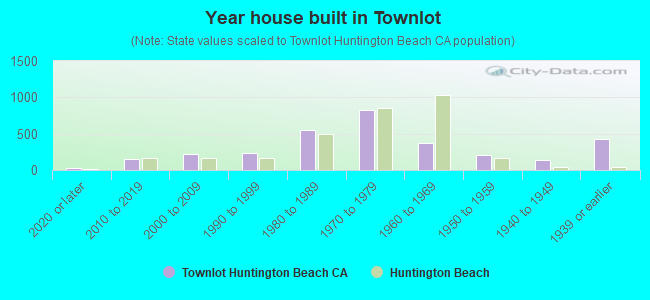
- Year house built in Townlot
- 212020 or later
- 1582010 to 2019
- 2192000 to 2009
- 2361990 to 1999
- 5441980 to 1989
- 8191970 to 1979
- 3681960 to 1969
- 2081950 to 1959
- 1431940 to 1949
- 4251939 or earlier
City-data.com crime index for city in 2020 (higher means more crime):
| City: | 172.8 |
| U.S. average: | 219.5 |
Travel time to work (commute)
![Travel time to work (commute)]()
- 164Less than 5 minutes
- 265 to 9 minutes
- 23110 to 14 minutes
- 18515 to 19 minutes
- 23820 to 24 minutes
- 13925 to 29 minutes
- 45230 to 34 minutes
- 14235 to 39 minutes
- 14140 to 44 minutes
- 21745 to 59 minutes
- 19660 to 89 minutes
- 7690 or more minutes

Means of transportation to work
![Means of transportation to work]()
- 71.3%2,076Drove a car alone
- 2.9%83Carpooled
- 0.1%4Bus
- 0.5%14Bicycle
- 3.7%107Walked
- 0.9%27Other means
- 24.7%720Worked at home

Time leaving home to go to work
![Time leaving home to go to work]()
- 6012:00 a.m. to 4:59 a.m.
- 1095:00 a.m. to 5:29 a.m.
- 1045:30 a.m. to 5:59 a.m.
- 1966:00 a.m. to 6:29 a.m.
- 3216:30 a.m. to 6:59 a.m.
- 3897:00 a.m. to 7:29 a.m.
- 2127:30 a.m. to 7:59 a.m.
- 2188:00 a.m. to 8:29 a.m.
- 2068:30 a.m. to 8:59 a.m.
- 959:00 a.m. to 9:59 a.m.
- 10710:00 a.m. to 10:59 a.m.
- 2111:00 a.m. to 11:59 a.m.
- 9012:00 p.m. to 3:59 p.m.
- 344:00 p.m. to 11:59 p.m.

Occupations of males:
- Percentage of males in management occupations (except farmers):
Here: 22.7% city: 17.0%
- Percentage of males in business and financial operations occupations:
Here: 12.6% city: 8.0%
- Percentage of males in computer and mathematical occupations:
Here: 2.3% city: 4.1%
- Percentage of males in architecture and engineering occupations:
Here: 3.7% city: 5.2%
- Percentage of males in legal occupations:
Here: 1.2% city: 1.1%
- Percentage of males in arts, design, entertainment, sports, and media occupations:
Here: 2.0% city: 3.2%
- Percentage of males in healthcare practitioners and technical occupations:
Here: 4.5% city: 4.2%
- Percentage of males in service occupations:
Here: 9.5% city: 13.4%
- Percentage of males in sales and office occupations:
Here: 22.7% city: 17.7%
- Percentage of males in construction, extraction, and maintenance occupations:
Here: 3.5% city: 5.8%
- Percentage of males in production occupations:
Here: 4.4% city: 5.1%
- Percentage of males in transportation occupations:
Here: 4.6% city: 2.8%
- Percentage of males in material moving occupations:
Here: 1.7% city: 2.5%
Occupations of females:
- Percentage of females in management occupations (except farmers):
Here: 10.5% city: 12.6%
- Percentage of females in business and financial operations occupations:
Here: 10.5% city: 8.8%
- Percentage of females in computer and mathematical occupations:
Here: 1.1% city: 1.5%
- Percentage of females in life, physical, and social science occupations:
Here: 6.5% city: 1.1%
- Percentage of females in education, training, and library occupations:
Here: 4.5% city: 8.8%
- Percentage of females in arts, design, entertainment, sports, and media occupations:
Here: 3.9% city: 2.6%
- Percentage of females in healthcare practitioners and technical occupations:
Here: 17.6% city: 10.1%
- Percentage of females in service occupations:
Here: 14.6% city: 16.4%
- Percentage of females in sales and office occupations:
Here: 25.2% city: 25.5%
- Percentage of females in production occupations:
Here: 2.2% city: 2.3%
- Percentage of females in transportation occupations:
Here: 1.1% city: 0.5%
- Percentage of females in material moving occupations:
Here: 1.7% city: 2.3%
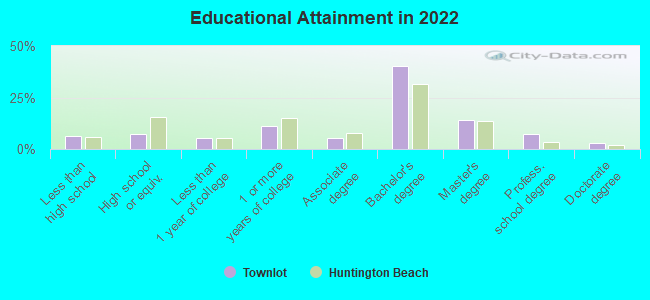
Education in this neighborhood (subdivision or community):
- Percentage of people 3 years and older in K-12 schools:
Townlot: 13.6% Huntington Beach: 13.1%
- Percentage of people 3 years and older in undergraduate colleges:
Townlot: 5.0% Huntington Beach: 5.8%
- Percentage of people 3 years and older in grad. or professional schools:
Townlot: 1.6% Huntington Beach: 1.2%
- Percentage of students K-12 enrolled in private schools:
Townlot: 86.9% Huntington Beach: 18.8%
Percentage of population below poverty level:
| Townlot: | 1.9% |
| Huntington Beach: | 7.0% |
Median year owner moved in (as recorded in 2022):
| Townlot: | 2008 |
| Huntington Beach: | 2006 |
Percentage of married-couple families with both working:
| Townlot: | 121.6% |
| Huntington Beach: | 65.3% |
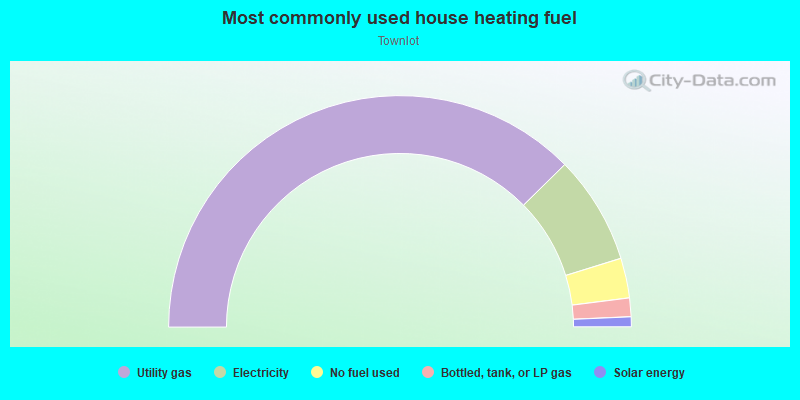
- 75.3%Utility gas
- 15.2%Electricity
- 5.6%No fuel used
- 2.6%Bottled, tank, or LP gas
- 1.4%Solar energy
Highways in this neighborhood:
State Hwy 1 (Pacific Coast Hwy)
Length: 1.17 miles
Direction: SE-NW
Address range: 701 to 2298
Direction: SE-NW
Address range: 701 to 2298
Roads and streets:
Walnut Ave
Length: 1.11 miles
Direction: SE-NW
Address range: 700 to 2299
Direction: SE-NW
Address range: 700 to 2299
Orange Ave
Length: 1.11 miles
Direction: SE-NW
Address range: 700 to 2299
Direction: SE-NW
Address range: 700 to 2299
Pecan Ave
Length: 1.10 miles
Direction: SE-NW
Address range: 700 to 2283
Direction: SE-NW
Address range: 700 to 2283
Acacia Ave
Length: 1.10 miles
Direction: SE-NW
Address range: 700 to 2283
Direction: SE-NW
Address range: 700 to 2283
Olive Ave
Length: 1.10 miles
Direction: SE-NW
Address range: 700 to 2283
Direction: SE-NW
Address range: 700 to 2283
8th St
Length: 0.43 miles
Direction: SW-NE
Address range: 100 to 599
Direction: SW-NE
Address range: 100 to 599
9th St
Length: 0.43 miles
Direction: SW-NE
Address range: 100 to 599
Direction: SW-NE
Address range: 100 to 599
7th St
Length: 0.43 miles
Direction: SW-NE
Address range: 100 to 599
Direction: SW-NE
Address range: 100 to 599
21st St
Length: 0.42 miles
Direction: SW-NE
Address range: 100 to 599
Direction: SW-NE
Address range: 100 to 599
20th St
Length: 0.42 miles
Direction: SW-NE
Address range: 100 to 599
Direction: SW-NE
Address range: 100 to 599
10th St
Length: 0.42 miles
Direction: SW-NE
Address range: 100 to 599
Direction: SW-NE
Address range: 100 to 599
16th St
Length: 0.42 miles
Direction: SW-NE
Address range: 100 to 599
Direction: SW-NE
Address range: 100 to 599
14th St
Length: 0.42 miles
Direction: SW-NE
Address range: 100 to 599
Direction: SW-NE
Address range: 100 to 599
12th St
Length: 0.42 miles
Direction: SW-NE
Address range: 100 to 599
Direction: SW-NE
Address range: 100 to 599
19th St
Length: 0.42 miles
Direction: SW-NE
Address range: 100 to 599
Direction: SW-NE
Address range: 100 to 599
13th St
Length: 0.42 miles
Direction: SW-NE
Address range: 100 to 599
Direction: SW-NE
Address range: 100 to 599
18th St
Length: 0.42 miles
Direction: SW-NE
Address range: 100 to 599
Direction: SW-NE
Address range: 100 to 599
11th St
Length: 0.42 miles
Direction: SW-NE
Address range: 100 to 599
Direction: SW-NE
Address range: 100 to 599
22nd St
Length: 0.42 miles
Direction: SW-NE
Address range: 100 to 599
Direction: SW-NE
Address range: 100 to 599
17th St
Length: 0.42 miles
Direction: SW-NE
Address range: 100 to 599
Direction: SW-NE
Address range: 100 to 599
15th St
Length: 0.42 miles
Direction: SW-NE
Address range: 100 to 599
Direction: SW-NE
Address range: 100 to 599
Goldenwest St
Length: 0.05 miles
Direction: SW-NE
Direction: SW-NE