Thornton neighborhood in Denver, Colorado (CO), 80229 detailed profile
Settings
X


Business Search - 14 Million verified businesses
Area: 0.006 square miles
Population: 7,152
Population density:
| Thornton: | 1,134,493 people per square mile |
| Denver: | 4,651 people per square mile |

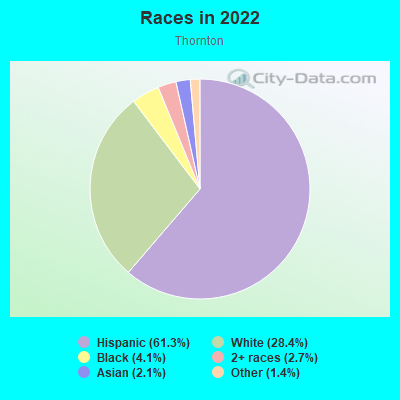
- 4,63061.3%Hispanic or Latino
- 2,14428.4%White
- 3134.1%Black
- 2022.7%Two or more races
- 1572.1%Asian
- 1071.4%Some other race
Median household income in 2022:
| Thornton: | $75,461 |
| Denver: | $88,213 |
Distribution of median household income
![Distribution of median household income]()
- 88Less than $10,000
- 68$10,000 to $19,999
- 100$20,000 to $29,999
- 248$30,000 to $39,999
- 267$40,000 to $49,999
- 270$50,000 to $59,999
- 347$60,000 to $74,999
- 519$75,000 to $99,999
- 368$100,000 to $124,999
- 260$125,000 to $149,999
- 106$150,000 to $199,999
- 177$200,000 or more

Distribution of owner-occupied house/condo value
![Distribution of owner-occupied house/condo value]()
- 803Less than $50,000
- 25$50,000 to $99,999
- 68$100,000 to $149,999
- 109$150,000 to $199,999
- 156$200,000 to $249,999
- 184$250,000 to $299,999
- 1,231$300,000 to $399,999
- 310$400,000 to $499,999
- 83$500,000 to $749,999
- 144$750,000 to $999,999

Distribution of rent paid by renters
![Distribution of rent paid by renters]()
- 53Less than $100
- 95$200 to $299
- 48$400 to $499
- 65$500 to $599
- 116$700 to $799
- 66$800 to $899
- 30$900 to $999
- 121$1,000 to $1,249
- 170$1,250 to $1,499
- 357$1,500 to $1,999
- 83$2,000 or more

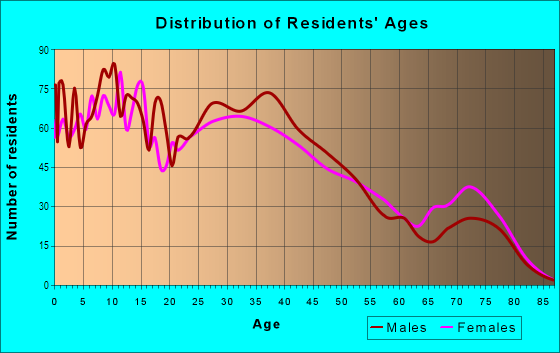
| Males: | 3,698 |
| Females: | 3,454 |
Males:
| This neighborhood: | 35.9 years |
| Whole city: | 35.2 years |
| This neighborhood: | 37.9 years |
| Whole city: | 35.1 years |
Average household size:
| Thornton: | 8.2 people |
| Denver: | 28.0 people |
Percentage of family households:
| Thornton: | 62.0% |
| Denver: | 35.1% |
| Here: | 49.0% |
| Denver: | 32.5% |
Percentage of married-couple families with children (among all households):
| Thornton: | 19.5% |
| Denver: | 32.4% |
Percentage of single-mother households (among all households):
| Thornton: | 10.1% |
| Denver: | 10.3% |
Percentage of never married males 15 years old and over:
Percentage of never married females 15 years old and over:
| Thornton: | 18.9% |
| Denver: | 25.0% |
Percentage of never married females 15 years old and over:
| Thornton: | 13.9% |
| city: | 20.8% |
Percentage of people that speak English not well or not at all:
| Thornton: | 4.7% |
| Denver: | 3.9% |
Percentage of people born in this state:
Percentage of people born in another U.S. state:
Percentage of native residents but born outside the U.S.:
Percentage of foreign born residents:
| Here: | 56.1% |
| Denver: | 38.5% |
Percentage of people born in another U.S. state:
| Thornton: | 26.0% |
| Denver: | 46.1% |
Percentage of native residents but born outside the U.S.:
| Here: | 1.0% |
| city: | 1.7% |
Percentage of foreign born residents:
| Here: | 16.9% |
| Denver: | 13.8% |
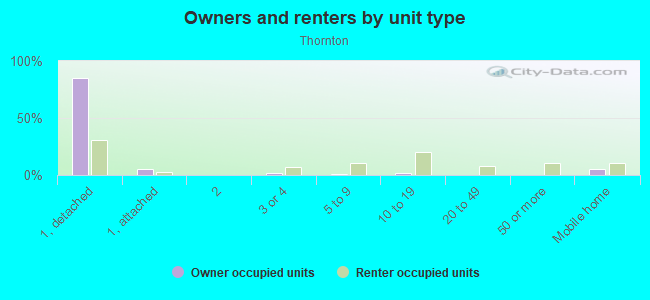
Owner-occupied
Renter-occupied

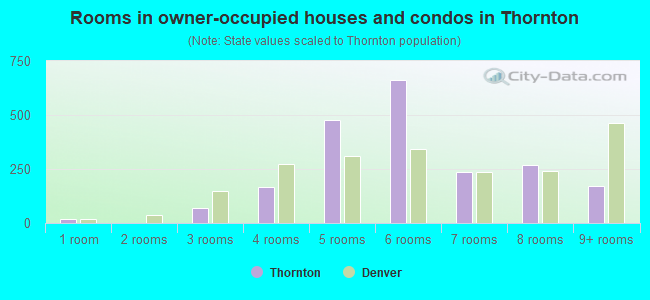
- Rooms in owner-occupied houses and condos in Thornton
- 181 room
- 02 rooms
- 693 rooms
- 1664 rooms
- 4765 rooms
- 6616 rooms
- 2387 rooms
- 2698 rooms
- 1739+ rooms
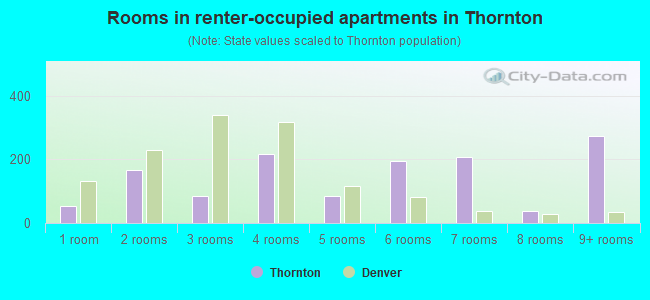
- Rooms in renter-occupied apartments in Thornton
- 551 room
- 1672 rooms
- 853 rooms
- 2174 rooms
- 855 rooms
- 1946 rooms
- 2077 rooms
- 378 rooms
- 2739+ rooms
Owner-occupied
Renter-occupied
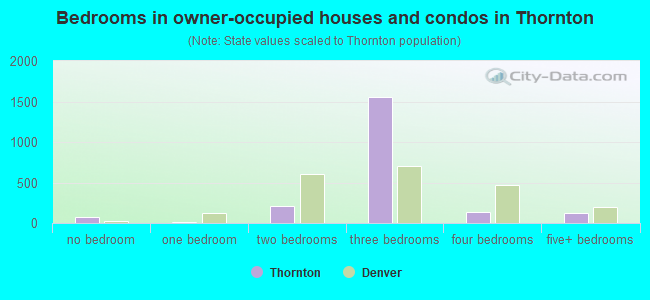
- Bedrooms in owner-occupied houses and condos in Thornton
- 69no bedroom
- 161 bedroom
- 2072 bedrooms
- 1,5613 bedrooms
- 1324 bedrooms
- 1285+ bedrooms
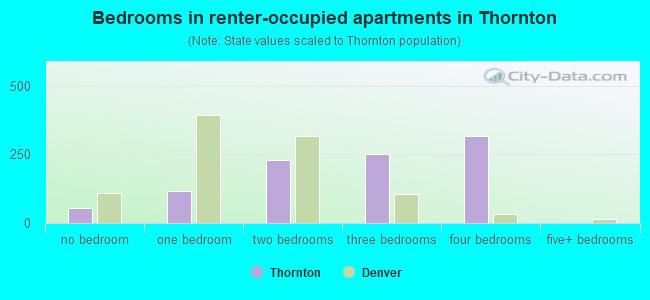
- Bedrooms in renter-occupied apartments in Thornton
- 55no bedroom
- 1161 bedroom
- 2312 bedrooms
- 2503 bedrooms
- 3184 bedrooms
- 05+ bedrooms
Average number of cars or other vehicles available in houses/condos:
Average number of cars or other vehicles available in apartments:
| This neighborhood: | 2.1 |
| Denver: | 1.9 |
Average number of cars or other vehicles available in apartments:
| Here: | 2.5 |
| city: | 1.3 |
Percentage of units with a mortgage:
| Thornton: | 84.6% |
| Denver: | 75.6% |
Average estimated value of detached houses in 2022 (93.5% of all units):
| Thornton: | $358,085 |
| Colorado: | $676,667 |
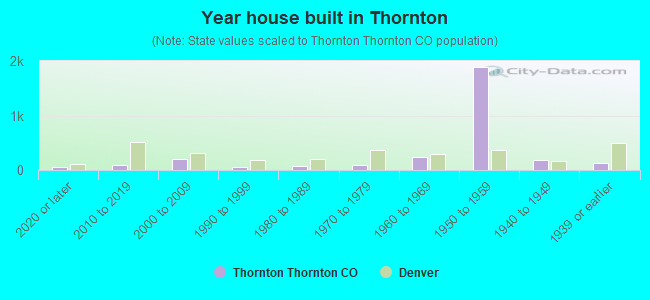
- Year house built in Thornton
- 592020 or later
- 882010 to 2019
- 2032000 to 2009
- 541990 to 1999
- 681980 to 1989
- 831970 to 1979
- 2371960 to 1969
- 1,8951950 to 1959
- 1831940 to 1949
- 1231939 or earlier
City-data.com crime index for city in 2020 (higher means more crime):
| City: | 519.0 |
| U.S. average: | 219.5 |
Travel time to work (commute)
![Travel time to work (commute)]()
- 33Less than 5 minutes
- 605 to 9 minutes
- 30810 to 14 minutes
- 1,00315 to 19 minutes
- 56320 to 24 minutes
- 20725 to 29 minutes
- 66130 to 34 minutes
- 28135 to 39 minutes
- 15440 to 44 minutes
- 22545 to 59 minutes
- 25960 to 89 minutes
- 8690 or more minutes

Means of transportation to work
![Means of transportation to work]()
- 76.4%2,881Drove a car alone
- 10.2%383Carpooled
- 5.3%199Bus
- 0.3%12Long-distance train or commuter rail
- 3.4%127Light rail, streetcar or trolley
- 6.2%235Walked
- 3.5%131Other means
- 9.2%347Worked at home

Time leaving home to go to work
![Time leaving home to go to work]()
- 44512:00 a.m. to 4:59 a.m.
- 2625:00 a.m. to 5:29 a.m.
- 3115:30 a.m. to 5:59 a.m.
- 4636:00 a.m. to 6:29 a.m.
- 2366:30 a.m. to 6:59 a.m.
- 6897:00 a.m. to 7:29 a.m.
- 3387:30 a.m. to 7:59 a.m.
- 2968:00 a.m. to 8:29 a.m.
- 1368:30 a.m. to 8:59 a.m.
- 809:00 a.m. to 9:59 a.m.
- 1710:00 a.m. to 10:59 a.m.
- 26811:00 a.m. to 11:59 a.m.
- 20912:00 p.m. to 3:59 p.m.
- 2824:00 p.m. to 11:59 p.m.

Occupations of males:
- Percentage of males in management occupations (except farmers):
Here: 4.6% city: 15.4%
- Percentage of males in business and financial operations occupations:
Here: 6.3% city: 8.3%
- Percentage of males in computer and mathematical occupations:
Here: 4.1% city: 7.4%
- Percentage of males in life, physical, and social science occupations:
Here: 1.4% city: 1.4%
- Percentage of males in arts, design, entertainment, sports, and media occupations:
Here: 2.5% city: 3.1%
- Percentage of males in service occupations:
Here: 8.8% city: 11.9%
- Percentage of males in sales and office occupations:
Here: 14.4% city: 15.4%
- Percentage of males in construction, extraction, and maintenance occupations:
Here: 20.6% city: 8.0%
- Percentage of males in production occupations:
Here: 10.2% city: 3.2%
- Percentage of males in transportation occupations:
Here: 6.6% city: 4.2%
- Percentage of males in material moving occupations:
Here: 10.4% city: 3.5%
Occupations of females:
- Percentage of females in management occupations (except farmers):
Here: 9.9% city: 14.0%
- Percentage of females in business and financial operations occupations:
Here: 2.1% city: 10.0%
- Percentage of females in computer and mathematical occupations:
Here: 3.6% city: 2.9%
- Percentage of females in architecture and engineering occupations:
Here: 1.2% city: 1.5%
- Percentage of females in community and social services occupations:
Here: 1.0% city: 3.0%
- Percentage of females in education, training, and library occupations:
Here: 8.7% city: 7.9%
- Percentage of females in healthcare practitioners and technical occupations:
Here: 1.9% city: 10.2%
- Percentage of females in service occupations:
Here: 26.5% city: 16.2%
- Percentage of females in sales and office occupations:
Here: 32.3% city: 21.4%
- Percentage of females in construction, extraction, and maintenance occupations:
Here: 1.5% city: 0.4%
- Percentage of females in production occupations:
Here: 6.6% city: 1.7%
- Percentage of females in material moving occupations:
Here: 4.6% city: 1.4%
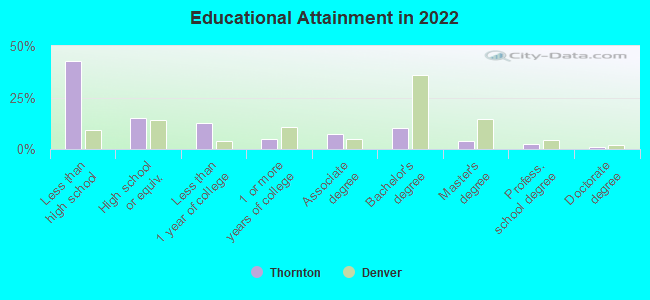
Education in this neighborhood (subdivision or community):
- Percentage of people 3 years and older in K-12 schools:
Thornton: 27.5% Denver: 12.7%
- Percentage of people 3 years and older in undergraduate colleges:
Thornton: 4.4% Denver: 4.1%
- Percentage of people 3 years and older in grad. or professional schools:
Thornton: 2.8% Denver: 2.2%
- Percentage of students K-12 enrolled in private schools:
Thornton: 15.7% Denver: 11.0%
Percentage of population below poverty level:
| Thornton: | 5.5% |
| Denver: | 11.8% |
Median year owner moved in (as recorded in 2022):
| Thornton: | 2016 |
| Denver: | 2014 |
Percentage of married-couple families with both working:
| Thornton: | 98.1% |
| Denver: | 74.1% |
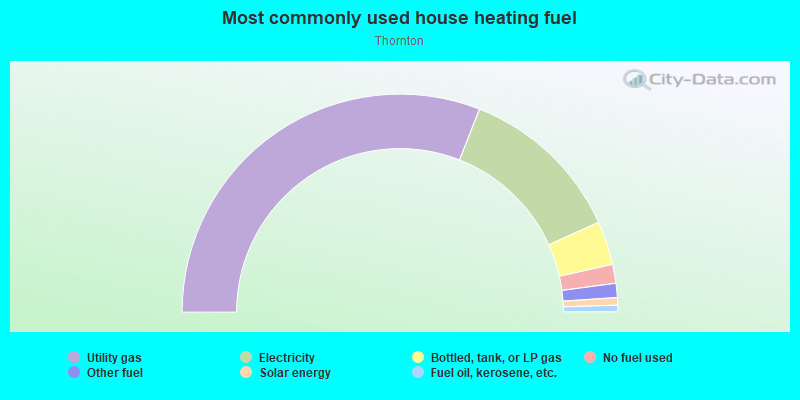
- 61.9%Utility gas
- 24.6%Electricity
- 6.5%Bottled, tank, or LP gas
- 2.8%No fuel used
- 2.1%Other fuel
- 1.1%Solar energy
- 1.0%Fuel oil, kerosene, etc.