The North Harbor neighborhood in Waukegan, Illinois (IL), 60085 detailed profile
Settings
X


Business Search - 14 Million verified businesses
Area: 0.789 square miles
Population: 1,831
Population density:
| The North Harbor: | 2,319 people per square mile |
| Waukegan: | 3,758 people per square mile |

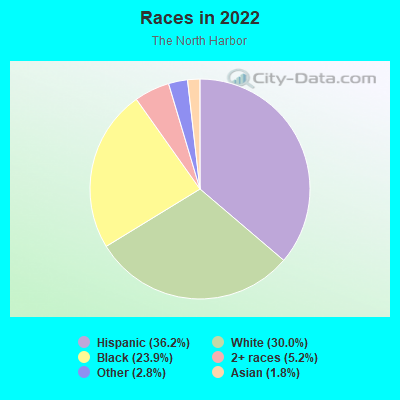
- 66336.2%Hispanic or Latino
- 54930.0%White
- 43723.9%Black
- 955.2%Two or more races
- 522.8%Some other race
- 331.8%Asian
Median household income in 2022:
| The North Harbor: | $46,450 |
| Waukegan: | $64,299 |
Distribution of median household income
![Distribution of median household income]()
- 78Less than $10,000
- 104$10,000 to $19,999
- 74$20,000 to $29,999
- 57$40,000 to $49,999
- 41$50,000 to $59,999
- 33$60,000 to $74,999
- 61$75,000 to $99,999
- 26$100,000 to $124,999
- 26$125,000 to $149,999
- 63$150,000 to $199,999
- 25$200,000 or more

Distribution of owner-occupied house/condo value
![Distribution of owner-occupied house/condo value]()
- 5Less than $50,000
- 15$50,000 to $99,999
- 65$100,000 to $149,999
- 55$150,000 to $199,999
- 32$200,000 to $249,999
- 26$250,000 to $299,999
- 25$300,000 to $399,999
- 3$400,000 to $499,999
- 10$500,000 to $749,999

Distribution of rent paid by renters
![Distribution of rent paid by renters]()
- 4Less than $100
- 6$200 to $299
- 14$300 to $399
- 5$400 to $499
- 20$500 to $599
- 24$600 to $699
- 100$700 to $799
- 89$800 to $899
- 40$900 to $999
- 25$1,000 to $1,249
- 12$1,250 to $1,499
- 6$1,500 to $1,999

Median rent in 2022:
| The North Harbor: | $800 |
| Waukegan: | $968 |
| Males: | 1,004 |
| Females: | 827 |
Males:
| This neighborhood: | 32.8 years |
| Whole city: | 33.0 years |
| This neighborhood: | 34.1 years |
| Whole city: | 33.9 years |
Average household size:
| The North Harbor: | 2.5 people |
| Waukegan: | 2.6 people |
Percentage of family households:
| The North Harbor: | 36.1% |
| Waukegan: | 46.5% |
| Here: | 28.6% |
| Waukegan: | 40.0% |
Percentage of married-couple families with children (among all households):
| The North Harbor: | 10.7% |
| Waukegan: | 22.3% |
Percentage of single-mother households (among all households):
| The North Harbor: | 19.1% |
| Waukegan: | 13.4% |
Percentage of never married males 15 years old and over:
Percentage of never married females 15 years old and over:
| The North Harbor: | 33.6% |
| Waukegan: | 25.1% |
Percentage of never married females 15 years old and over:
| The North Harbor: | 18.7% |
| city: | 19.3% |
Percentage of people that speak English not well or not at all:
| The North Harbor: | 4.5% |
| Waukegan: | 10.3% |
Percentage of people born in this state:
Percentage of people born in another U.S. state:
Percentage of native residents but born outside the U.S.:
Percentage of foreign born residents:
| Here: | 66.9% |
| Waukegan: | 51.4% |
Percentage of people born in another U.S. state:
| The North Harbor: | 15.8% |
| Waukegan: | 14.3% |
Percentage of native residents but born outside the U.S.:
| Here: | 2.0% |
| city: | 3.0% |
Percentage of foreign born residents:
| Here: | 15.3% |
| Waukegan: | 31.3% |
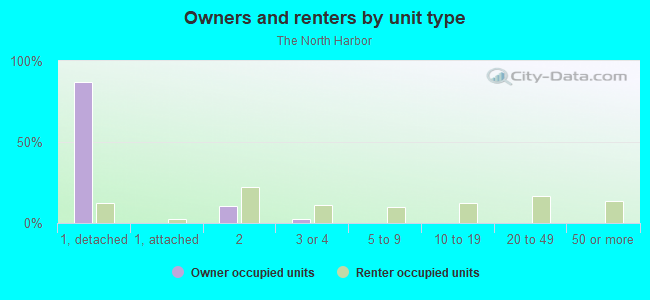
Owner-occupied
Renter-occupied

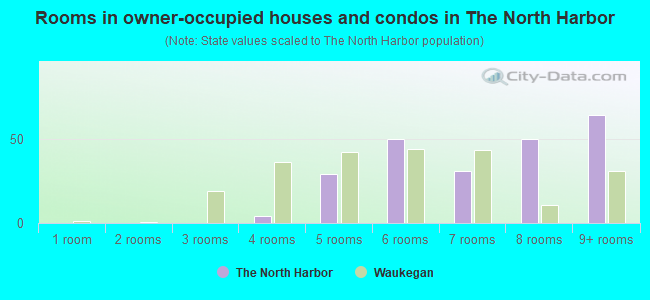
- Rooms in owner-occupied houses and condos in The North Harbor
- 01 room
- 02 rooms
- 03 rooms
- 44 rooms
- 295 rooms
- 506 rooms
- 317 rooms
- 508 rooms
- 649+ rooms
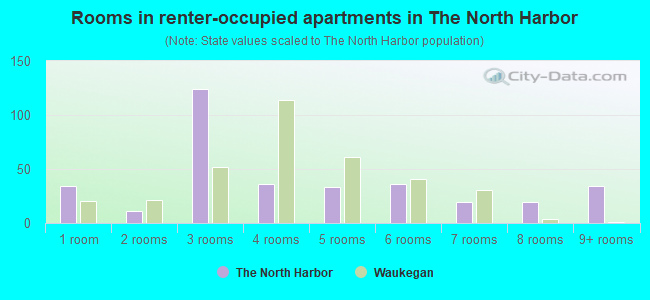
- Rooms in renter-occupied apartments in The North Harbor
- 341 room
- 112 rooms
- 1243 rooms
- 364 rooms
- 335 rooms
- 366 rooms
- 197 rooms
- 198 rooms
- 349+ rooms
Owner-occupied
Renter-occupied
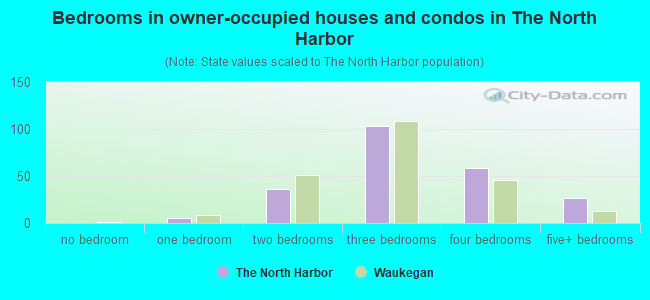
- Bedrooms in owner-occupied houses and condos in The North Harbor
- 0no bedroom
- 51 bedroom
- 362 bedrooms
- 1033 bedrooms
- 584 bedrooms
- 275+ bedrooms
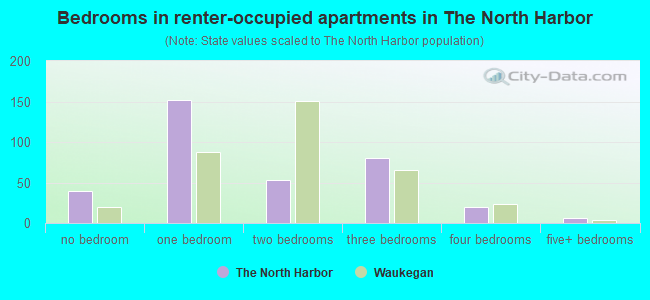
- Bedrooms in renter-occupied apartments in The North Harbor
- 39no bedroom
- 1521 bedroom
- 532 bedrooms
- 803 bedrooms
- 204 bedrooms
- 65+ bedrooms
Average number of cars or other vehicles available in houses/condos:
Average number of cars or other vehicles available in apartments:
| This neighborhood: | 2.3 |
| Waukegan: | 2.2 |
Average number of cars or other vehicles available in apartments:
| Here: | 1.2 |
| city: | 1.3 |
Percentage of units with a mortgage:
| The North Harbor: | 37.5% |
| Waukegan: | 56.7% |
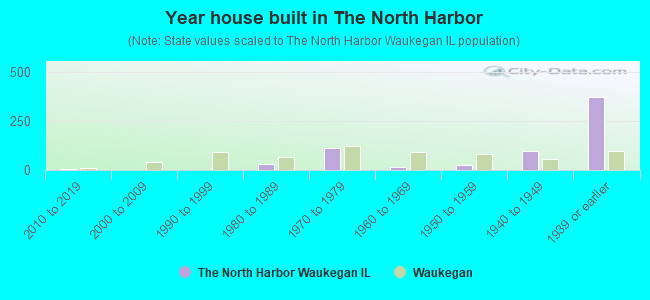
- Year house built in The North Harbor
- 02020 or later
- 32010 to 2019
- 02000 to 2009
- 01990 to 1999
- 291980 to 1989
- 1101970 to 1979
- 141960 to 1969
- 271950 to 1959
- 961940 to 1949
- 3691939 or earlier
City-data.com crime index for city in 2020 (higher means more crime):
| City: | 186.3 |
| U.S. average: | 219.5 |
Travel time to work (commute)
![Travel time to work (commute)]()
- 6Less than 5 minutes
- 295 to 9 minutes
- 7910 to 14 minutes
- 7815 to 19 minutes
- 10920 to 24 minutes
- 10325 to 29 minutes
- 12130 to 34 minutes
- 635 to 39 minutes
- 3740 to 44 minutes
- 7045 to 59 minutes
- 2160 to 89 minutes
- 1490 or more minutes

Means of transportation to work
![Means of transportation to work]()
- 75.6%540Drove a car alone
- 13.2%94Carpooled
- 1.0%7Bus
- 0.8%6Long-distance train or commuter rail
- 1.4%10Bicycle
- 1.7%12Walked
- 1.0%7Other means
- 4.9%35Worked at home

Time leaving home to go to work
![Time leaving home to go to work]()
- 1412:00 a.m. to 4:59 a.m.
- 475:00 a.m. to 5:29 a.m.
- 685:30 a.m. to 5:59 a.m.
- 1166:00 a.m. to 6:29 a.m.
- 616:30 a.m. to 6:59 a.m.
- 687:00 a.m. to 7:29 a.m.
- 377:30 a.m. to 7:59 a.m.
- 438:00 a.m. to 8:29 a.m.
- 398:30 a.m. to 8:59 a.m.
- 579:00 a.m. to 9:59 a.m.
- 2310:00 a.m. to 10:59 a.m.
- 2812:00 p.m. to 3:59 p.m.
- 694:00 p.m. to 11:59 p.m.

Occupations of males:
- Percentage of males in management occupations (except farmers):
Here: 13.4% city: 5.9%
- Percentage of males in business and financial operations occupations:
Here: 2.0% city: 4.0%
- Percentage of males in computer and mathematical occupations:
Here: 3.2% city: 3.8%
- Percentage of males in architecture and engineering occupations:
Here: 2.1% city: 2.2%
- Percentage of males in life, physical, and social science occupations:
Here: 5.1% city: 1.0%
- Percentage of males in legal occupations:
Here: 3.2% city: 0.3%
- Percentage of males in education, training, and library occupations:
Here: 5.6% city: 3.1%
- Percentage of males in service occupations:
Here: 4.8% city: 19.1%
- Percentage of males in sales and office occupations:
Here: 17.0% city: 13.1%
- Percentage of males in construction, extraction, and maintenance occupations:
Here: 3.8% city: 6.9%
- Percentage of males in production occupations:
Here: 7.0% city: 12.9%
- Percentage of males in transportation occupations:
Here: 19.4% city: 7.5%
- Percentage of males in material moving occupations:
Here: 13.3% city: 11.6%
Occupations of females:
- Percentage of females in management occupations (except farmers):
Here: 2.5% city: 6.0%
- Percentage of females in business and financial operations occupations:
Here: 1.1% city: 4.8%
- Percentage of females in education, training, and library occupations:
Here: 6.8% city: 6.7%
- Percentage of females in healthcare practitioners and technical occupations:
Here: 9.3% city: 8.0%
- Percentage of females in service occupations:
Here: 26.6% city: 21.7%
- Percentage of females in sales and office occupations:
Here: 32.2% city: 27.2%
- Percentage of females in production occupations:
Here: 10.4% city: 10.3%
- Percentage of females in transportation occupations:
Here: 5.2% city: 1.2%
- Percentage of females in material moving occupations:
Here: 4.2% city: 6.3%
Percentage of people 16-64 in Armed Forces:
| The North Harbor: | 0.5% |
| Waukegan: | 0.9% |
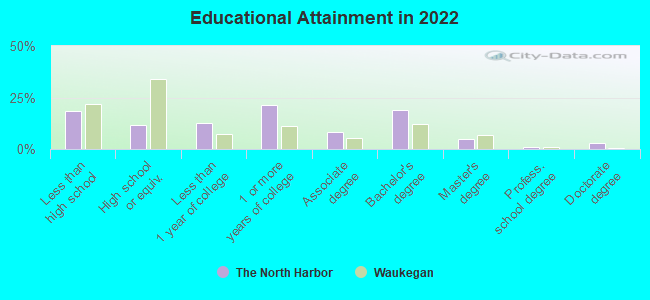
Education in this neighborhood (subdivision or community):
- Percentage of people 3 years and older in K-12 schools:
The North Harbor: 17.6% Waukegan: 20.4%
- Percentage of people 3 years and older in undergraduate colleges:
The North Harbor: 4.7% Waukegan: 5.1%
- Percentage of people 3 years and older in grad. or professional schools:
The North Harbor: 1.3% Waukegan: 0.9%
- Percentage of students K-12 enrolled in private schools:
The North Harbor: 5.3% Waukegan: 11.6%
Percentage of population below poverty level:
| The North Harbor: | 28.7% |
| Waukegan: | 11.6% |
Median year owner moved in (as recorded in 2022):
Median year renter moved in (as recorded in 2022):
| The North Harbor: | 2000 |
| Waukegan: | 2006 |
Median year renter moved in (as recorded in 2022):
| The North Harbor: | 2017 |
| Waukegan: | 2019 |
Percentage of married-couple families with both working:
| The North Harbor: | 92.4% |
| Waukegan: | 71.4% |
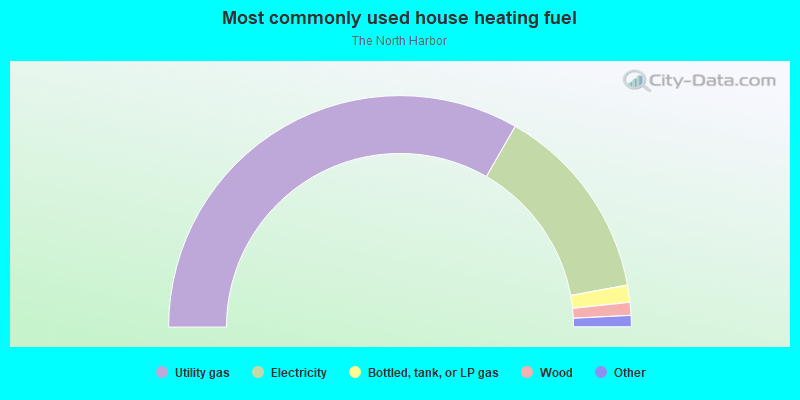
- 66.6%Utility gas
- 27.6%Electricity
- 2.4%Bottled, tank, or LP gas
- 1.8%Wood
- 0.9%No fuel used
- 0.8%Other fuel
Roads and streets:
E Sea Horse Dr
Length: 1.31 miles
Directions: E-W, N-S, SW-NE
Address range: 209 to 625
Directions: E-W, N-S, SW-NE
Address range: 209 to 625
Johnson Motors Rd
Length: 0.97 miles
Directions: E-W, N-S, SE-NW
Directions: E-W, N-S, SE-NW
Dahringer Rd
Length: 0.30 miles
Direction: E-W
Address range: 1 to 99
Direction: E-W
Address range: 1 to 99
Sea Horse Dr
Length: 0.16 miles
Directions: E-W, N-S, SW-NE
Directions: E-W, N-S, SW-NE
Railroad features:
Elgin Joliet and Eastern Rlwy
Length: 0.71 miles
Direction: N-S
Direction: N-S