The Asian District neighborhood in Las Vegas, Nevada (NV), 89102, 89103 detailed profile
Settings
X

Business Search - 14 Million verified businesses
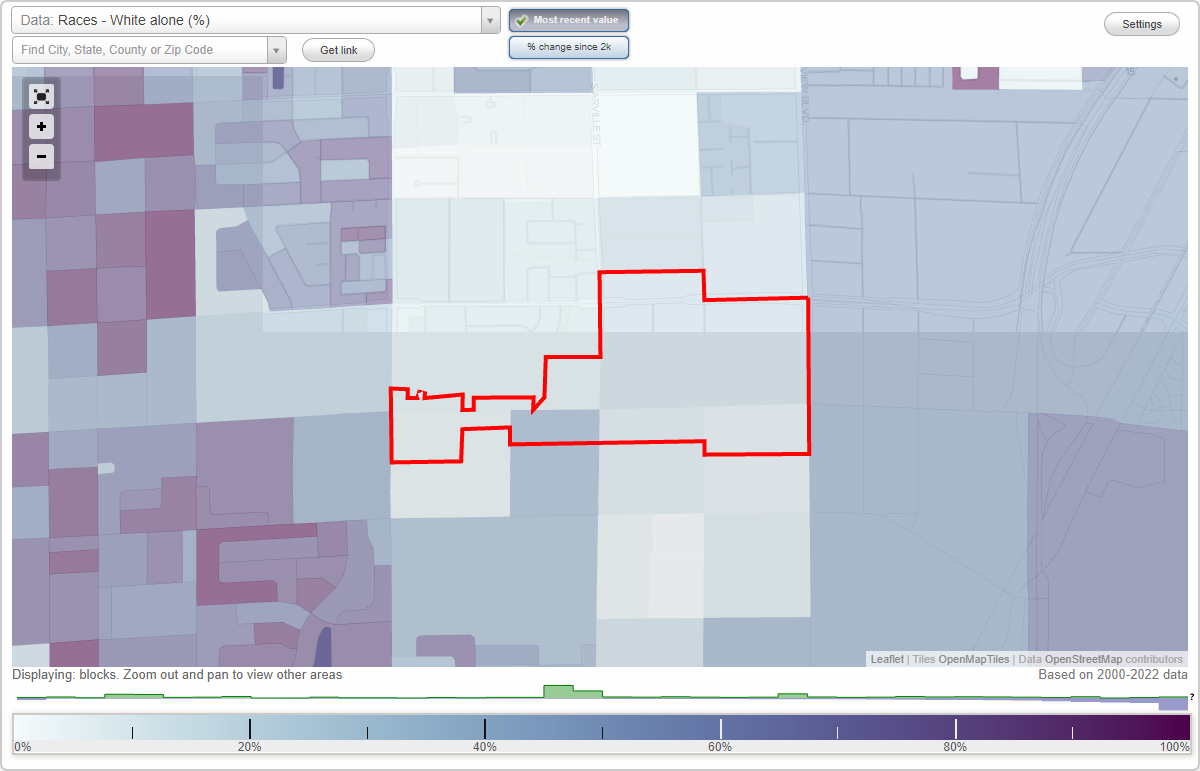
Area: 0.267 square miles
Population: 748
Population density:
| The Asian District: | 2,807 people per square mile |
| Las Vegas: | 5,792 people per square mile |

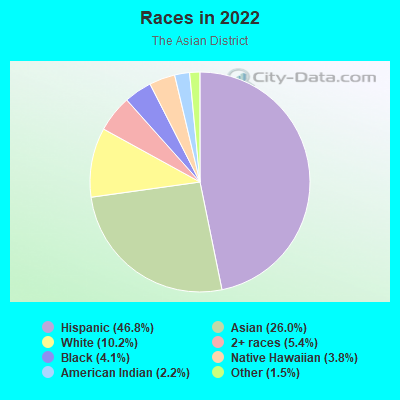
- 35446.8%Hispanic or Latino
- 19726.0%Asian
- 7710.2%White
- 415.4%Two or more races
- 314.1%Black
- 293.8%Native Hawaiian and Other
Pacific Islander - 172.2%American Indian
- 111.5%Some other race
Median household income in 2022:
| The Asian District: | $41,616 |
| Las Vegas: | $68,905 |
Distribution of median household income
![Distribution of median household income]()
- 40Less than $10,000
- 125$10,000 to $19,999
- 77$20,000 to $29,999
- 101$30,000 to $39,999
- 52$40,000 to $49,999
- 52$50,000 to $59,999
- 86$60,000 to $74,999
- 22$75,000 to $99,999
- 52$100,000 to $124,999
- 25$125,000 to $149,999
- 51$150,000 to $199,999
- 16$200,000 or more

Distribution of owner-occupied house/condo value
![Distribution of owner-occupied house/condo value]()
- 93Less than $50,000
- 71$50,000 to $99,999
- 20$100,000 to $149,999
- 37$150,000 to $199,999
- 70$200,000 to $249,999
- 36$250,000 to $299,999
- 128$300,000 to $399,999
- 28$400,000 to $499,999
- 24$500,000 to $749,999
- 5$750,000 to $999,999
- 6$1,000,000 or more

Distribution of rent paid by renters
![Distribution of rent paid by renters]()
- 60$100 to $199
- 113$200 to $299
- 54$300 to $399
- 79$400 to $499
- 59$500 to $599
- 30$600 to $699
- 53$700 to $799
- 144$800 to $899
- 119$900 to $999
- 49$1,000 to $1,249
- 22$1,250 to $1,499
- 19$1,500 to $1,999
- 62$2,000 or more

Median rent in 2022:
| The Asian District: | $905 |
| Las Vegas: | $1,277 |
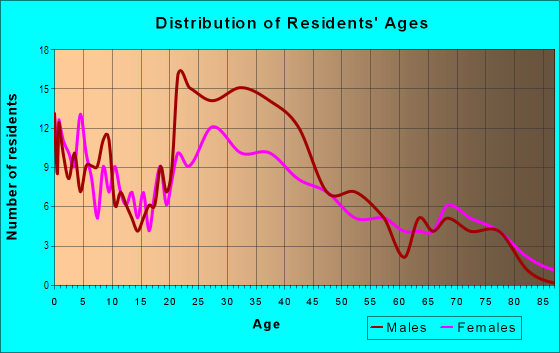
| Males: | 336 |
| Females: | 412 |
Males:
| This neighborhood: | 47.2 years |
| Whole city: | 38.4 years |
| This neighborhood: | 47.9 years |
| Whole city: | 38.9 years |
Average household size:
| The Asian District: | 2.0 people |
| Las Vegas: | 2.7 people |
Percentage of family households:
| The Asian District: | 25.6% |
| Las Vegas: | 45.8% |
| Here: | 28.0% |
| Las Vegas: | 40.9% |
Percentage of married-couple families with children (among all households):
| The Asian District: | 53.6% |
| Las Vegas: | 23.4% |
Percentage of single-mother households (among all households):
| The Asian District: | 78.0% |
| Las Vegas: | 10.1% |
Percentage of never married males 15 years old and over:
Percentage of never married females 15 years old and over:
| The Asian District: | 18.9% |
| Las Vegas: | 19.7% |
Percentage of never married females 15 years old and over:
| The Asian District: | 16.3% |
| city: | 17.0% |
Percentage of people that speak English not well or not at all:
| The Asian District: | 25.0% |
| Las Vegas: | 7.0% |
Percentage of people born in this state:
Percentage of people born in another U.S. state:
Percentage of native residents but born outside the U.S.:
Percentage of foreign born residents:
| Here: | 17.5% |
| Las Vegas: | 27.3% |
Percentage of people born in another U.S. state:
| The Asian District: | 44.0% |
| Las Vegas: | 49.8% |
Percentage of native residents but born outside the U.S.:
| Here: | 1.1% |
| city: | 1.9% |
Percentage of foreign born residents:
| Here: | 37.4% |
| Las Vegas: | 21.0% |
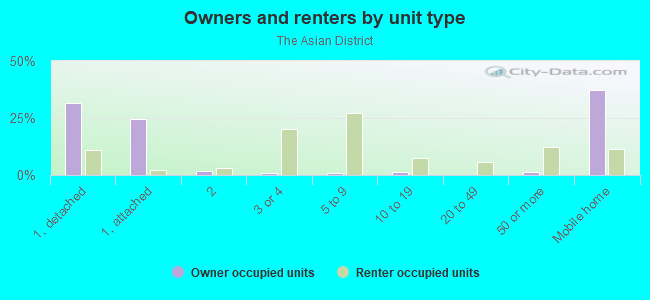
Owner-occupied
Renter-occupied

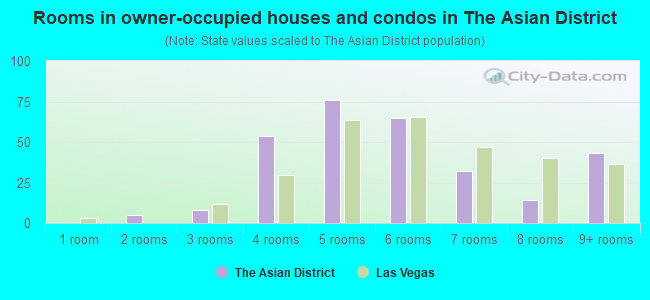
- Rooms in owner-occupied houses and condos in The Asian District
- 01 room
- 52 rooms
- 83 rooms
- 544 rooms
- 765 rooms
- 656 rooms
- 327 rooms
- 148 rooms
- 439+ rooms
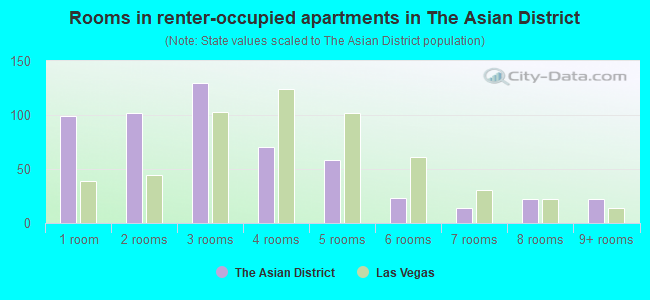
- Rooms in renter-occupied apartments in The Asian District
- 991 room
- 1022 rooms
- 1303 rooms
- 704 rooms
- 585 rooms
- 236 rooms
- 147 rooms
- 228 rooms
- 229+ rooms
Owner-occupied
Renter-occupied
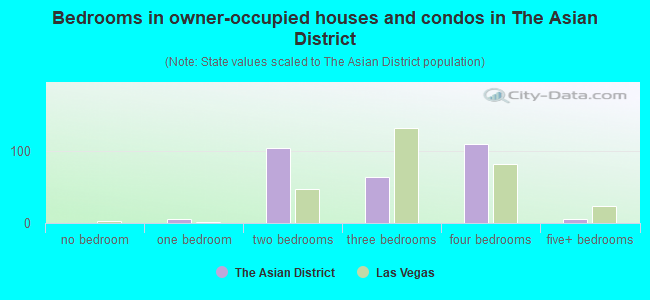
- Bedrooms in owner-occupied houses and condos in The Asian District
- 0no bedroom
- 51 bedroom
- 1042 bedrooms
- 633 bedrooms
- 1094 bedrooms
- 65+ bedrooms
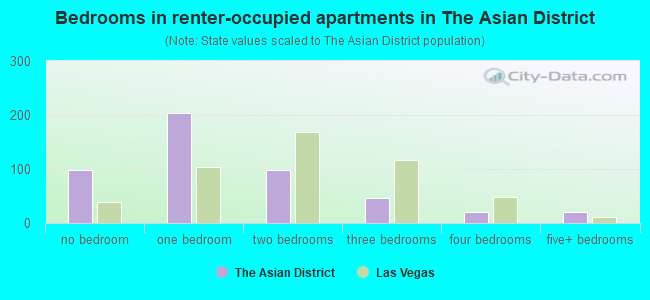
- Bedrooms in renter-occupied apartments in The Asian District
- 99no bedroom
- 2041 bedroom
- 982 bedrooms
- 463 bedrooms
- 204 bedrooms
- 215+ bedrooms
Average number of cars or other vehicles available in houses/condos:
Average number of cars or other vehicles available in apartments:
| This neighborhood: | |
| Las Vegas: |
Average number of cars or other vehicles available in apartments:
| Here: | 0.9 |
| city: | 1.3 |
Percentage of units with a mortgage:
| The Asian District: | 47.6% |
| Las Vegas: | 69.3% |
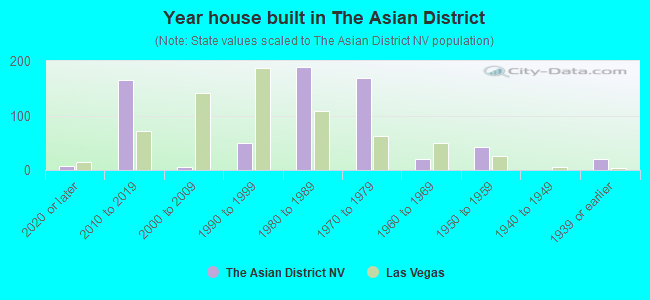
- Year house built in The Asian District
- 82020 or later
- 1652010 to 2019
- 52000 to 2009
- 501990 to 1999
- 1891980 to 1989
- 1691970 to 1979
- 211960 to 1969
- 421950 to 1959
- 01940 to 1949
- 211939 or earlier
City-data.com crime index for city in 2020 (higher means more crime):
| City: | 280.7 |
| U.S. average: | 219.5 |
Travel time to work (commute)
![Travel time to work (commute)]()
- 8Less than 5 minutes
- 1435 to 9 minutes
- 10210 to 14 minutes
- 24015 to 19 minutes
- 27420 to 24 minutes
- 6725 to 29 minutes
- 16930 to 34 minutes
- 735 to 39 minutes
- 1740 to 44 minutes
- 2145 to 59 minutes
- 4160 to 89 minutes
- 490 or more minutes

Means of transportation to work
![Means of transportation to work]()
- 56.8%273Drove a car alone
- 9.4%45Carpooled
- 13.9%67Bus
- 3.5%17Taxi
- 10.4%50Bicycle
- 11.4%55Walked
- 4.6%22Other means
- 4.4%21Worked at home

Time leaving home to go to work
![Time leaving home to go to work]()
- 5012:00 a.m. to 4:59 a.m.
- 345:00 a.m. to 5:29 a.m.
- 1055:30 a.m. to 5:59 a.m.
- 1936:00 a.m. to 6:29 a.m.
- 596:30 a.m. to 6:59 a.m.
- 707:00 a.m. to 7:29 a.m.
- 717:30 a.m. to 7:59 a.m.
- 898:00 a.m. to 8:29 a.m.
- 158:30 a.m. to 8:59 a.m.
- 709:00 a.m. to 9:59 a.m.
- 5310:00 a.m. to 10:59 a.m.
- 2611:00 a.m. to 11:59 a.m.
- 15612:00 p.m. to 3:59 p.m.
- 1034:00 p.m. to 11:59 p.m.

Occupations of males:
- Percentage of males in business and financial operations occupations:
Here: 2.9% city: 3.6%
- Percentage of males in computer and mathematical occupations:
Here: 1.5% city: 3.4%
- Percentage of males in education, training, and library occupations:
Here: 2.9% city: 2.5%
- Percentage of males in service occupations:
Here: 38.2% city: 23.3%
- Percentage of males in sales and office occupations:
Here: 2.6% city: 16.6%
- Percentage of males in farming, fishing, and forestry occupations:
Here: 3.0% city: 0.3%
- Percentage of males in construction, extraction, and maintenance occupations:
Here: 3.3% city: 10.6%
- Percentage of males in production occupations:
Here: 27.1% city: 3.3%
- Percentage of males in transportation occupations:
Here: 15.2% city: 6.6%
Occupations of females:
- Percentage of females in management occupations (except farmers):
Here: 20.5% city: 8.5%
- Percentage of females in education, training, and library occupations:
Here: 6.8% city: 8.0%
- Percentage of females in healthcare practitioners and technical occupations:
Here: 4.3% city: 7.4%
- Percentage of females in service occupations:
Here: 10.0% city: 26.5%
- Percentage of females in sales and office occupations:
Here: 58.2% city: 30.5%
- Percentage of females in material moving occupations:
Here: 6.9% city: 2.2%
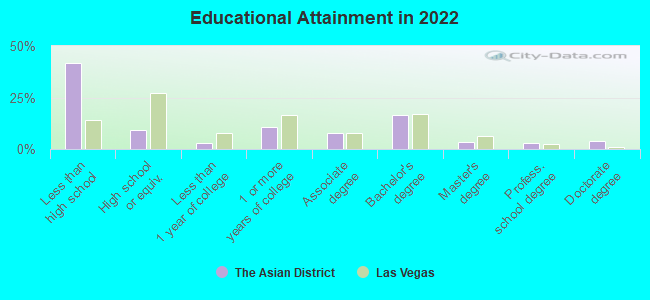
Education in this neighborhood (subdivision or community):
- Percentage of people 3 years and older in K-12 schools:
The Asian District: 28.2% Las Vegas: 17.4%
- Percentage of people 3 years and older in undergraduate colleges:
The Asian District: 5.7% Las Vegas: 4.2%
- Percentage of people 3 years and older in grad. or professional schools:
The Asian District: 5.1% Las Vegas: 1.0%
- Percentage of students K-12 enrolled in private schools:
The Asian District: 15.3% Las Vegas: 12.9%
Percentage of population below poverty level:
| The Asian District: | 31.2% |
| Las Vegas: | 14.1% |
Median year renter moved in (as recorded in 2022):
| The Asian District: | 2017 |
| Las Vegas: | 2020 |
Percentage of married-couple families with both working:
| The Asian District: | 89.8% |
| Las Vegas: | 62.0% |
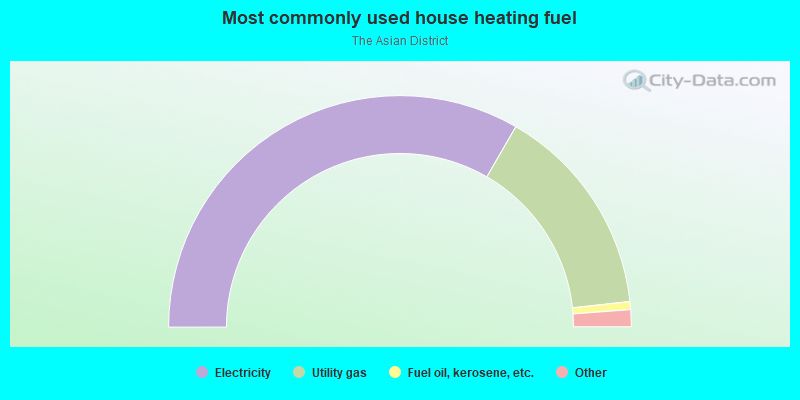
- 66.7%Electricity
- 29.8%Utility gas
- 1.1%Fuel oil, kerosene, etc.
- 0.9%Bottled, tank, or LP gas
- 0.7%Coal or coke
- 0.7%No fuel used
Roads and streets:
Spring Mountain Rd (W Spring Mountain Rd)
Length: 0.96 miles
Direction: E-W
Address range: 3800 to 4839
Direction: E-W
Address range: 3800 to 4839
Pioneer Ave
Length: 0.46 miles
Direction: E-W
Address range: 3800 to 4249
Direction: E-W
Address range: 3800 to 4249
S Valley View Blvd
Length: 0.36 miles
Direction: N-S
Address range: 3300 to 3649
Direction: N-S
Address range: 3300 to 3649
Wynn Rd (S Wynn Rd)
Length: 0.34 miles
Direction: N-S
Address range: 3300 to 3599
Direction: N-S
Address range: 3300 to 3599
Vanessa Dr
Length: 0.31 miles
Direction: E-W
Address range: 3800 to 4099
Direction: E-W
Address range: 3800 to 4099
Renate Dr
Length: 0.31 miles
Direction: E-W
Address range: 3800 to 4099
Direction: E-W
Address range: 3800 to 4099
Schiff Dr
Length: 0.24 miles
Direction: E-W
Address range: 3800 to 3965
Direction: E-W
Address range: 3800 to 3965
W Desert Inn Rd
Length: 0.15 miles
Direction: E-W
Address range: 4100 to 4255
Direction: E-W
Address range: 4100 to 4255
Schirll Ave
Length: 0.13 miles
Direction: N-S
Address range: 3300 to 3399
Direction: N-S
Address range: 3300 to 3399