Tech Terrace neighborhood in Lubbock, Texas (TX), 79410 detailed profile
Settings
X


Business Search - 14 Million verified businesses
Area: 1.022 square miles
Population: 5,104
Population density:
| Tech Terrace: | 4,993 people per square mile |
| Lubbock: | 2,299 people per square mile |

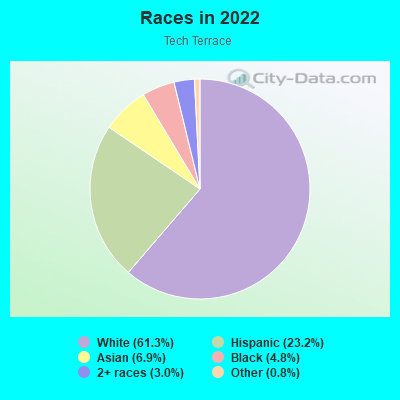
- 3,31561.3%White
- 1,25423.2%Hispanic or Latino
- 3746.9%Asian
- 2614.8%Black
- 1633.0%Two or more races
- 430.8%Some other race
Distribution of median household income
![Distribution of median household income]()
- 197Less than $10,000
- 445$10,000 to $19,999
- 508$20,000 to $29,999
- 278$30,000 to $39,999
- 281$40,000 to $49,999
- 127$50,000 to $59,999
- 125$60,000 to $74,999
- 144$75,000 to $99,999
- 103$100,000 to $124,999
- 187$125,000 to $149,999
- 195$150,000 to $199,999
- 146$200,000 or more

Distribution of owner-occupied house/condo value
![Distribution of owner-occupied house/condo value]()
- 29Less than $50,000
- 202$50,000 to $99,999
- 152$100,000 to $149,999
- 180$150,000 to $199,999
- 87$200,000 to $249,999
- 105$250,000 to $299,999
- 151$300,000 to $399,999
- 123$400,000 to $499,999
- 147$500,000 to $749,999
- 41$750,000 to $999,999
- 23$1,000,000 or more

Distribution of rent paid by renters
![Distribution of rent paid by renters]()
- 107Less than $100
- 193$200 to $299
- 101$300 to $399
- 109$400 to $499
- 186$500 to $599
- 182$600 to $699
- 136$700 to $799
- 42$800 to $899
- 67$900 to $999
- 610$1,000 to $1,249
- 260$1,250 to $1,499
- 263$1,500 to $1,999
- 132$2,000 or more

Median rent in 2022:
| Tech Terrace: | $1,119 |
| Lubbock: | $882 |
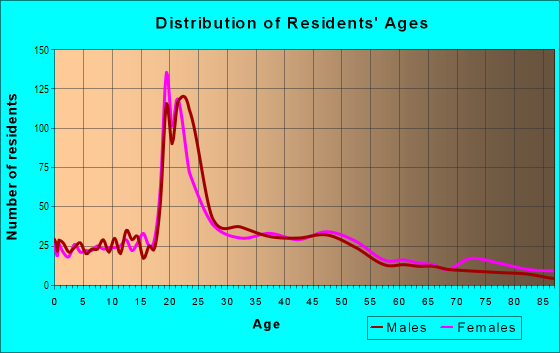
| Males: | 2,458 |
| Females: | 2,646 |
Males:
| This neighborhood: | 29.7 years |
| Whole city: | 29.4 years |
| This neighborhood: | 25.7 years |
| Whole city: | 32.2 years |
Average household size:
| Tech Terrace: | 4.9 people |
| Lubbock: | 2.3 people |
Percentage of family households:
| Tech Terrace: | 34.8% |
| Lubbock: | 44.1% |
| Here: | 28.9% |
| Lubbock: | 38.5% |
Percentage of married-couple families with children (among all households):
| Tech Terrace: | 23.1% |
| Lubbock: | 26.4% |
Percentage of single-mother households (among all households):
| Tech Terrace: | 23.3% |
| Lubbock: | 12.1% |
Percentage of never married males 15 years old and over:
Percentage of never married females 15 years old and over:
| Tech Terrace: | 23.6% |
| Lubbock: | 23.0% |
Percentage of never married females 15 years old and over:
| Tech Terrace: | 32.4% |
| city: | 19.6% |
Percentage of people that speak English not well or not at all:
| Tech Terrace: | 2.6% |
| Lubbock: | 1.7% |
Percentage of people born in this state:
Percentage of people born in another U.S. state:
Percentage of native residents but born outside the U.S.:
Percentage of foreign born residents:
| Here: | 61.3% |
| Lubbock: | 72.0% |
Percentage of people born in another U.S. state:
| Tech Terrace: | 29.2% |
| Lubbock: | 20.4% |
Percentage of native residents but born outside the U.S.:
| Here: | 0.3% |
| city: | 0.9% |
Percentage of foreign born residents:
| Here: | 9.2% |
| Lubbock: | 6.8% |
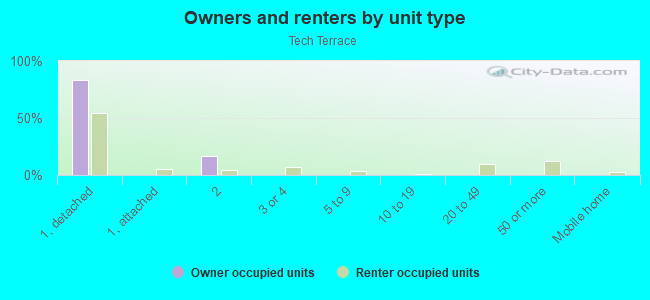
Owner-occupied
Renter-occupied

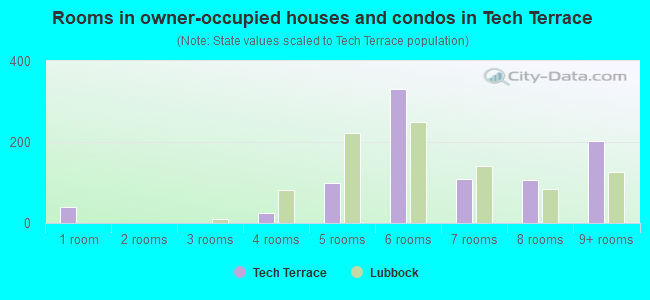
- Rooms in owner-occupied houses and condos in Tech Terrace
- 401 room
- 02 rooms
- 03 rooms
- 254 rooms
- 995 rooms
- 3326 rooms
- 1087 rooms
- 1068 rooms
- 2039+ rooms
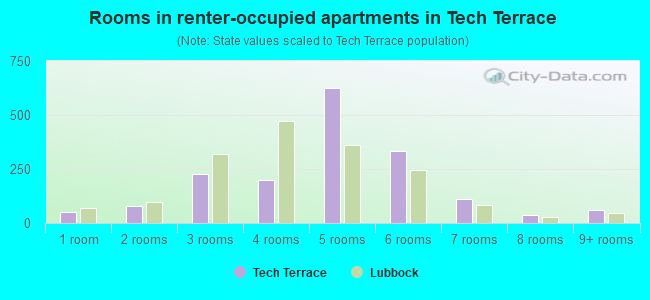
- Rooms in renter-occupied apartments in Tech Terrace
- 491 room
- 772 rooms
- 2273 rooms
- 1984 rooms
- 6235 rooms
- 3356 rooms
- 1117 rooms
- 398 rooms
- 609+ rooms
Owner-occupied
Renter-occupied
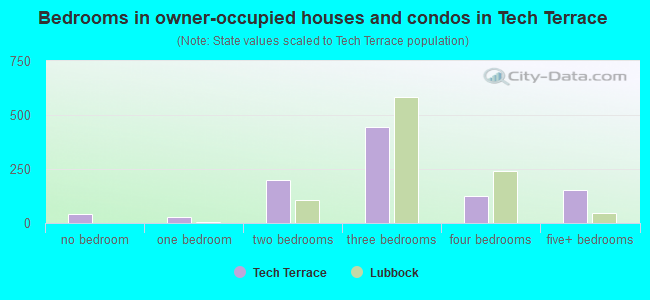
- Bedrooms in owner-occupied houses and condos in Tech Terrace
- 40no bedroom
- 281 bedroom
- 1972 bedrooms
- 4433 bedrooms
- 1234 bedrooms
- 1525+ bedrooms
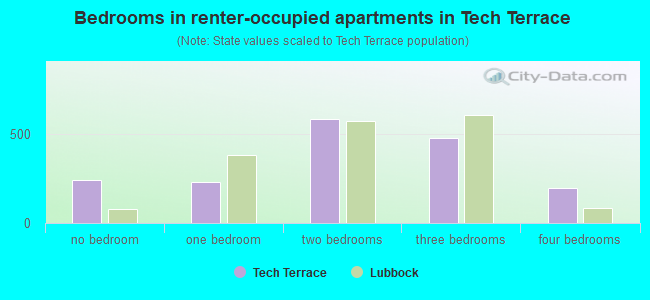
- Bedrooms in renter-occupied apartments in Tech Terrace
- 240no bedroom
- 2301 bedroom
- 5842 bedrooms
- 4763 bedrooms
- 1954 bedrooms
- 05+ bedrooms
Average number of cars or other vehicles available in houses/condos:
Average number of cars or other vehicles available in apartments:
| This neighborhood: | 1.9 |
| Lubbock: | 2.1 |
Average number of cars or other vehicles available in apartments:
| Here: | 1.6 |
| city: | 1.5 |
Percentage of units with a mortgage:
| Tech Terrace: | 64.9% |
| Lubbock: | 59.6% |
Average estimated value of detached houses in 2022 (88.4% of all units):
| Tech Terrace: | $310,095 |
| Texas: | $369,058 |
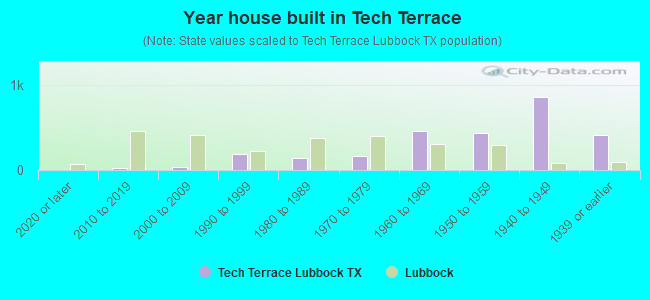
- Year house built in Tech Terrace
- 02020 or later
- 252010 to 2019
- 342000 to 2009
- 1931990 to 1999
- 1381980 to 1989
- 1691970 to 1979
- 4541960 to 1969
- 4361950 to 1959
- 8561940 to 1949
- 4181939 or earlier
City-data.com crime index for city in 2020 (higher means more crime):
| City: | 513.0 |
| U.S. average: | 219.5 |
Travel time to work (commute)
![Travel time to work (commute)]()
- 71Less than 5 minutes
- 7495 to 9 minutes
- 80910 to 14 minutes
- 49115 to 19 minutes
- 11720 to 24 minutes
- 8725 to 29 minutes
- 3530 to 34 minutes
- 5735 to 39 minutes
- 3040 to 44 minutes
- 1945 to 59 minutes
- 7060 to 89 minutes
- 1390 or more minutes

Means of transportation to work
![Means of transportation to work]()
- 72.8%1,897Drove a car alone
- 7.3%190Carpooled
- 1.5%38Bus
- 0.5%13Taxi
- 2.2%57Motorcycle
- 4.1%107Bicycle
- 9.5%248Walked
- 8.4%220Other means
- 7.6%198Worked at home

Time leaving home to go to work
![Time leaving home to go to work]()
- 5512:00 a.m. to 4:59 a.m.
- 475:00 a.m. to 5:29 a.m.
- 485:30 a.m. to 5:59 a.m.
- 706:00 a.m. to 6:29 a.m.
- 646:30 a.m. to 6:59 a.m.
- 1447:00 a.m. to 7:29 a.m.
- 5237:30 a.m. to 7:59 a.m.
- 7138:00 a.m. to 8:29 a.m.
- 1778:30 a.m. to 8:59 a.m.
- 3599:00 a.m. to 9:59 a.m.
- 8410:00 a.m. to 10:59 a.m.
- 2011:00 a.m. to 11:59 a.m.
- 21412:00 p.m. to 3:59 p.m.
- 874:00 p.m. to 11:59 p.m.

Occupations of males:
- Percentage of males in management occupations (except farmers):
Here: 11.1% city: 11.3%
- Percentage of males in business and financial operations occupations:
Here: 1.6% city: 3.9%
- Percentage of males in computer and mathematical occupations:
Here: 8.1% city: 3.1%
- Percentage of males in life, physical, and social science occupations:
Here: 3.4% city: 0.9%
- Percentage of males in community and social services occupations:
Here: 7.4% city: 1.4%
- Percentage of males in legal occupations:
Here: 2.3% city: 0.9%
- Percentage of males in education, training, and library occupations:
Here: 26.3% city: 7.0%
- Percentage of males in arts, design, entertainment, sports, and media occupations:
Here: 1.5% city: 1.3%
- Percentage of males in healthcare practitioners and technical occupations:
Here: 6.6% city: 4.3%
- Percentage of males in service occupations:
Here: 6.5% city: 14.9%
- Percentage of males in sales and office occupations:
Here: 10.1% city: 16.9%
- Percentage of males in construction, extraction, and maintenance occupations:
Here: 6.8% city: 9.4%
- Percentage of males in production occupations:
Here: 2.6% city: 6.5%
- Percentage of males in material moving occupations:
Here: 3.3% city: 4.5%
Occupations of females:
- Percentage of females in management occupations (except farmers):
Here: 12.8% city: 8.7%
- Percentage of females in architecture and engineering occupations:
Here: 2.6% city: 0.3%
- Percentage of females in community and social services occupations:
Here: 9.2% city: 3.0%
- Percentage of females in education, training, and library occupations:
Here: 34.4% city: 12.1%
- Percentage of females in healthcare practitioners and technical occupations:
Here: 3.5% city: 10.3%
- Percentage of females in service occupations:
Here: 19.4% city: 21.5%
- Percentage of females in sales and office occupations:
Here: 11.5% city: 28.9%
- Percentage of females in transportation occupations:
Here: 3.1% city: 1.1%
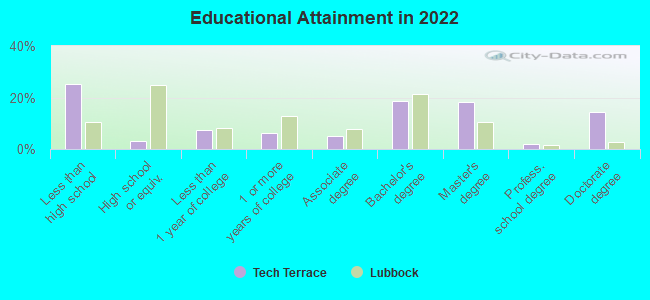
Education in this neighborhood (subdivision or community):
- Percentage of people 3 years and older in K-12 schools:
Tech Terrace: 24.3% Lubbock: 16.4%
- Percentage of people 3 years and older in undergraduate colleges:
Tech Terrace: 23.1% Lubbock: 12.1%
- Percentage of people 3 years and older in grad. or professional schools:
Tech Terrace: 22.2% Lubbock: 3.1%
- Percentage of students K-12 enrolled in private schools:
Tech Terrace: 32.0% Lubbock: 10.0%
Percentage of population below poverty level:
| Tech Terrace: | 29.3% |
| Lubbock: | 19.3% |
Median year owner moved in (as recorded in 2022):
Median year renter moved in (as recorded in 2022):
| Tech Terrace: | 2002 |
| Lubbock: | 2013 |
Median year renter moved in (as recorded in 2022):
| Tech Terrace: | 2016 |
| Lubbock: | 2022 |
Percentage of married-couple families with both working:
| Tech Terrace: | 81.0% |
| Lubbock: | 80.0% |
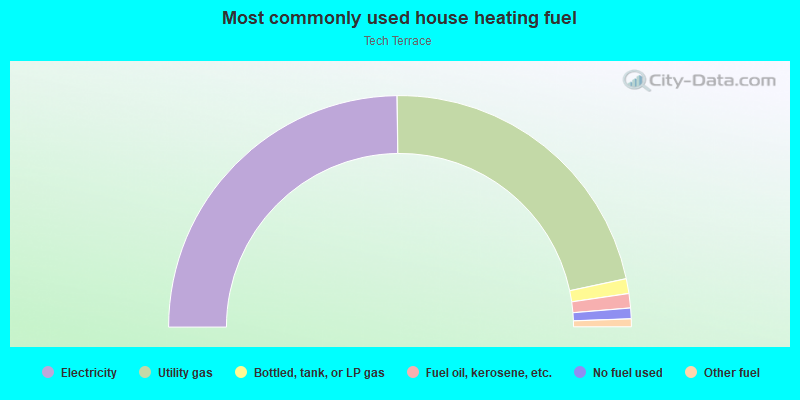
- 49.6%Electricity
- 43.7%Utility gas
- 2.1%Bottled, tank, or LP gas
- 2.0%Fuel oil, kerosene, etc.
- 1.5%No fuel used
- 1.1%Other fuel
Highways in this neighborhood:
State Hwy 114 (19th St, US Hwy 62)
Length: 0.82 miles
Direction: E-W
Address range: 2801 to 3399
Direction: E-W
Address range: 2801 to 3399
Roads and streets:
University Ave
Length: 2.00 miles
Directions: N-S, SE-NW
Directions: N-S, SE-NW
26th St
Length: 1.20 miles
Directions: E-W, SW-NE
Address range: 2500 to 3399
Directions: E-W, SW-NE
Address range: 2500 to 3399
22nd St
Length: 1.19 miles
Direction: E-W
Address range: 2512 to 3399
Direction: E-W
Address range: 2512 to 3399
32nd St
Length: 1.19 miles
Direction: E-W
Address range: 2512 to 3399
Direction: E-W
Address range: 2512 to 3399
25th St
Length: 1.18 miles
Direction: E-W
Address range: 2500 to 3399
Direction: E-W
Address range: 2500 to 3399
33rd St
Length: 1.18 miles
Direction: E-W
Address range: 2500 to 3399
Direction: E-W
Address range: 2500 to 3399
23rd St
Length: 1.18 miles
Directions: E-W, SW-NE
Address range: 2500 to 3399
Directions: E-W, SW-NE
Address range: 2500 to 3399
21st St
Length: 1.18 miles
Direction: E-W
Address range: 2500 to 3399
Direction: E-W
Address range: 2500 to 3399
20th St
Length: 1.18 miles
Direction: E-W
Address range: 2500 to 3399
Direction: E-W
Address range: 2500 to 3399
31st St
Length: 1.18 miles
Direction: E-W
Address range: 2500 to 3399
Direction: E-W
Address range: 2500 to 3399
29th St
Length: 1.16 miles
Directions: E-W, SE-NW
Address range: 2500 to 3399
Directions: E-W, SE-NW
Address range: 2500 to 3399
28th St
Length: 1.14 miles
Directions: E-W, SE-NW
Address range: 2500 to 3399
Directions: E-W, SE-NW
Address range: 2500 to 3399
30th St
Length: 1.08 miles
Direction: E-W
Address range: 2500 to 3399
Direction: E-W
Address range: 2500 to 3399
27th St
Length: 1.00 miles
Directions: E-W, SE-NW
Address range: 2500 to 3399
Directions: E-W, SE-NW
Address range: 2500 to 3399
Canton Ave
Length: 0.99 miles
Directions: E-W, N-S, SE-NW, SW-NE
Address range: 1900 to 3299
Directions: E-W, N-S, SE-NW, SW-NE
Address range: 1900 to 3299
24th St
Length: 0.94 miles
Direction: E-W
Address range: 2500 to 3399
Direction: E-W
Address range: 2500 to 3399
Indiana Ave
Length: 0.94 miles
Directions: N-S, SE-NW
Address range: 2147 to 3299
Directions: N-S, SE-NW
Address range: 2147 to 3299
Elgin Ave
Length: 0.94 miles
Directions: N-S, SE-NW
Address range: 1900 to 3299
Directions: N-S, SE-NW
Address range: 1900 to 3299
Flint Ave
Length: 0.93 miles
Direction: N-S
Address range: 1900 to 3299
Direction: N-S
Address range: 1900 to 3299
Akron Ave
Length: 0.92 miles
Direction: N-S
Address range: 2000 to 3399
Direction: N-S
Address range: 2000 to 3399
Boston Ave
Length: 0.85 miles
Direction: N-S
Address range: 2000 to 3299
Direction: N-S
Address range: 2000 to 3299
Gary Ave
Length: 0.77 miles
Direction: N-S
Address range: 1900 to 3299
Direction: N-S
Address range: 1900 to 3299
Hartford Ave
Length: 0.73 miles
Direction: N-S
Address range: 1900 to 3299
Direction: N-S
Address range: 1900 to 3299
Geneva Ave
Length: 0.42 miles
Directions: N-S, SE-NW, SW-NE
Address range: 2300 to 2999
Directions: N-S, SE-NW, SW-NE
Address range: 2300 to 2999
Detroit Ave
Length: 0.16 miles
Direction: N-S
Address range: 1900 to 2099
Direction: N-S
Address range: 1900 to 2099