Tatra neighborhood in San Jose, California (CA), 95136 detailed profile
Settings
X

Business Search - 14 Million verified businesses
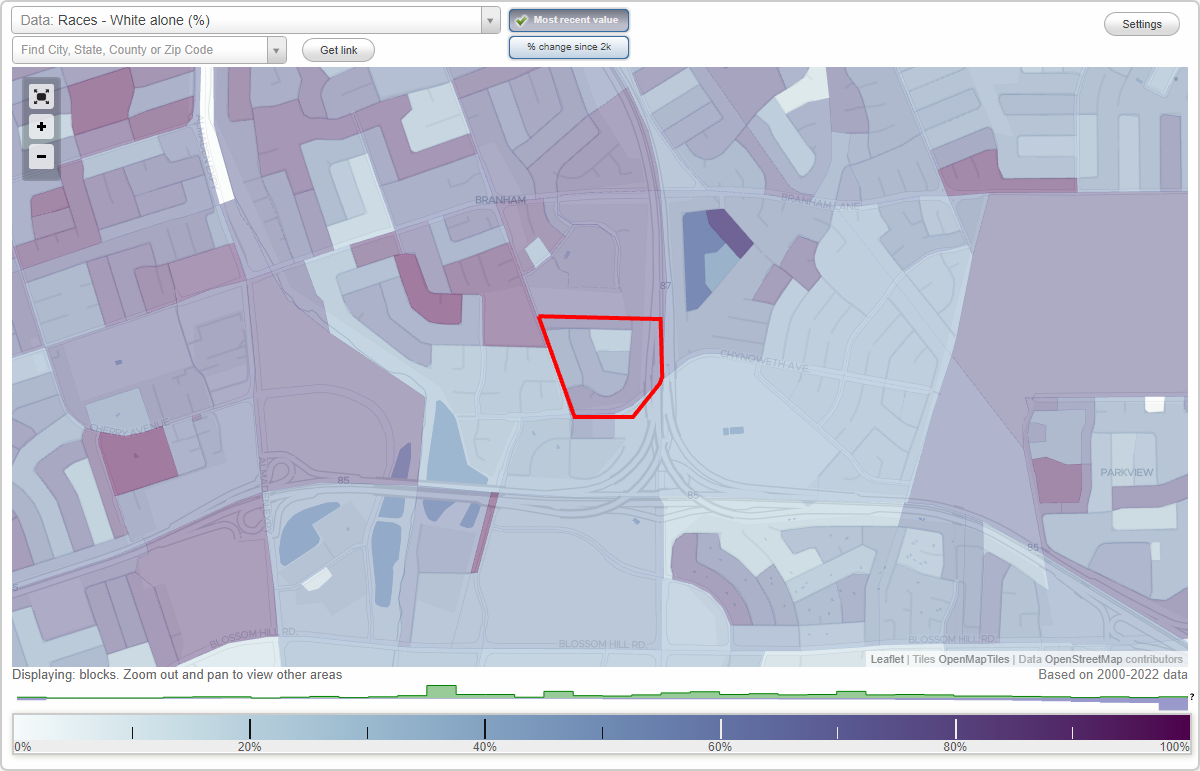
Area: 0.055 square miles
Population: 246
Population density:
| Tatra: | 4,472 people per square mile |
| San Jose: | 5,554 people per square mile |

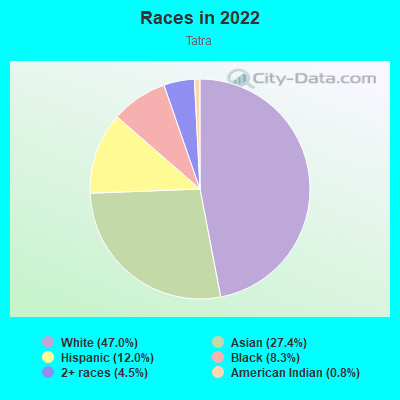
- 12547.0%White
- 7327.4%Asian
- 3212.0%Hispanic or Latino
- 228.3%Black
- 124.5%Two or more races
- 20.8%American Indian
Median household income in 2022:
| Tatra: | $136,824 |
| San Jose: | $133,835 |
Distribution of median household income
![Distribution of median household income]()
- 1Less than $10,000
- 7$10,000 to $19,999
- 6$20,000 to $29,999
- 6$30,000 to $39,999
- 4$40,000 to $49,999
- 8$50,000 to $59,999
- 3$60,000 to $74,999
- 4$75,000 to $99,999
- 4$100,000 to $124,999
- 21$125,000 to $149,999
- 4$150,000 to $199,999
- 29$200,000 or more

Distribution of owner-occupied house/condo value
![Distribution of owner-occupied house/condo value]()
- 2Less than $50,000
- 3$300,000 to $399,999
- 4$400,000 to $499,999
- 2$500,000 to $749,999
- 3$750,000 to $999,999
- 49$1,000,000 or more

Distribution of rent paid by renters
![Distribution of rent paid by renters]()
- 4$500 to $599
- 9$600 to $699
- 3$800 to $899
- 1$900 to $999
- 13$1,000 to $1,249
- 14$1,250 to $1,499
- 3$1,500 to $1,999
- 44$2,000 or more

Median rent in 2022:
| Tatra: | $3,501 |
| San Jose: | $2,001 |
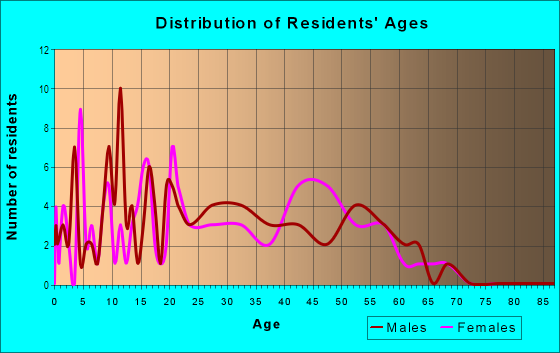
| Males: | 119 |
| Females: | 126 |
Males:
| This neighborhood: | 45.0 years |
| Whole city: | 37.6 years |
| This neighborhood: | 51.6 years |
| Whole city: | 39.1 years |
Average household size:
| Tatra: | 2.9 people |
| San Jose: | 2.9 people |
Percentage of family households:
| Tatra: | 51.6% |
| San Jose: | 49.9% |
| Here: | 73.4% |
| San Jose: | 53.0% |
Percentage of married-couple families with children (among all households):
| Tatra: | 34.0% |
| San Jose: | 25.8% |
Percentage of single-mother households (among all households):
| Tatra: | 2.8% |
| San Jose: | 5.2% |
Percentage of never married males 15 years old and over:
Percentage of never married females 15 years old and over:
| Tatra: | 8.1% |
| San Jose: | 20.9% |
Percentage of never married females 15 years old and over:
| Tatra: | 8.0% |
| city: | 16.7% |
Percentage of people that speak English not well or not at all:
| Tatra: | 10.8% |
| San Jose: | 11.4% |
Percentage of people born in this state:
Percentage of people born in another U.S. state:
Percentage of native residents but born outside the U.S.:
Percentage of foreign born residents:
| Here: | 45.3% |
| San Jose: | 46.1% |
Percentage of people born in another U.S. state:
| Tatra: | 13.6% |
| San Jose: | 10.4% |
Percentage of native residents but born outside the U.S.:
| Here: | 1.5% |
| city: | 1.7% |
Percentage of foreign born residents:
| Here: | 39.6% |
| San Jose: | 41.8% |
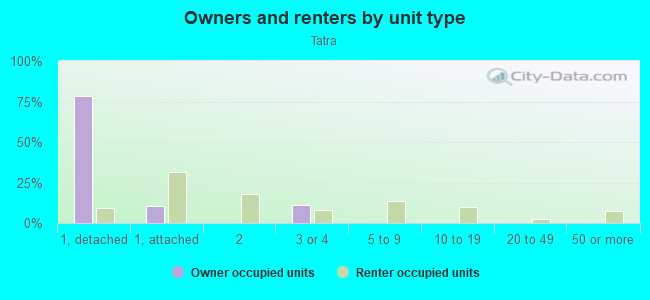
Owner-occupied
Renter-occupied

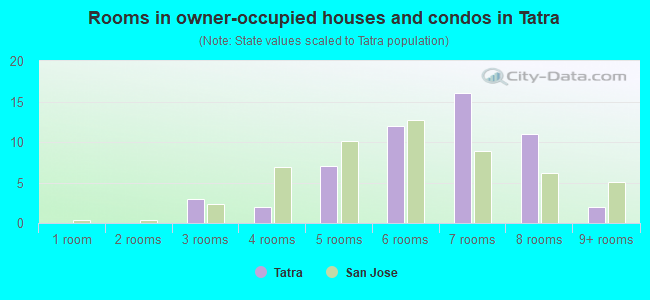
- Rooms in owner-occupied houses and condos in Tatra
- 01 room
- 02 rooms
- 33 rooms
- 24 rooms
- 75 rooms
- 126 rooms
- 167 rooms
- 118 rooms
- 29+ rooms
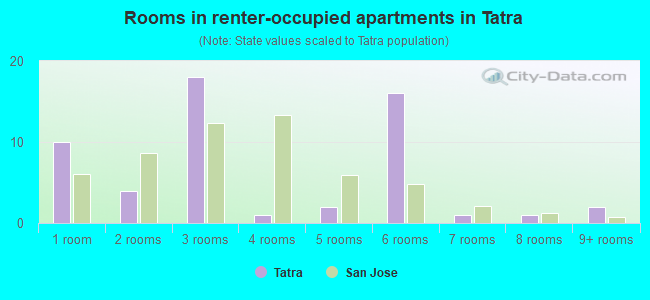
- Rooms in renter-occupied apartments in Tatra
- 101 room
- 42 rooms
- 183 rooms
- 14 rooms
- 25 rooms
- 166 rooms
- 17 rooms
- 18 rooms
- 29+ rooms
Owner-occupied
Renter-occupied
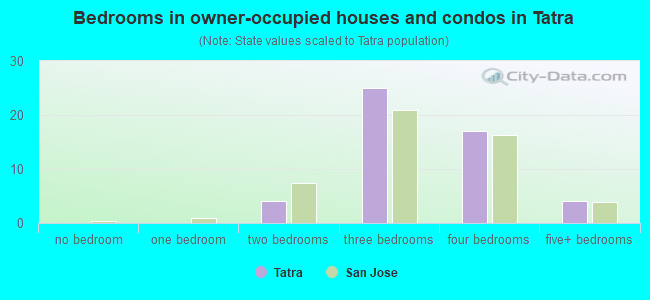
- Bedrooms in owner-occupied houses and condos in Tatra
- 0no bedroom
- 01 bedroom
- 42 bedrooms
- 253 bedrooms
- 174 bedrooms
- 45+ bedrooms
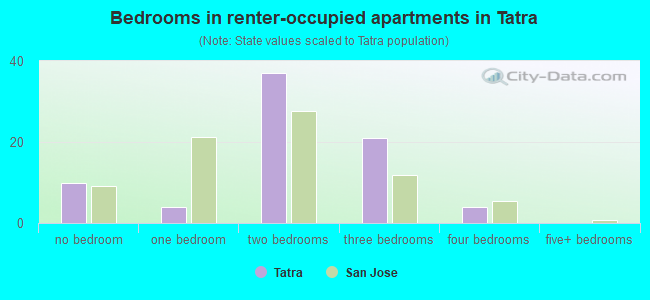
- Bedrooms in renter-occupied apartments in Tatra
- 10no bedroom
- 41 bedroom
- 372 bedrooms
- 213 bedrooms
- 44 bedrooms
- 05+ bedrooms
Average number of cars or other vehicles available in houses/condos:
Average number of cars or other vehicles available in apartments:
| This neighborhood: | 2.1 |
| San Jose: | 2.3 |
Average number of cars or other vehicles available in apartments:
| Here: | 1.8 |
| city: | 1.6 |
Percentage of units with a mortgage:
| Tatra: | 76.9% |
| San Jose: | 66.9% |
Housing prices:
- Average estimated value of detached houses in 2022 (57.8% of all units):
Tatra: $1,363,335 San Jose: $1,532,815
- Average estimated value of townhouses or other attached units in 2022 (27.8% of all units):
This neighborhood: $1,137,732 city: $1,024,857
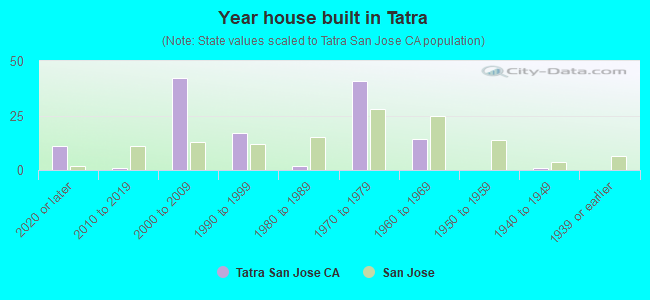
- Year house built in Tatra
- 112020 or later
- 12010 to 2019
- 422000 to 2009
- 171990 to 1999
- 21980 to 1989
- 411970 to 1979
- 141960 to 1969
- 01950 to 1959
- 11940 to 1949
- 01939 or earlier
City-data.com crime index for city in 2020 (higher means more crime):
| City: | 268.4 |
| U.S. average: | 219.5 |
Travel time to work (commute)
![Travel time to work (commute)]()
- 5Less than 5 minutes
- 55 to 9 minutes
- 1610 to 14 minutes
- 8315 to 19 minutes
- 6920 to 24 minutes
- 1125 to 29 minutes
- 4030 to 34 minutes
- 1135 to 39 minutes
- 1340 to 44 minutes
- 960 to 89 minutes
- 1290 or more minutes

Means of transportation to work
![Means of transportation to work]()
- 79.9%89Drove a car alone
- 2.7%3Carpooled
- 5.4%6Bus
- 5.4%6Long-distance train or commuter rail
- 0.9%1Light rail, streetcar or trolley
- 10.8%12Walked
- 13.5%15Worked at home

Time leaving home to go to work
![Time leaving home to go to work]()
- 1112:00 a.m. to 4:59 a.m.
- 55:00 a.m. to 5:29 a.m.
- 205:30 a.m. to 5:59 a.m.
- 16:00 a.m. to 6:29 a.m.
- 206:30 a.m. to 6:59 a.m.
- 397:00 a.m. to 7:29 a.m.
- 477:30 a.m. to 7:59 a.m.
- 368:00 a.m. to 8:29 a.m.
- 128:30 a.m. to 8:59 a.m.
- 539:00 a.m. to 9:59 a.m.
- 3310:00 a.m. to 10:59 a.m.
- 211:00 a.m. to 11:59 a.m.
- 1112:00 p.m. to 3:59 p.m.
- 64:00 p.m. to 11:59 p.m.

Occupations of males:
- Percentage of males in management occupations (except farmers):
Here: 42.3% city: 13.0%
- Percentage of males in business and financial operations occupations:
Here: 5.1% city: 4.6%
- Percentage of males in computer and mathematical occupations:
Here: 6.2% city: 13.6%
- Percentage of males in architecture and engineering occupations:
Here: 16.1% city: 10.2%
- Percentage of males in life, physical, and social science occupations:
Here: 3.4% city: 1.1%
- Percentage of males in education, training, and library occupations:
Here: 7.1% city: 2.8%
- Percentage of males in arts, design, entertainment, sports, and media occupations:
Here: 2.2% city: 1.8%
- Percentage of males in healthcare practitioners and technical occupations:
Here: 4.0% city: 2.0%
- Percentage of males in service occupations:
Here: 18.2% city: 12.7%
- Percentage of males in sales and office occupations:
Here: 1.5% city: 12.8%
- Percentage of males in construction, extraction, and maintenance occupations:
Here: 34.2% city: 7.8%
- Percentage of males in production occupations:
Here: 4.4% city: 5.5%
- Percentage of males in transportation occupations:
Here: 15.0% city: 3.6%
- Percentage of males in material moving occupations:
Here: 4.0% city: 3.1%
Occupations of females:
- Percentage of females in management occupations (except farmers):
Here: 9.4% city: 11.0%
- Percentage of females in business and financial operations occupations:
Here: 5.4% city: 8.6%
- Percentage of females in computer and mathematical occupations:
Here: 10.6% city: 5.4%
- Percentage of females in architecture and engineering occupations:
Here: 3.3% city: 2.8%
- Percentage of females in life, physical, and social science occupations:
Here: 6.8% city: 1.7%
- Percentage of females in community and social services occupations:
Here: 6.6% city: 1.8%
- Percentage of females in legal occupations:
Here: 1.8% city: 1.3%
- Percentage of females in education, training, and library occupations:
Here: 7.7% city: 8.1%
- Percentage of females in arts, design, entertainment, sports, and media occupations:
Here: 5.4% city: 2.0%
- Percentage of females in healthcare practitioners and technical occupations:
Here: 8.0% city: 6.8%
- Percentage of females in service occupations:
Here: 8.2% city: 21.7%
- Percentage of females in sales and office occupations:
Here: 44.3% city: 22.0%
- Percentage of females in transportation occupations:
Here: 4.8% city: 0.7%
- Percentage of females in material moving occupations:
Here: 9.9% city: 1.5%
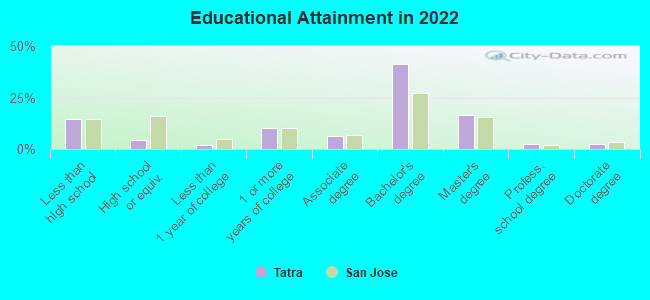
Education in this neighborhood (subdivision or community):
- Percentage of people 3 years and older in K-12 schools:
Tatra: 19.9% San Jose: 16.1%
- Percentage of people 3 years and older in undergraduate colleges:
Tatra: 2.1% San Jose: 6.5%
- Percentage of people 3 years and older in grad. or professional schools:
Tatra: 1.2% San Jose: 2.0%
- Percentage of students K-12 enrolled in private schools:
Tatra: 29.2% San Jose: 14.9%
Percentage of population below poverty level:
| Tatra: | 9.9% |
| San Jose: | 9.0% |
Median year owner moved in (as recorded in 2022):
Median year renter moved in (as recorded in 2022):
| Tatra: | 2008 |
| San Jose: | 2008 |
Median year renter moved in (as recorded in 2022):
| Tatra: | 2020 |
| San Jose: | 2020 |
Percentage of married-couple families with both working:
| Tatra: | 71.7% |
| San Jose: | 72.5% |
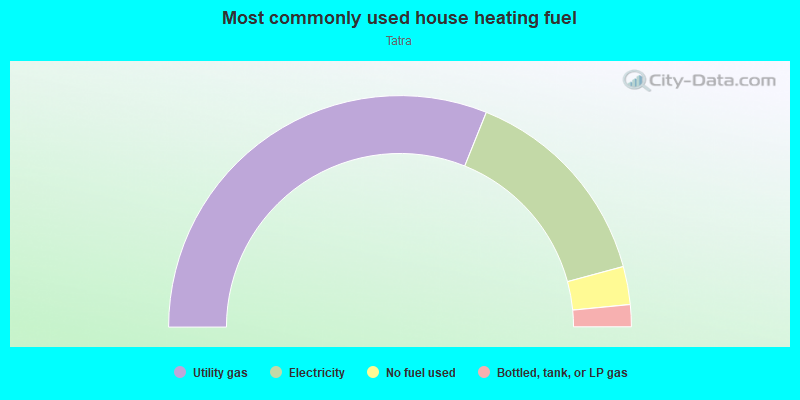
- 62.2%Utility gas
- 29.4%Electricity
- 5.3%No fuel used
- 3.1%Bottled, tank, or LP gas
Limited-access highways (interstate or state) in this neighborhood:
State Hwy 87 (Guadalupe Fwy)
Length: 0.07 miles
Direction: N-S
Direction: N-S
Roads and streets:
Severance Dr
Length: 0.26 miles
Directions: E-W, N-S, SE-NW, SW-NE
Address range: 4978 to 5159
Directions: E-W, N-S, SE-NW, SW-NE
Address range: 4978 to 5159
Chynoweth Ave
Length: 0.26 miles
Directions: E-W, N-S, SW-NE
Directions: E-W, N-S, SW-NE
Kozera Dr
Length: 0.19 miles
Direction: E-W
Address range: 800 to 868
Direction: E-W
Address range: 800 to 868
Tatra Dr
Length: 0.18 miles
Directions: E-W, N-S, SE-NW
Address range: 5000 to 5099
Directions: E-W, N-S, SE-NW
Address range: 5000 to 5099
New Trier Ave
Length: 0.13 miles
Directions: N-S, SE-NW
Address range: 5000 to 5099
Directions: N-S, SE-NW
Address range: 5000 to 5099
Tatra Ct
Length: 0.04 miles
Direction: E-W
Address range: 800 to 899
Direction: E-W
Address range: 800 to 899
Severance Ct
Length: 0.02 miles
Direction: SW-NE
Address range: 5100 to 5199
Direction: SW-NE
Address range: 5100 to 5199