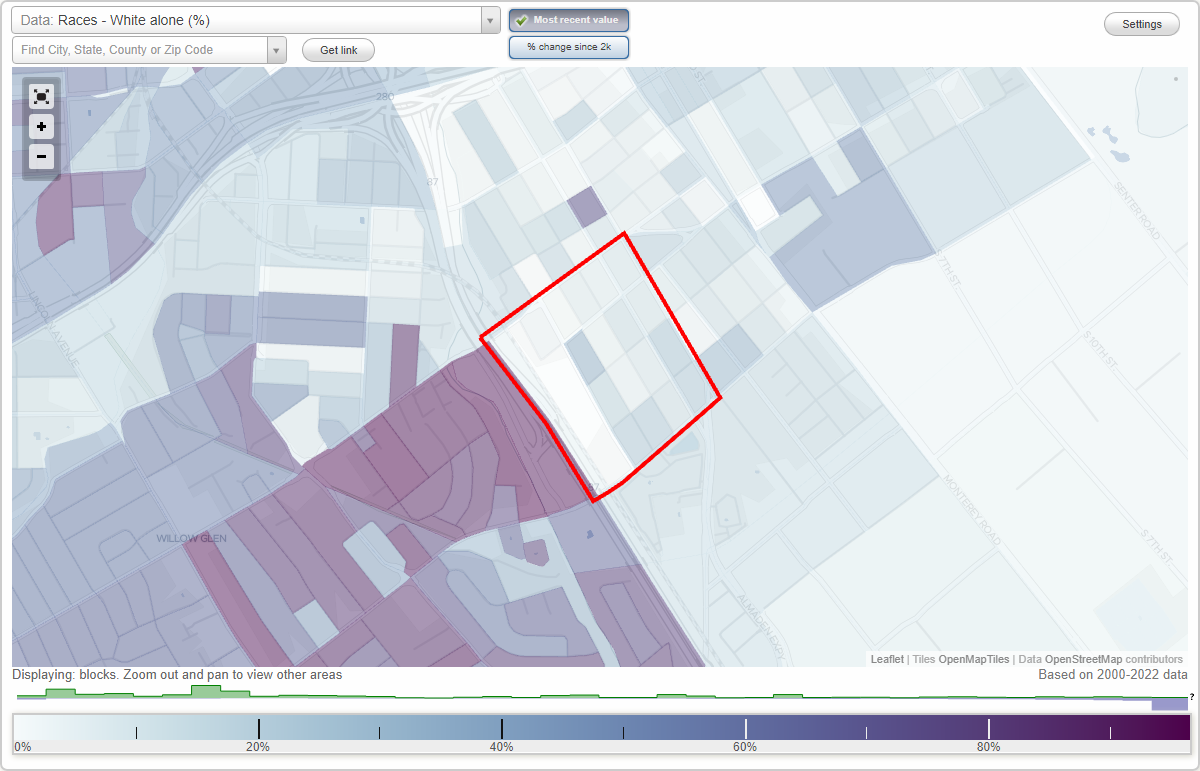
Tamien neighborhood in San Jose, California (CA), 95110 detailed profile
Settings
X

Business Search - 14 Million verified businesses
Area: 0.183 square miles
Population: 2,351
Population density:
| Tamien: | 12,841 people per square mile |
| San Jose: | 5,554 people per square mile |

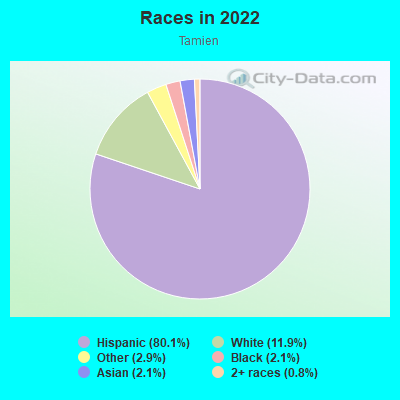
- 1,97980.1%Hispanic or Latino
- 29411.9%White
- 722.9%Some other race
- 532.1%Black
- 532.1%Asian
- 200.8%Two or more races
Median household income in 2022:
| Tamien: | $119,016 |
| San Jose: | $133,835 |
Distribution of median household income
![Distribution of median household income]()
- 9Less than $10,000
- 55$10,000 to $19,999
- 54$20,000 to $29,999
- 114$30,000 to $39,999
- 50$40,000 to $49,999
- 40$50,000 to $59,999
- 38$60,000 to $74,999
- 83$75,000 to $99,999
- 95$100,000 to $124,999
- 18$125,000 to $149,999
- 74$150,000 to $199,999
- 106$200,000 or more

Distribution of owner-occupied house/condo value
![Distribution of owner-occupied house/condo value]()
- 27Less than $50,000
- 5$50,000 to $99,999
- 6$150,000 to $199,999
- 44$250,000 to $299,999
- 14$300,000 to $399,999
- 2$400,000 to $499,999
- 81$500,000 to $749,999
- 77$750,000 to $999,999
- 189$1,000,000 or more

Distribution of rent paid by renters
![Distribution of rent paid by renters]()
- 2$300 to $399
- 6$500 to $599
- 23$700 to $799
- 5$900 to $999
- 22$1,000 to $1,249
- 54$1,250 to $1,499
- 123$1,500 to $1,999
- 193$2,000 or more

Median rent in 2022:
| Tamien: | $2,000 |
| San Jose: | $2,001 |
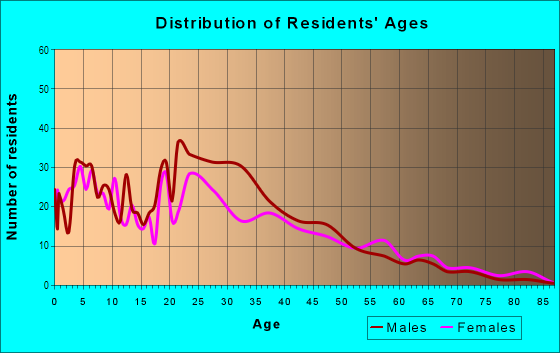
| Males: | 1,206 |
| Females: | 1,145 |
Males:
| This neighborhood: | 33.6 years |
| Whole city: | 37.6 years |
| This neighborhood: | 33.4 years |
| Whole city: | 39.1 years |
Average household size:
| Tamien: | 3.4 people |
| San Jose: | 2.9 people |
Percentage of family households:
| Tamien: | 70.7% |
| San Jose: | 49.9% |
| Here: | 55.2% |
| San Jose: | 53.0% |
Percentage of married-couple families with children (among all households):
| Tamien: | 14.1% |
| San Jose: | 25.8% |
Percentage of single-mother households (among all households):
| Tamien: | 3.8% |
| San Jose: | 5.2% |
Percentage of never married males 15 years old and over:
Percentage of never married females 15 years old and over:
| Tamien: | 26.6% |
| San Jose: | 20.9% |
Percentage of never married females 15 years old and over:
| Tamien: | 24.3% |
| city: | 16.7% |
Percentage of people that speak English not well or not at all:
| Tamien: | 24.9% |
| San Jose: | 11.4% |
Percentage of people born in this state:
Percentage of people born in another U.S. state:
Percentage of native residents but born outside the U.S.:
Percentage of foreign born residents:
| Here: | 51.4% |
| San Jose: | 46.1% |
Percentage of people born in another U.S. state:
| Tamien: | 9.3% |
| San Jose: | 10.4% |
Percentage of native residents but born outside the U.S.:
| Here: | 0.4% |
| city: | 1.7% |
Percentage of foreign born residents:
| Here: | 38.9% |
| San Jose: | 41.8% |
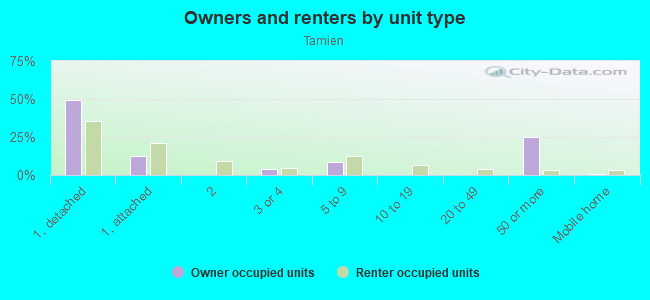
Owner-occupied
Renter-occupied

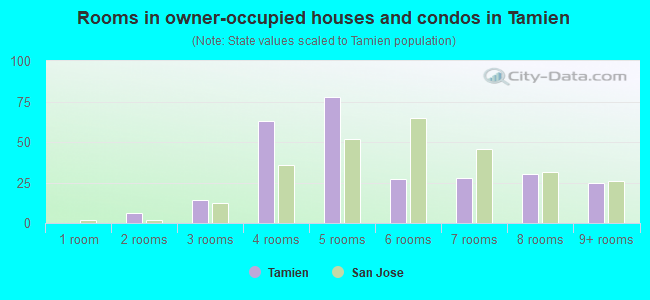
- Rooms in owner-occupied houses and condos in Tamien
- 01 room
- 62 rooms
- 143 rooms
- 634 rooms
- 785 rooms
- 276 rooms
- 287 rooms
- 308 rooms
- 259+ rooms
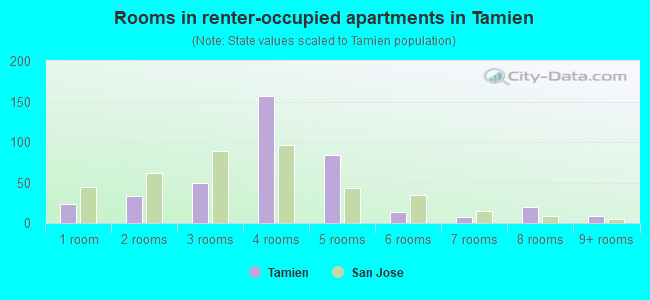
- Rooms in renter-occupied apartments in Tamien
- 231 room
- 332 rooms
- 493 rooms
- 1574 rooms
- 845 rooms
- 146 rooms
- 77 rooms
- 208 rooms
- 99+ rooms
Owner-occupied
Renter-occupied
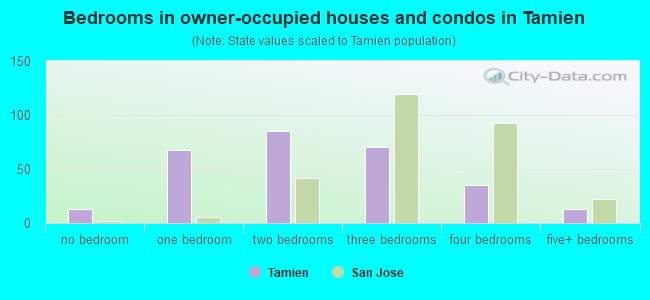
- Bedrooms in owner-occupied houses and condos in Tamien
- 13no bedroom
- 681 bedroom
- 852 bedrooms
- 703 bedrooms
- 354 bedrooms
- 135+ bedrooms
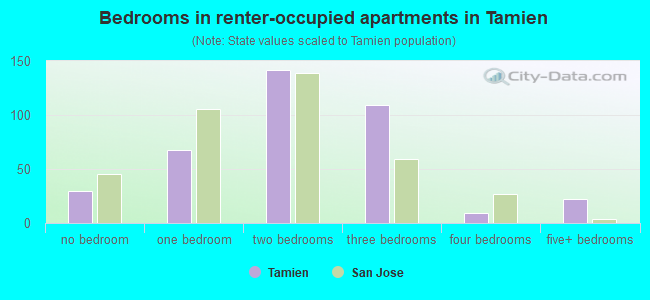
- Bedrooms in renter-occupied apartments in Tamien
- 30no bedroom
- 681 bedroom
- 1422 bedrooms
- 1093 bedrooms
- 94 bedrooms
- 225+ bedrooms
Average number of cars or other vehicles available in houses/condos:
Average number of cars or other vehicles available in apartments:
| This neighborhood: | 2.2 |
| San Jose: | 2.3 |
Average number of cars or other vehicles available in apartments:
| Here: | 2.1 |
| city: | 1.6 |
Percentage of units with a mortgage:
| Tamien: | 74.7% |
| San Jose: | 66.9% |
Housing prices:
- Average estimated value of detached houses in 2022 (55.8% of all units):
Tamien: $780,941 San Jose: $1,532,815
- Average estimated value of townhouses or other attached units in 2022 (20.7% of all units):
This neighborhood: $291,047 city: $1,024,857
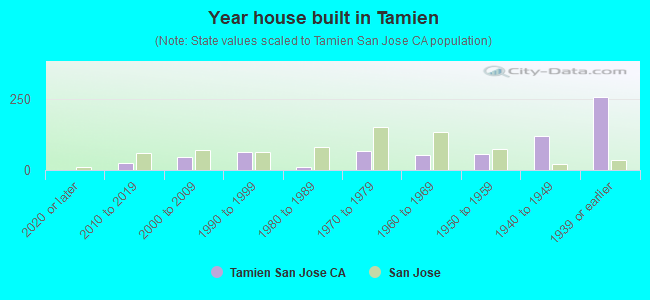
- Year house built in Tamien
- 02020 or later
- 242010 to 2019
- 452000 to 2009
- 641990 to 1999
- 121980 to 1989
- 671970 to 1979
- 511960 to 1969
- 551950 to 1959
- 1201940 to 1949
- 2551939 or earlier
City-data.com crime index for city in 2020 (higher means more crime):
| City: | 268.4 |
| U.S. average: | 219.5 |
Travel time to work (commute)
![Travel time to work (commute)]()
- 7Less than 5 minutes
- 405 to 9 minutes
- 24610 to 14 minutes
- 21615 to 19 minutes
- 17120 to 24 minutes
- 2925 to 29 minutes
- 15130 to 34 minutes
- 3535 to 39 minutes
- 3040 to 44 minutes
- 1845 to 59 minutes
- 3660 to 89 minutes
- 4290 or more minutes

Means of transportation to work
![Means of transportation to work]()
- 64.7%707Drove a car alone
- 18.4%201Carpooled
- 6.5%71Bus
- 0.7%8Subway or elevated rail
- 2.9%32Long-distance train or commuter rail
- 1.7%19Light rail, streetcar or trolley
- 4.0%44Bicycle
- 2.4%26Walked
- 2.0%22Other means
- 18.2%199Worked at home

Time leaving home to go to work
![Time leaving home to go to work]()
- 2712:00 a.m. to 4:59 a.m.
- 455:00 a.m. to 5:29 a.m.
- 535:30 a.m. to 5:59 a.m.
- 1256:00 a.m. to 6:29 a.m.
- 1496:30 a.m. to 6:59 a.m.
- 877:00 a.m. to 7:29 a.m.
- 817:30 a.m. to 7:59 a.m.
- 1968:00 a.m. to 8:29 a.m.
- 678:30 a.m. to 8:59 a.m.
- 799:00 a.m. to 9:59 a.m.
- 1910:00 a.m. to 10:59 a.m.
- 1611:00 a.m. to 11:59 a.m.
- 7012:00 p.m. to 3:59 p.m.
- 604:00 p.m. to 11:59 p.m.

Occupations of males:
- Percentage of males in management occupations (except farmers):
Here: 11.1% city: 13.0%
- Percentage of males in business and financial operations occupations:
Here: 1.3% city: 4.6%
- Percentage of males in computer and mathematical occupations:
Here: 3.2% city: 13.6%
- Percentage of males in community and social services occupations:
Here: 2.6% city: 0.8%
- Percentage of males in legal occupations:
Here: 1.5% city: 0.8%
- Percentage of males in education, training, and library occupations:
Here: 1.1% city: 2.8%
- Percentage of males in service occupations:
Here: 13.5% city: 12.7%
- Percentage of males in sales and office occupations:
Here: 11.7% city: 12.8%
- Percentage of males in farming, fishing, and forestry occupations:
Here: 1.5% city: 0.4%
- Percentage of males in construction, extraction, and maintenance occupations:
Here: 34.9% city: 7.8%
- Percentage of males in production occupations:
Here: 4.6% city: 5.5%
- Percentage of males in material moving occupations:
Here: 7.5% city: 3.1%
Occupations of females:
- Percentage of females in management occupations (except farmers):
Here: 13.8% city: 11.0%
- Percentage of females in computer and mathematical occupations:
Here: 5.2% city: 5.4%
- Percentage of females in community and social services occupations:
Here: 1.2% city: 1.8%
- Percentage of females in education, training, and library occupations:
Here: 4.0% city: 8.1%
- Percentage of females in healthcare practitioners and technical occupations:
Here: 1.2% city: 6.8%
- Percentage of females in service occupations:
Here: 38.4% city: 21.7%
- Percentage of females in sales and office occupations:
Here: 28.3% city: 22.0%
- Percentage of females in production occupations:
Here: 1.8% city: 4.0%
- Percentage of females in material moving occupations:
Here: 3.3% city: 1.5%
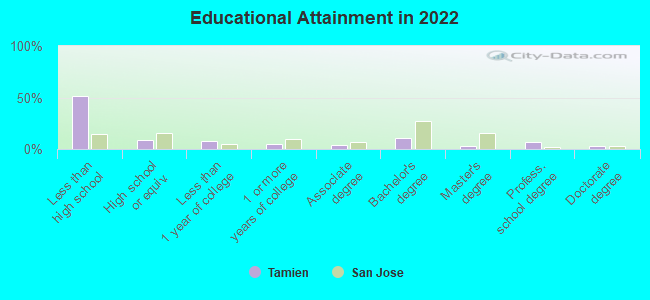
Education in this neighborhood (subdivision or community):
- Percentage of people 3 years and older in K-12 schools:
Tamien: 24.3% San Jose: 16.1%
- Percentage of people 3 years and older in undergraduate colleges:
Tamien: 5.4% San Jose: 6.5%
- Percentage of people 3 years and older in grad. or professional schools:
Tamien: 2.8% San Jose: 2.0%
- Percentage of students K-12 enrolled in private schools:
Tamien: 18.7% San Jose: 14.9%
Percentage of population below poverty level:
| Tamien: | 9.9% |
| San Jose: | 9.0% |
Median year owner moved in (as recorded in 2022):
Median year renter moved in (as recorded in 2022):
| Tamien: | 2007 |
| San Jose: | 2008 |
Median year renter moved in (as recorded in 2022):
| Tamien: | 2014 |
| San Jose: | 2020 |
Percentage of married-couple families with both working:
| Tamien: | 57.6% |
| San Jose: | 72.5% |
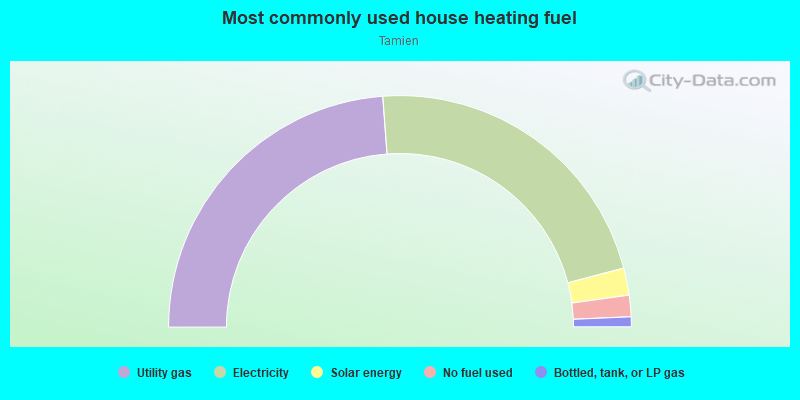
- 47.7%Utility gas
- 44.2%Electricity
- 3.8%Solar energy
- 3.0%No fuel used
- 1.4%Bottled, tank, or LP gas
Roads and streets:
Palm St
Length: 0.49 miles
Directions: N-S, SE-NW, SW-NE
Address range: 1000 to 1399
Directions: N-S, SE-NW, SW-NE
Address range: 1000 to 1399
Locust St
Length: 0.48 miles
Directions: E-W, N-S, SE-NW
Address range: 1000 to 1399
Directions: E-W, N-S, SE-NW
Address range: 1000 to 1399
W Alma Ave
Length: 0.41 miles
Direction: SW-NE
Address range: 200 to 417
Direction: SW-NE
Address range: 200 to 417
Goodyear St
Length: 0.37 miles
Directions: E-W, SE-NW, SW-NE
Address range: 200 to 499
Directions: E-W, SE-NW, SW-NE
Address range: 200 to 499
Lick Ave
Length: 0.36 miles
Direction: SE-NW
Address range: 1100 to 1399
Direction: SE-NW
Address range: 1100 to 1399
Vine St
Length: 0.36 miles
Direction: SE-NW
Address range: 1100 to 1399
Direction: SE-NW
Address range: 1100 to 1399
S Almaden Ave
Length: 0.36 miles
Directions: N-S, SE-NW
Address range: 1100 to 1399
Directions: N-S, SE-NW
Address range: 1100 to 1399
Floyd St
Length: 0.30 miles
Direction: SW-NE
Address range: 200 to 399
Direction: SW-NE
Address range: 200 to 399
W Humboldt St
Length: 0.22 miles
Direction: SW-NE
Address range: 200 to 349
Direction: SW-NE
Address range: 200 to 349
Willow St
Length: 0.18 miles
Directions: E-W, SW-NE
Address range: 301 to 391
Directions: E-W, SW-NE
Address range: 301 to 391
Pepitone Ave
Length: 0.12 miles
Direction: SE-NW
Address range: 1000 to 1099
Direction: SE-NW
Address range: 1000 to 1099
Humboldt St
Length: 0.07 miles
Direction: SW-NE
Address range: 350 to 399
Direction: SW-NE
Address range: 350 to 399
Railroad features:
Union Pacific RR
Length: 0.49 miles
Direction: SE-NW
Direction: SE-NW