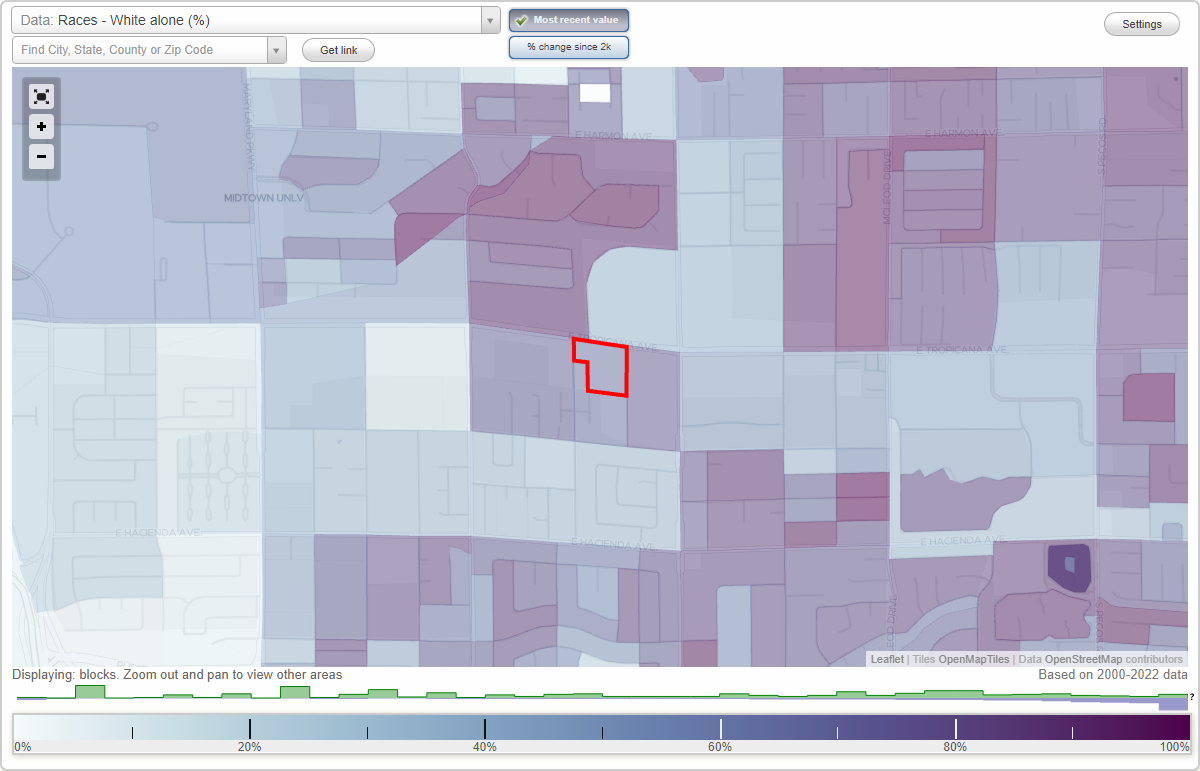
Sutton Place neighborhood in Las Vegas, Nevada (NV), 89119 detailed profile
Settings
X

Business Search - 14 Million verified businesses
Area: 0.013 square miles
Population: 200
Population density:
| Sutton Place: | 15,775 people per square mile |
| Las Vegas: | 5,792 people per square mile |

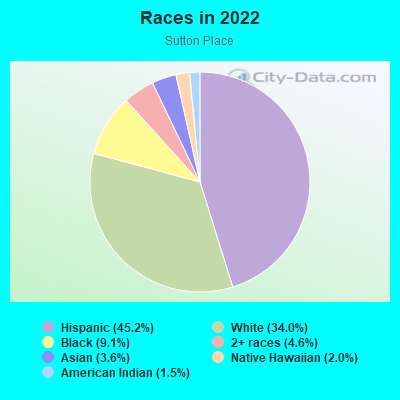
- 8945.2%Hispanic or Latino
- 6734.0%White
- 189.1%Black
- 94.6%Two or more races
- 73.6%Asian
- 42.0%Native Hawaiian and Other
Pacific Islander - 31.5%American Indian
Median household income in 2022:
| Sutton Place: | $26,917 |
| Las Vegas: | $68,905 |
Distribution of median household income
![Distribution of median household income]()
- 11Less than $10,000
- 23$10,000 to $19,999
- 36$20,000 to $29,999
- 9$30,000 to $39,999
- 8$40,000 to $49,999
- 11$50,000 to $59,999
- 15$60,000 to $74,999
- 7$75,000 to $99,999
- 4$100,000 to $124,999
- 9$125,000 to $149,999
- 1$150,000 to $199,999

Distribution of owner-occupied house/condo value
![Distribution of owner-occupied house/condo value]()
- 2$50,000 to $99,999
- 3$100,000 to $149,999
- 33$150,000 to $199,999
- 2$250,000 to $299,999
- 3$300,000 to $399,999
- 2$400,000 to $499,999
- 3$500,000 to $749,999

Distribution of rent paid by renters
![Distribution of rent paid by renters]()
- 1$200 to $299
- 5$300 to $399
- 1$400 to $499
- 3$500 to $599
- 5$600 to $699
- 10$700 to $799
- 8$800 to $899
- 21$900 to $999
- 30$1,000 to $1,249
- 5$1,250 to $1,499

Median rent in 2022:
| Sutton Place: | $963 |
| Las Vegas: | $1,277 |
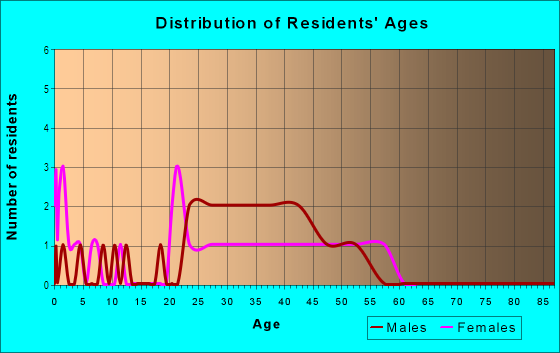
| Males: | 93 |
| Females: | 107 |
Males:
| This neighborhood: | 48.9 years |
| Whole city: | 38.4 years |
| This neighborhood: | 63.1 years |
| Whole city: | 38.9 years |
Average household size:
| Sutton Place: | 1.6 people |
| Las Vegas: | 2.7 people |
Percentage of family households:
| Sutton Place: | 14.2% |
| Las Vegas: | 45.8% |
| Here: | 14.8% |
| Las Vegas: | 40.9% |
Percentage of married-couple families with children (among all households):
| Sutton Place: | 4.6% |
| Las Vegas: | 23.4% |
Percentage of single-mother households (among all households):
| Sutton Place: | 39.9% |
| Las Vegas: | 10.1% |
Percentage of never married males 15 years old and over:
Percentage of never married females 15 years old and over:
| Sutton Place: | 17.5% |
| Las Vegas: | 19.7% |
Percentage of never married females 15 years old and over:
| Sutton Place: | 8.8% |
| city: | 17.0% |
Percentage of people that speak English not well or not at all:
| Sutton Place: | 11.2% |
| Las Vegas: | 7.0% |
Percentage of people born in this state:
Percentage of people born in another U.S. state:
Percentage of native residents but born outside the U.S.:
Percentage of foreign born residents:
| Here: | 16.0% |
| Las Vegas: | 27.3% |
Percentage of people born in another U.S. state:
| Sutton Place: | 32.1% |
| Las Vegas: | 49.8% |
Percentage of native residents but born outside the U.S.:
| Here: | 6.4% |
| city: | 1.9% |
Percentage of foreign born residents:
| Here: | 45.5% |
| Las Vegas: | 21.0% |
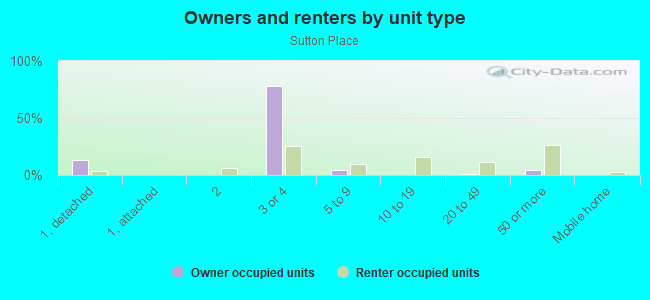
Owner-occupied
Renter-occupied

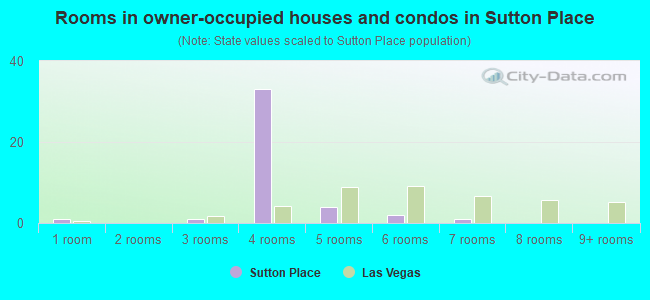
- Rooms in owner-occupied houses and condos in Sutton Place
- 11 room
- 02 rooms
- 13 rooms
- 334 rooms
- 45 rooms
- 26 rooms
- 17 rooms
- 08 rooms
- 09+ rooms
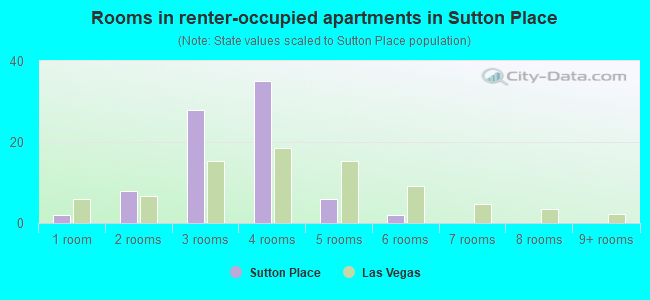
- Rooms in renter-occupied apartments in Sutton Place
- 21 room
- 82 rooms
- 283 rooms
- 354 rooms
- 65 rooms
- 26 rooms
- 07 rooms
- 08 rooms
- 09+ rooms
Owner-occupied
Renter-occupied
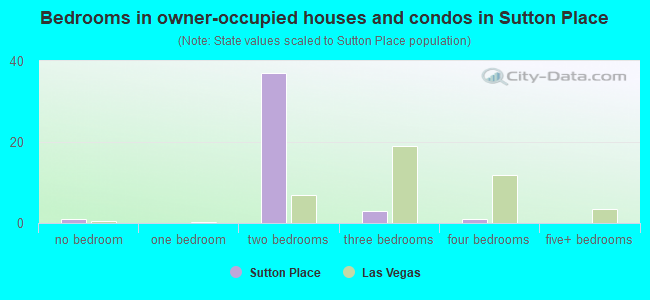
- Bedrooms in owner-occupied houses and condos in Sutton Place
- 1no bedroom
- 01 bedroom
- 372 bedrooms
- 33 bedrooms
- 14 bedrooms
- 05+ bedrooms
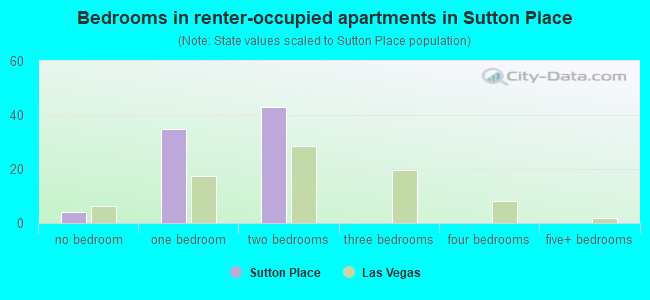
- Bedrooms in renter-occupied apartments in Sutton Place
- 4no bedroom
- 351 bedroom
- 432 bedrooms
- 03 bedrooms
- 04 bedrooms
- 05+ bedrooms
Average number of cars or other vehicles available in houses/condos:
Average number of cars or other vehicles available in apartments:
| This neighborhood: | 1.5 |
| Las Vegas: | 2.0 |
Average number of cars or other vehicles available in apartments:
| Here: | 0.9 |
| city: | 1.3 |
Percentage of units with a mortgage:
| Sutton Place: | 26.7% |
| Las Vegas: | 69.3% |
Housing prices:
- Average estimated value of detached houses in 2022 (5.7% of all units):
Sutton Place: $375,398 Nevada: $549,327
- Average estimated '22 value of housing units in 3-to-4-unit structures (42.6% of all units):
Sutton Place: $169,795 Nevada: $295,216
- Average estimated '22 value of housing units in 5-or-more-unit structures (19.9% of all units):
Sutton Place: $358,326 Nevada: $297,847
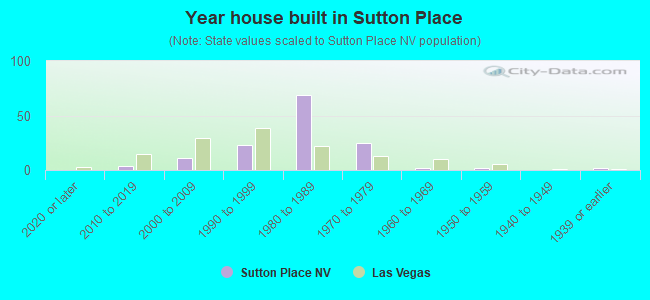
- Year house built in Sutton Place
- 02020 or later
- 42010 to 2019
- 112000 to 2009
- 231990 to 1999
- 691980 to 1989
- 251970 to 1979
- 21960 to 1969
- 21950 to 1959
- 01940 to 1949
- 21939 or earlier
City-data.com crime index for city in 2020 (higher means more crime):
| City: | 280.7 |
| U.S. average: | 219.5 |
Travel time to work (commute)
![Travel time to work (commute)]()
- 1Less than 5 minutes
- 75 to 9 minutes
- 910 to 14 minutes
- 915 to 19 minutes
- 1820 to 24 minutes
- 525 to 29 minutes
- 630 to 34 minutes
- 140 to 44 minutes

Means of transportation to work
![Means of transportation to work]()
- 74.3%53Drove a car alone
- 8.4%6Carpooled
- 1.4%1Bus
- 1.4%1Bicycle
- 2.8%2Walked
- 9.8%7Worked at home

Time leaving home to go to work
![Time leaving home to go to work]()
- 612:00 a.m. to 4:59 a.m.
- 25:00 a.m. to 5:29 a.m.
- 25:30 a.m. to 5:59 a.m.
- 66:00 a.m. to 6:29 a.m.
- 36:30 a.m. to 6:59 a.m.
- 47:00 a.m. to 7:29 a.m.
- 27:30 a.m. to 7:59 a.m.
- 68:00 a.m. to 8:29 a.m.
- 48:30 a.m. to 8:59 a.m.
- 29:00 a.m. to 9:59 a.m.
- 111:00 a.m. to 11:59 a.m.
- 612:00 p.m. to 3:59 p.m.
- 104:00 p.m. to 11:59 p.m.

Occupations of males:
- Percentage of males in management occupations (except farmers):
Here: 10.9% city: 9.6%
- Percentage of males in business and financial operations occupations:
Here: 2.1% city: 3.6%
- Percentage of males in computer and mathematical occupations:
Here: 8.2% city: 3.4%
- Percentage of males in service occupations:
Here: 25.6% city: 23.3%
- Percentage of males in sales and office occupations:
Here: 4.2% city: 16.6%
- Percentage of males in construction, extraction, and maintenance occupations:
Here: 6.0% city: 10.6%
- Percentage of males in production occupations:
Here: 1.7% city: 3.3%
- Percentage of males in transportation occupations:
Here: 19.6% city: 6.6%
- Percentage of males in material moving occupations:
Here: 14.4% city: 5.4%
Occupations of females:
- Percentage of females in management occupations (except farmers):
Here: 3.8% city: 8.5%
- Percentage of females in life, physical, and social science occupations:
Here: 3.6% city: 0.4%
- Percentage of females in education, training, and library occupations:
Here: 1.9% city: 8.0%
- Percentage of females in healthcare practitioners and technical occupations:
Here: 9.5% city: 7.4%
- Percentage of females in service occupations:
Here: 62.7% city: 26.5%
- Percentage of females in sales and office occupations:
Here: 24.0% city: 30.5%
- Percentage of females in farming, fishing, and forestry occupations:
Here: 1.7% city: 0.1%
- Percentage of females in production occupations:
Here: 1.3% city: 1.8%
- Percentage of females in transportation occupations:
Here: 3.2% city: 1.6%
- Percentage of females in material moving occupations:
Here: 4.1% city: 2.2%
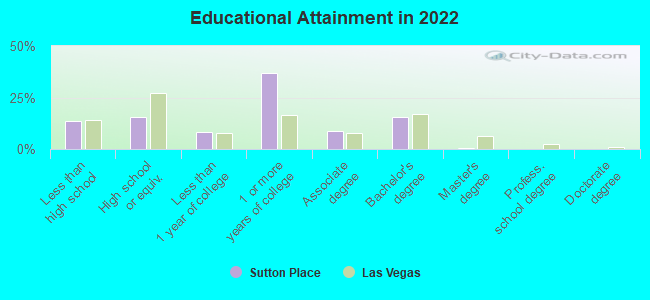
Education in this neighborhood (subdivision or community):
- Percentage of people 3 years and older in K-12 schools:
Sutton Place: 8.5% Las Vegas: 17.4%
- Percentage of people 3 years and older in undergraduate colleges:
Sutton Place: 0.5% Las Vegas: 4.2%
- Percentage of people 3 years and older in grad. or professional schools:
Sutton Place: 0.0% Las Vegas: 1.0%
- Percentage of students K-12 enrolled in private schools:
Sutton Place: 0.0% Las Vegas: 12.9%
Percentage of population below poverty level:
| Sutton Place: | 24.8% |
| Las Vegas: | 14.1% |
Median year owner moved in (as recorded in 2022):
Median year renter moved in (as recorded in 2022):
| Sutton Place: | 2006 |
| Las Vegas: | 2015 |
Median year renter moved in (as recorded in 2022):
| Sutton Place: | 2016 |
| Las Vegas: | 2020 |
Percentage of married-couple families with both working:
| Sutton Place: | 197.2% |
| Las Vegas: | 62.0% |
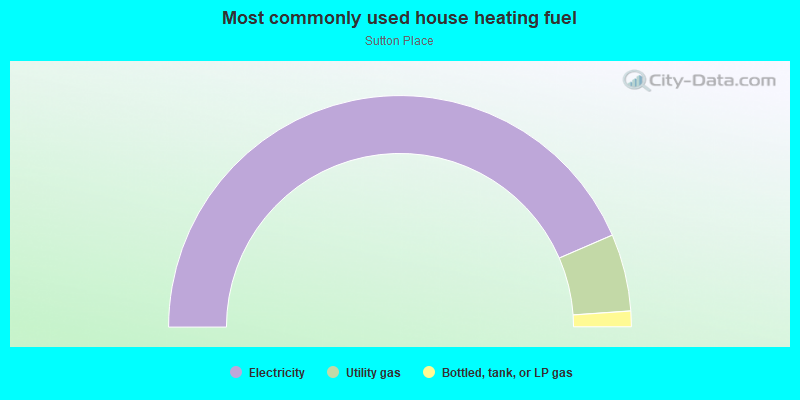
- 87.0%Electricity
- 10.8%Utility gas
- 2.2%Bottled, tank, or LP gas