Sunburst Farms neighborhood in Glendale, Arizona (AZ), 85306 detailed profile
Settings
X


Business Search - 14 Million verified businesses
Area: 0.182 square miles
Population: 670
Population density:
| Sunburst Farms: | 3,675 people per square mile |
| Glendale: | 4,528 people per square mile |

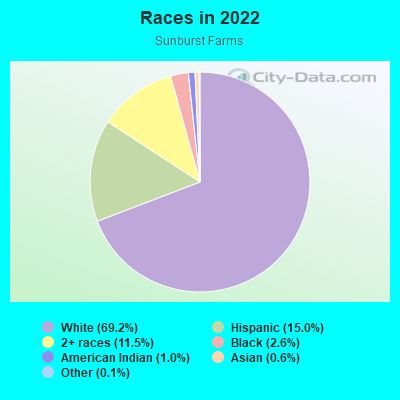
- 47669.2%White
- 10315.0%Hispanic or Latino
- 7911.5%Two or more races
- 182.6%Black
- 71.0%American Indian
- 40.6%Asian
- 10.1%Some other race
Median household income in 2022:
| Sunburst Farms: | $76,032 |
| Glendale: | $72,411 |
Distribution of median household income
![Distribution of median household income]()
- 111Less than $10,000
- 14$10,000 to $19,999
- 36$20,000 to $29,999
- 12$30,000 to $39,999
- 17$40,000 to $49,999
- 10$50,000 to $59,999
- 100$60,000 to $74,999
- 13$75,000 to $99,999
- 12$100,000 to $124,999
- 8$125,000 to $149,999
- 32$150,000 to $199,999
- 28$200,000 or more

Distribution of owner-occupied house/condo value
![Distribution of owner-occupied house/condo value]()
- 25Less than $50,000
- 11$50,000 to $99,999
- 18$100,000 to $149,999
- 16$150,000 to $199,999
- 49$200,000 to $249,999
- 16$250,000 to $299,999
- 53$300,000 to $399,999
- 118$400,000 to $499,999
- 20$500,000 to $749,999
- 4$750,000 to $999,999
- 9$1,000,000 or more

Distribution of rent paid by renters
![Distribution of rent paid by renters]()
- 5$400 to $499
- 7$800 to $899
- 13$900 to $999
- 12$1,000 to $1,249
- 12$1,250 to $1,499
- 6$1,500 to $1,999
- 163$2,000 or more

Median rent in 2022:
| Sunburst Farms: | $3,168 |
| Glendale: | $1,244 |
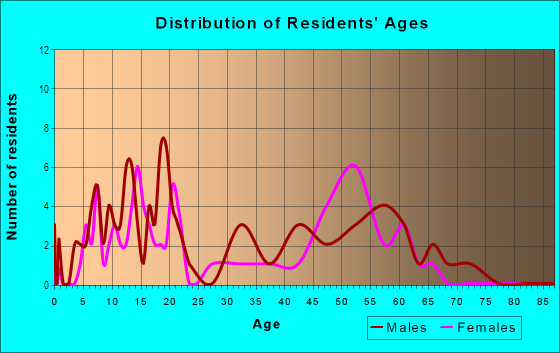
| Males: | 226 |
| Females: | 444 |
Males:
| This neighborhood: | 36.4 years |
| Whole city: | 32.1 years |
| This neighborhood: | 53.9 years |
| Whole city: | 35.7 years |
Average household size:
| Sunburst Farms: | 2.7 people |
| Glendale: | 2.8 people |
Percentage of family households:
| Sunburst Farms: | 18.3% |
| Glendale: | 49.0% |
| Here: | 22.0% |
| Glendale: | 47.7% |
Percentage of married-couple families with children (among all households):
| Sunburst Farms: | 53.1% |
| Glendale: | 24.1% |
Percentage of single-mother households (among all households):
| Sunburst Farms: | 102.5% |
| Glendale: | 8.0% |
Percentage of never married males 15 years old and over:
Percentage of never married females 15 years old and over:
| Sunburst Farms: | 10.4% |
| Glendale: | 20.8% |
Percentage of never married females 15 years old and over:
| Sunburst Farms: | 5.4% |
| city: | 17.2% |
Percentage of people that speak English not well or not at all:
| Sunburst Farms: | 0.6% |
| Glendale: | 8.0% |
Percentage of people born in this state:
Percentage of people born in another U.S. state:
Percentage of native residents but born outside the U.S.:
Percentage of foreign born residents:
| Here: | 39.9% |
| Glendale: | 42.8% |
Percentage of people born in another U.S. state:
| Sunburst Farms: | 47.4% |
| Glendale: | 38.1% |
Percentage of native residents but born outside the U.S.:
| Here: | 0.3% |
| city: | 0.7% |
Percentage of foreign born residents:
| Here: | 12.4% |
| Glendale: | 18.5% |
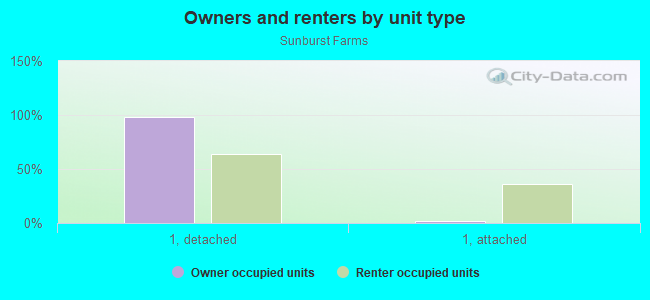
Owner-occupied
Renter-occupied

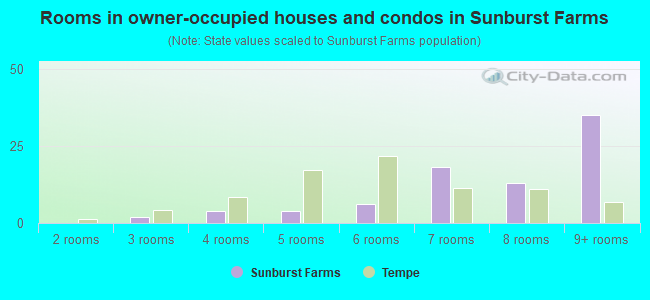
- Rooms in owner-occupied houses and condos in Sunburst Farms
- 11 room
- 02 rooms
- 43 rooms
- 114 rooms
- 335 rooms
- 266 rooms
- 527 rooms
- 258 rooms
- 729+ rooms
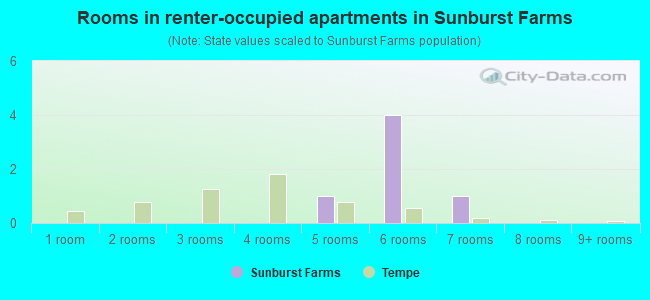
- Rooms in renter-occupied apartments in Sunburst Farms
- 1021 room
- 42 rooms
- 303 rooms
- 554 rooms
- 55 rooms
- 116 rooms
- 37 rooms
- 08 rooms
- 119+ rooms
Owner-occupied
Renter-occupied
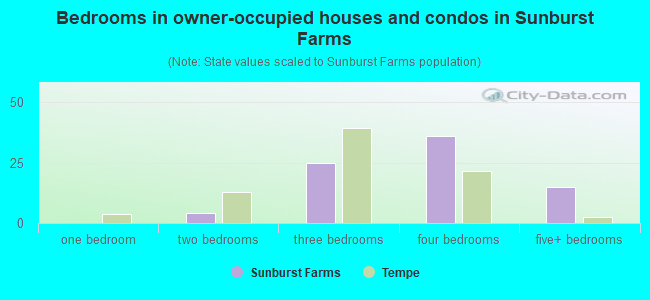
- Bedrooms in owner-occupied houses and condos in Sunburst Farms
- 1no bedroom
- 01 bedroom
- 52 bedrooms
- 853 bedrooms
- 1284 bedrooms
- 25+ bedrooms
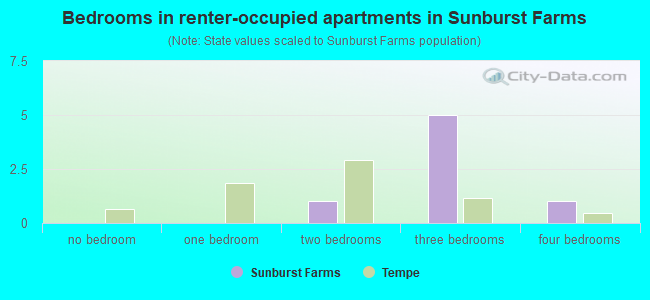
- Bedrooms in renter-occupied apartments in Sunburst Farms
- 102no bedroom
- 41 bedroom
- 632 bedrooms
- 173 bedrooms
- 74 bedrooms
- 115+ bedrooms
Average number of cars or other vehicles available in houses/condos:
Average number of cars or other vehicles available in apartments:
| This neighborhood: | 3.9 |
| Glendale: | 2.3 |
Average number of cars or other vehicles available in apartments:
| Here: | 1.3 |
| city: | 1.6 |
Percentage of units with a mortgage:
| Sunburst Farms: | 34.4% |
| Glendale: | 65.9% |
Average estimated value of detached houses in 2022 (64.4% of all units):
| Sunburst Farms: | $382,491 |
| Glendale: | $364,476 |
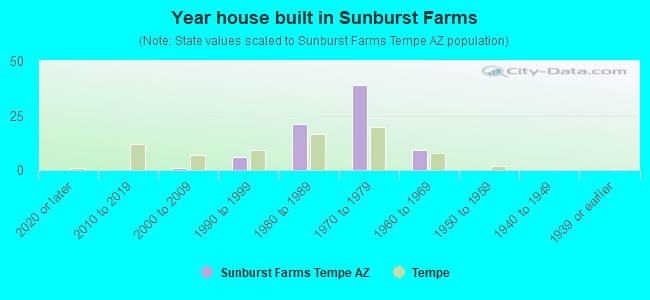
- Year house built in Sunburst Farms
- 42020 or later
- 122010 to 2019
- 92000 to 2009
- 1111990 to 1999
- 1001980 to 1989
- 1861970 to 1979
- 41960 to 1969
- 31950 to 1959
- 01940 to 1949
- 01939 or earlier
City-data.com crime index for city in 2020 (higher means more crime):
| City: | 268.2 |
| U.S. average: | 219.5 |
Travel time to work (commute)
![Travel time to work (commute)]()
- 10Less than 5 minutes
- 295 to 9 minutes
- 2810 to 14 minutes
- 2915 to 19 minutes
- 3520 to 24 minutes
- 1325 to 29 minutes
- 4030 to 34 minutes
- 2135 to 39 minutes
- 1440 to 44 minutes
- 2045 to 59 minutes
- 760 to 89 minutes
- 290 or more minutes

Means of transportation to work
![Means of transportation to work]()
- 74.9%166Drove a car alone
- 4.5%10Carpooled
- 20.3%45Bus
- 6.3%14Motorcycle
- 8.6%19Walked
- 1.8%4Other means
- 19.8%44Worked at home

Time leaving home to go to work
![Time leaving home to go to work]()
- 4412:00 a.m. to 4:59 a.m.
- 105:00 a.m. to 5:29 a.m.
- 125:30 a.m. to 5:59 a.m.
- 396:00 a.m. to 6:29 a.m.
- 256:30 a.m. to 6:59 a.m.
- 227:00 a.m. to 7:29 a.m.
- 87:30 a.m. to 7:59 a.m.
- 218:00 a.m. to 8:29 a.m.
- 98:30 a.m. to 8:59 a.m.
- 169:00 a.m. to 9:59 a.m.
- 510:00 a.m. to 10:59 a.m.
- 3312:00 p.m. to 3:59 p.m.
- 64:00 p.m. to 11:59 p.m.

Occupations of males:
- Percentage of males in management occupations (except farmers):
Here: 8.2% city: 8.8%
- Percentage of males in business and financial operations occupations:
Here: 5.9% city: 3.3%
- Percentage of males in computer and mathematical occupations:
Here: 16.9% city: 3.7%
- Percentage of males in life, physical, and social science occupations:
Here: 1.3% city: 0.7%
- Percentage of males in community and social services occupations:
Here: 1.3% city: 1.2%
- Percentage of males in education, training, and library occupations:
Here: 1.8% city: 2.5%
- Percentage of males in service occupations:
Here: 33.8% city: 15.4%
- Percentage of males in sales and office occupations:
Here: 4.9% city: 17.3%
- Percentage of males in construction, extraction, and maintenance occupations:
Here: 4.4% city: 11.6%
- Percentage of males in production occupations:
Here: 6.5% city: 6.8%
- Percentage of males in transportation occupations:
Here: 11.7% city: 7.3%
- Percentage of males in material moving occupations:
Here: 7.6% city: 6.7%
Occupations of females:
- Percentage of females in management occupations (except farmers):
Here: 6.8% city: 8.1%
- Percentage of females in business and financial operations occupations:
Here: 15.7% city: 6.3%
- Percentage of females in computer and mathematical occupations:
Here: 2.0% city: 1.3%
- Percentage of females in community and social services occupations:
Here: 4.5% city: 2.1%
- Percentage of females in education, training, and library occupations:
Here: 14.9% city: 7.8%
- Percentage of females in arts, design, entertainment, sports, and media occupations:
Here: 1.7% city: 1.2%
- Percentage of females in healthcare practitioners and technical occupations:
Here: 3.9% city: 7.6%
- Percentage of females in service occupations:
Here: 8.4% city: 22.9%
- Percentage of females in sales and office occupations:
Here: 36.2% city: 31.4%
- Percentage of females in production occupations:
Here: 4.5% city: 3.8%
- Percentage of females in transportation occupations:
Here: 5.2% city: 1.5%
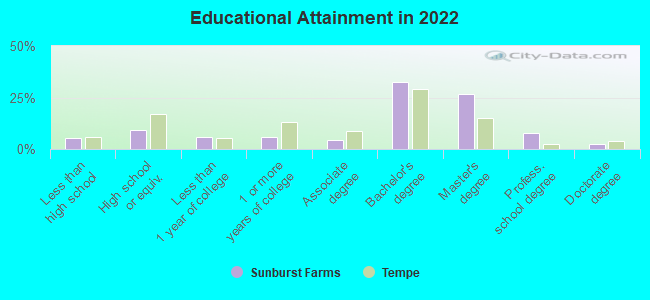
Education in this neighborhood (subdivision or community):
- Percentage of people 3 years and older in K-12 schools:
Sunburst Farms: 13.8% Glendale: 17.4%
- Percentage of people 3 years and older in undergraduate colleges:
Sunburst Farms: 4.1% Glendale: 5.4%
- Percentage of people 3 years and older in grad. or professional schools:
Sunburst Farms: 4.7% Glendale: 1.5%
- Percentage of students K-12 enrolled in private schools:
Sunburst Farms: 13.2% Glendale: 8.6%
Percentage of population below poverty level:
| Sunburst Farms: | 22.1% |
| Glendale: | 15.0% |
Median year owner moved in (as recorded in 2022):
Median year renter moved in (as recorded in 2022):
| Sunburst Farms: | 2004 |
| Glendale: | 2012 |
Median year renter moved in (as recorded in 2022):
| Sunburst Farms: | 2019 |
| Glendale: | 2020 |
Percentage of married-couple families with both working:
| Sunburst Farms: | 377.1% |
| Glendale: | 55.7% |
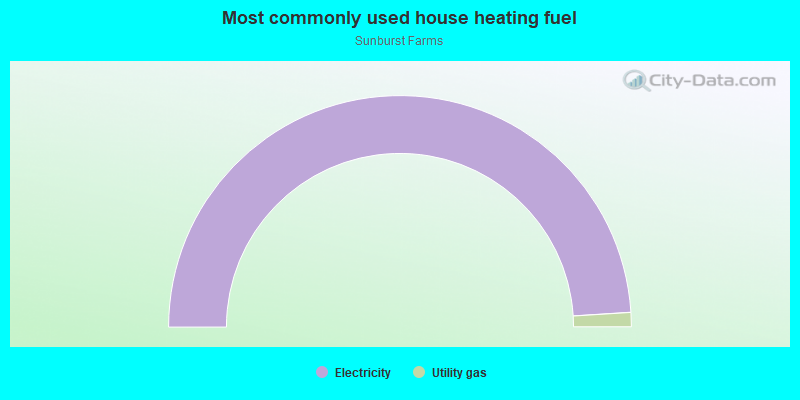
- 78.1%Electricity
- 17.4%Utility gas
- 1.8%Wood
- 1.6%Solar energy
- 1.1%No fuel used
Roads and streets:
W Tierra Buena Ln
Length: 0.57 miles
Direction: E-W
Address range: 5100 to 5499
Direction: E-W
Address range: 5100 to 5499
W Monte Cristo Ave
Length: 0.57 miles
Direction: E-W
Address range: 5100 to 5499
Direction: E-W
Address range: 5100 to 5499
N 53rd Ave
Length: 0.37 miles
Direction: N-S
Address range: 15400 to 16099
Direction: N-S
Address range: 15400 to 16099
W Greenway Rd
Length: 0.29 miles
Direction: E-W
Address range: 5100 to 5298
Direction: E-W
Address range: 5100 to 5298
W Waltann Ln
Length: 0.28 miles
Direction: E-W
Address range: 5100 to 5299
Direction: E-W
Address range: 5100 to 5299
N 55th Ave
Length: 0.15 miles
Direction: N-S
Address range: 15800 to 15999
Direction: N-S
Address range: 15800 to 15999