Summerside neighborhood in San Jose, California (CA), 95122 detailed profile
Settings
X

Business Search - 14 Million verified businesses
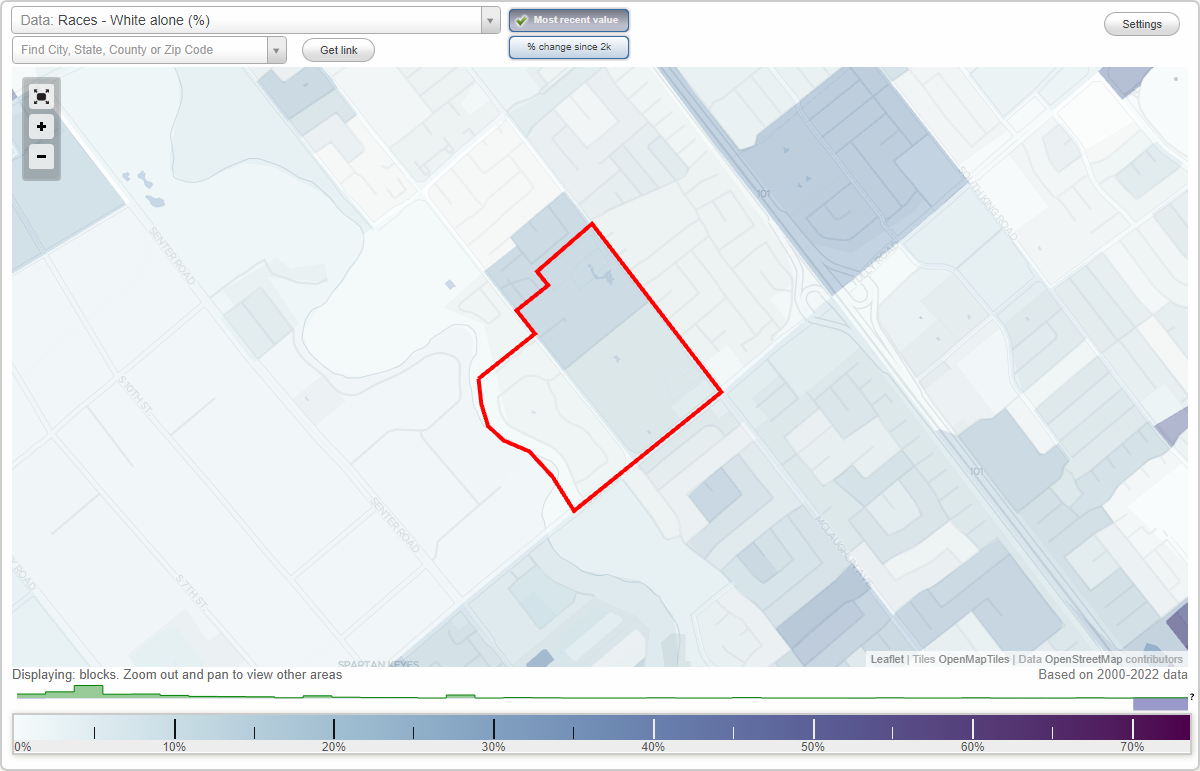
Area: 0.200 square miles
Population: 1,364
Population density:
| Summerside: | 6,805 people per square mile |
| San Jose: | 5,554 people per square mile |

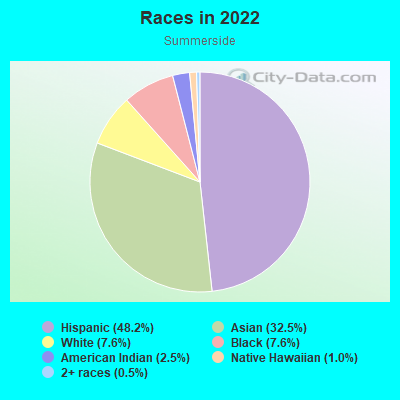
- 73948.2%Hispanic or Latino
- 49932.5%Asian
- 1177.6%White
- 1177.6%Black
- 392.5%American Indian
- 151.0%Native Hawaiian and Other
Pacific Islander - 80.5%Two or more races
Median household income in 2022:
| Summerside: | $127,784 |
| San Jose: | $133,835 |
Distribution of median household income
![Distribution of median household income]()
- 35$10,000 to $19,999
- 18$20,000 to $29,999
- 11$30,000 to $39,999
- 21$40,000 to $49,999
- 22$50,000 to $59,999
- 11$60,000 to $74,999
- 45$75,000 to $99,999
- 56$100,000 to $124,999
- 101$125,000 to $149,999
- 39$150,000 to $199,999
- 39$200,000 or more

Distribution of owner-occupied house/condo value
![Distribution of owner-occupied house/condo value]()
- 13Less than $50,000
- 7$300,000 to $399,999
- 107$500,000 to $749,999
- 82$750,000 to $999,999
- 32$1,000,000 or more

Distribution of rent paid by renters
![Distribution of rent paid by renters]()
- 19$500 to $599
- 5$900 to $999
- 6$1,000 to $1,249
- 13$1,500 to $1,999
- 136$2,000 or more

Median rent in 2022:
| Summerside: | $2,699 |
| San Jose: | $2,001 |
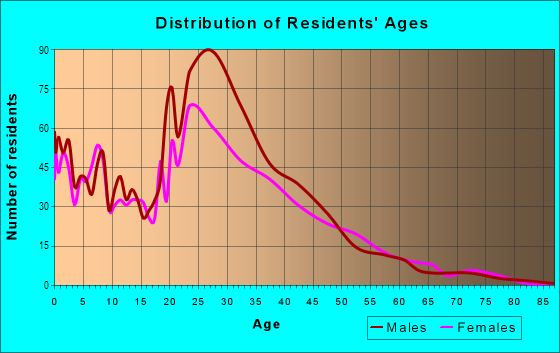
| Males: | 685 |
| Females: | 679 |
Males:
| This neighborhood: | 41.2 years |
| Whole city: | 37.6 years |
| This neighborhood: | 43.4 years |
| Whole city: | 39.1 years |
Average household size:
| Summerside: | 3.8 people |
| San Jose: | 2.9 people |
Percentage of family households:
| Summerside: | 63.2% |
| San Jose: | 49.9% |
| Here: | 60.8% |
| San Jose: | 53.0% |
Percentage of married-couple families with children (among all households):
| Summerside: | 19.2% |
| San Jose: | 25.8% |
Percentage of single-mother households (among all households):
| Summerside: | 6.4% |
| San Jose: | 5.2% |
Percentage of never married males 15 years old and over:
Percentage of never married females 15 years old and over:
| Summerside: | 24.5% |
| San Jose: | 20.9% |
Percentage of never married females 15 years old and over:
| Summerside: | 11.7% |
| city: | 16.7% |
Percentage of people that speak English not well or not at all:
| Summerside: | 0.0% |
| San Jose: | 11.4% |
Percentage of people born in this state:
Percentage of people born in another U.S. state:
Percentage of native residents but born outside the U.S.:
Percentage of foreign born residents:
| Here: | 36.5% |
| San Jose: | 46.1% |
Percentage of people born in another U.S. state:
| Summerside: | 2.2% |
| San Jose: | 10.4% |
Percentage of native residents but born outside the U.S.:
| Here: | 0.9% |
| city: | 1.7% |
Percentage of foreign born residents:
| Here: | 60.5% |
| San Jose: | 41.8% |
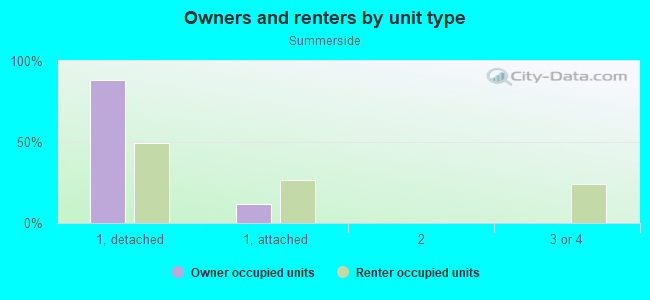
Owner-occupied
Renter-occupied

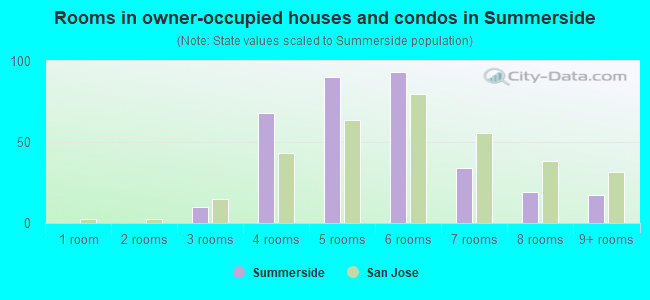
- Rooms in owner-occupied houses and condos in Summerside
- 01 room
- 02 rooms
- 103 rooms
- 684 rooms
- 905 rooms
- 936 rooms
- 347 rooms
- 198 rooms
- 179+ rooms
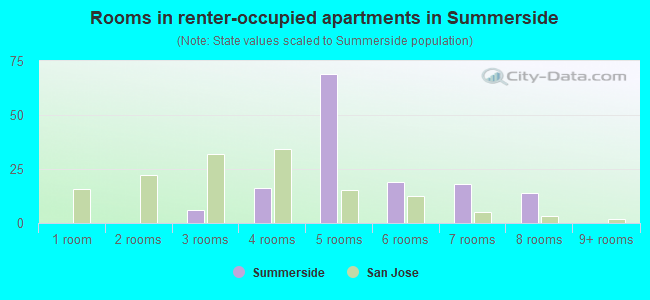
- Rooms in renter-occupied apartments in Summerside
- 01 room
- 02 rooms
- 63 rooms
- 164 rooms
- 695 rooms
- 196 rooms
- 187 rooms
- 148 rooms
- 09+ rooms
Owner-occupied
Renter-occupied
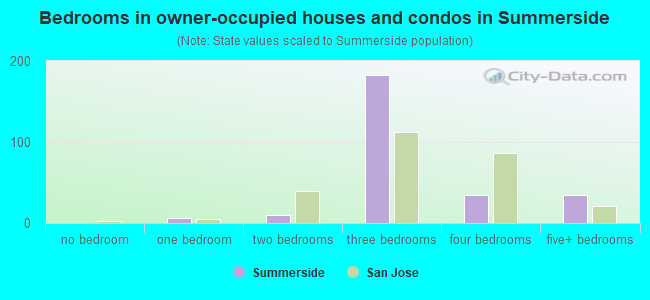
- Bedrooms in owner-occupied houses and condos in Summerside
- 0no bedroom
- 61 bedroom
- 102 bedrooms
- 1833 bedrooms
- 344 bedrooms
- 345+ bedrooms
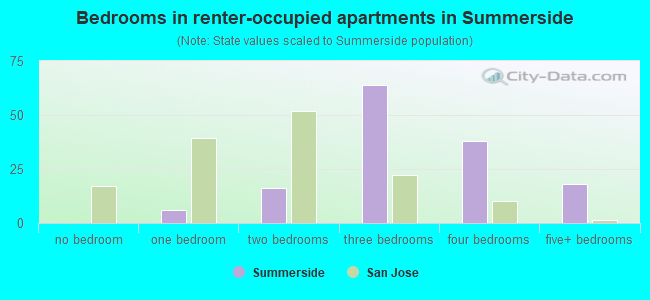
- Bedrooms in renter-occupied apartments in Summerside
- 0no bedroom
- 61 bedroom
- 162 bedrooms
- 643 bedrooms
- 384 bedrooms
- 185+ bedrooms
Average number of cars or other vehicles available in houses/condos:
Average number of cars or other vehicles available in apartments:
| This neighborhood: | 2.8 |
| San Jose: | 2.3 |
Average number of cars or other vehicles available in apartments:
| Here: | 3.0 |
| city: | 1.6 |
Percentage of units with a mortgage:
| Summerside: | 72.3% |
| San Jose: | 66.9% |
Housing prices:
- Average estimated value of detached houses in 2022 (84.1% of all units):
Summerside: $779,998 San Jose: $1,532,815
- Average estimated value of townhouses or other attached units in 2022 (15.9% of all units):
This neighborhood: $430,318 city: $1,024,857
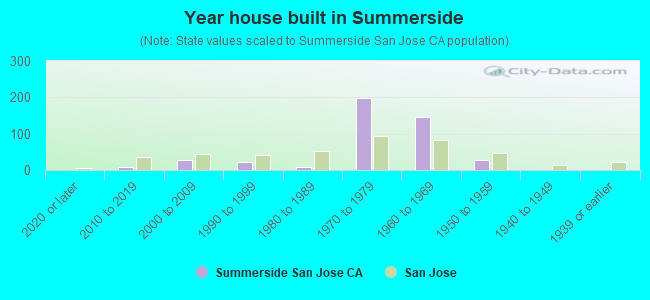
- Year house built in Summerside
- 02020 or later
- 72010 to 2019
- 272000 to 2009
- 211990 to 1999
- 71980 to 1989
- 1981970 to 1979
- 1471960 to 1969
- 271950 to 1959
- 01940 to 1949
- 01939 or earlier
City-data.com crime index for city in 2020 (higher means more crime):
| City: | 268.4 |
| U.S. average: | 219.5 |
Travel time to work (commute)
![Travel time to work (commute)]()
- 245 to 9 minutes
- 14010 to 14 minutes
- 34315 to 19 minutes
- 34020 to 24 minutes
- 16825 to 29 minutes
- 39930 to 34 minutes
- 2135 to 39 minutes
- 5840 to 44 minutes
- 1045 to 59 minutes
- 6160 to 89 minutes
- 4590 or more minutes

Means of transportation to work
![Means of transportation to work]()
- 54.5%414Drove a car alone
- 40.4%307Carpooled
- 3.9%30Bus
- 1.7%13Taxi
- 1.3%10Motorcycle
- 2.8%21Other means
- 1.8%14Worked at home

Time leaving home to go to work
![Time leaving home to go to work]()
- 12512:00 a.m. to 4:59 a.m.
- 885:00 a.m. to 5:29 a.m.
- 1255:30 a.m. to 5:59 a.m.
- 1226:00 a.m. to 6:29 a.m.
- 1896:30 a.m. to 6:59 a.m.
- 3737:00 a.m. to 7:29 a.m.
- 1197:30 a.m. to 7:59 a.m.
- 1478:00 a.m. to 8:29 a.m.
- 558:30 a.m. to 8:59 a.m.
- 819:00 a.m. to 9:59 a.m.
- 7610:00 a.m. to 10:59 a.m.
- 711:00 a.m. to 11:59 a.m.
- 17212:00 p.m. to 3:59 p.m.
- 734:00 p.m. to 11:59 p.m.

Occupations of males:
- Percentage of males in management occupations (except farmers):
Here: 5.7% city: 13.0%
- Percentage of males in business and financial operations occupations:
Here: 6.0% city: 4.6%
- Percentage of males in computer and mathematical occupations:
Here: 7.9% city: 13.6%
- Percentage of males in architecture and engineering occupations:
Here: 9.6% city: 10.2%
- Percentage of males in life, physical, and social science occupations:
Here: 3.3% city: 1.1%
- Percentage of males in community and social services occupations:
Here: 2.1% city: 0.8%
- Percentage of males in legal occupations:
Here: 2.2% city: 0.8%
- Percentage of males in education, training, and library occupations:
Here: 3.4% city: 2.8%
- Percentage of males in healthcare practitioners and technical occupations:
Here: 2.4% city: 2.0%
- Percentage of males in service occupations:
Here: 38.8% city: 12.7%
- Percentage of males in sales and office occupations:
Here: 15.0% city: 12.8%
- Percentage of males in construction, extraction, and maintenance occupations:
Here: 10.0% city: 7.8%
- Percentage of males in production occupations:
Here: 14.0% city: 5.5%
- Percentage of males in transportation occupations:
Here: 2.0% city: 3.6%
Occupations of females:
- Percentage of females in management occupations (except farmers):
Here: 5.5% city: 11.0%
- Percentage of females in business and financial operations occupations:
Here: 5.8% city: 8.6%
- Percentage of females in architecture and engineering occupations:
Here: 4.7% city: 2.8%
- Percentage of females in community and social services occupations:
Here: 4.3% city: 1.8%
- Percentage of females in education, training, and library occupations:
Here: 4.7% city: 8.1%
- Percentage of females in arts, design, entertainment, sports, and media occupations:
Here: 2.7% city: 2.0%
- Percentage of females in healthcare practitioners and technical occupations:
Here: 23.0% city: 6.8%
- Percentage of females in service occupations:
Here: 54.3% city: 21.7%
- Percentage of females in sales and office occupations:
Here: 31.2% city: 22.0%
- Percentage of females in construction, extraction, and maintenance occupations:
Here: 3.6% city: 0.2%
- Percentage of females in production occupations:
Here: 2.3% city: 4.0%
- Percentage of females in transportation occupations:
Here: 6.0% city: 0.7%
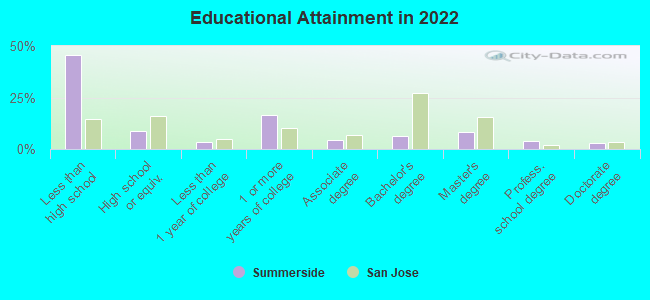
Education in this neighborhood (subdivision or community):
- Percentage of people 3 years and older in K-12 schools:
Summerside: 20.1% San Jose: 16.1%
- Percentage of people 3 years and older in undergraduate colleges:
Summerside: 4.0% San Jose: 6.5%
- Percentage of people 3 years and older in grad. or professional schools:
Summerside: 1.0% San Jose: 2.0%
- Percentage of students K-12 enrolled in private schools:
Summerside: 25.7% San Jose: 14.9%
Percentage of population below poverty level:
| Summerside: | 5.2% |
| San Jose: | 9.0% |
Median year owner moved in (as recorded in 2022):
Median year renter moved in (as recorded in 2022):
| Summerside: | 2005 |
| San Jose: | 2008 |
Median year renter moved in (as recorded in 2022):
| Summerside: | 2014 |
| San Jose: | 2020 |
Percentage of married-couple families with both working:
| Summerside: | 141.9% |
| San Jose: | 72.5% |
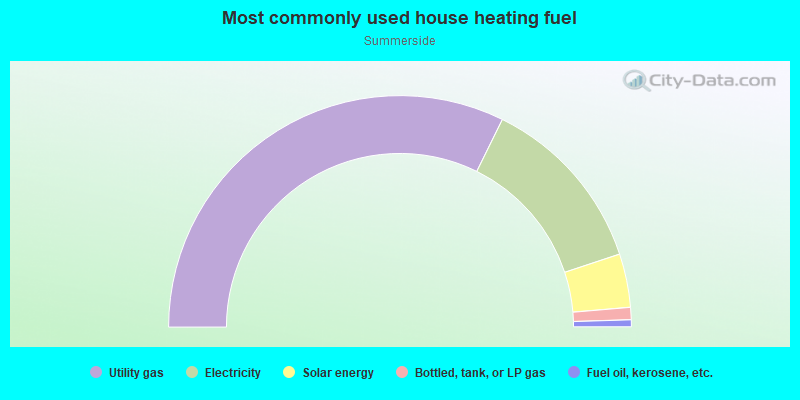
- 64.6%Utility gas
- 25.2%Electricity
- 7.5%Solar energy
- 1.7%Bottled, tank, or LP gas
- 1.0%Fuel oil, kerosene, etc.
Roads and streets:
McLaughlin Ave
Length: 0.53 miles
Direction: SE-NW
Address range: 2051 to 2399
Direction: SE-NW
Address range: 2051 to 2399
Summerside Dr
Length: 0.52 miles
Directions: E-W, SE-NW, SW-NE
Address range: 900 to 2099
Directions: E-W, SE-NW, SW-NE
Address range: 900 to 2099
Galveston Ave
Length: 0.49 miles
Directions: E-W, N-S, SE-NW, SW-NE
Address range: 2100 to 2298
Directions: E-W, N-S, SE-NW, SW-NE
Address range: 2100 to 2298
Tully Rd
Length: 0.47 miles
Direction: SW-NE
Address range: 800 to 1151
Direction: SW-NE
Address range: 800 to 1151
Lucretia Ave
Length: 0.41 miles
Direction: SE-NW
Address range: 2086 to 2398
Direction: SE-NW
Address range: 2086 to 2398
Lucretia Cir
Length: 0.32 miles
Directions: E-W, N-S, SE-NW, SW-NE
Directions: E-W, N-S, SE-NW, SW-NE
Warfield Way
Length: 0.27 miles
Directions: E-W, N-S, SE-NW
Address range: 2200 to 2399
Directions: E-W, N-S, SE-NW
Address range: 2200 to 2399
Summerton Dr
Length: 0.26 miles
Directions: E-W, SE-NW, SW-NE
Address range: 2101 to 2299
Directions: E-W, SE-NW, SW-NE
Address range: 2101 to 2299
Balme Dr
Length: 0.20 miles
Directions: E-W, N-S, SE-NW, SW-NE
Address range: 2300 to 2498
Directions: E-W, N-S, SE-NW, SW-NE
Address range: 2300 to 2498
Paseo Estera Dr (Paseo Estero Dr)
Length: 0.15 miles
Directions: E-W, SW-NE
Directions: E-W, SW-NE
Tekman Dr
Length: 0.13 miles
Directions: E-W, SE-NW, SW-NE
Address range: 1000 to 1199
Directions: E-W, SE-NW, SW-NE
Address range: 1000 to 1199
Summerplace Dr
Length: 0.10 miles
Direction: SE-NW
Address range: 956 to 970
Direction: SE-NW
Address range: 956 to 970
Deer Meadow Ct
Length: 0.09 miles
Direction: SW-NE
Address range: 900 to 999
Direction: SW-NE
Address range: 900 to 999
Summershore Ct
Length: 0.05 miles
Directions: N-S, SE-NW, SW-NE
Address range: 1000 to 1099
Directions: N-S, SE-NW, SW-NE
Address range: 1000 to 1099
Indian Summer Ct
Length: 0.04 miles
Direction: SW-NE
Address range: 1000 to 1199
Direction: SW-NE
Address range: 1000 to 1199
Summerain Ct
Length: 0.04 miles
Direction: SW-NE
Address range: 1000 to 1098
Direction: SW-NE
Address range: 1000 to 1098
Summer Eve Ct
Length: 0.03 miles
Direction: SE-NW
Address range: 2200 to 2229
Direction: SE-NW
Address range: 2200 to 2229
Summermist Ct
Length: 0.03 miles
Direction: SW-NE
Direction: SW-NE