Strang Line neighborhood in Overland Park, Kansas (KS), 66204 detailed profile
Settings
X


Business Search - 14 Million verified businesses
Area: 0.312 square miles
Population: 1,245
Population density:
| Strang Line: | 3,993 people per square mile |
| Overland Park: | 3,485 people per square mile |

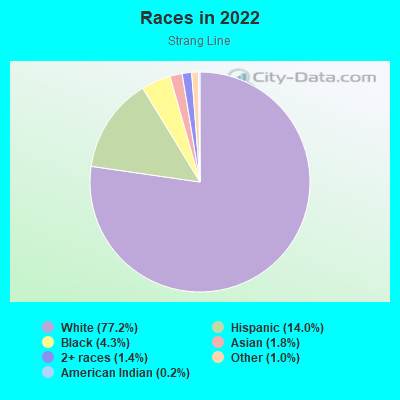
- 98177.2%White
- 17814.0%Hispanic or Latino
- 554.3%Black
- 231.8%Asian
- 181.4%Two or more races
- 131.0%Some other race
- 30.2%American Indian
Median household income in 2022:
| Strang Line: | $70,610 |
| Overland Park: | $96,694 |
Distribution of median household income
![Distribution of median household income]()
- 28Less than $10,000
- 27$10,000 to $19,999
- 67$20,000 to $29,999
- 60$30,000 to $39,999
- 49$40,000 to $49,999
- 48$50,000 to $59,999
- 33$60,000 to $74,999
- 68$75,000 to $99,999
- 110$100,000 to $124,999
- 75$125,000 to $149,999
- 44$150,000 to $199,999
- 16$200,000 or more

Distribution of owner-occupied house/condo value
![Distribution of owner-occupied house/condo value]()
- 17Less than $50,000
- 7$50,000 to $99,999
- 35$100,000 to $149,999
- 159$150,000 to $199,999
- 36$200,000 to $249,999
- 47$250,000 to $299,999
- 92$300,000 to $399,999
- 17$400,000 to $499,999
- 9$500,000 to $749,999

Distribution of rent paid by renters
![Distribution of rent paid by renters]()
- 41$100 to $199
- 24$200 to $299
- 18$300 to $399
- 9$500 to $599
- 5$600 to $699
- 48$700 to $799
- 30$800 to $899
- 99$900 to $999
- 42$1,000 to $1,249
- 50$1,250 to $1,499
- 34$1,500 to $1,999
- 22$2,000 or more

Median rent in 2022:
| Strang Line: | $957 |
| Overland Park: | $1,194 |
| Males: | 626 |
| Females: | 618 |
Males:
| This neighborhood: | 33.5 years |
| Whole city: | 37.7 years |
| This neighborhood: | 35.4 years |
| Whole city: | 38.8 years |
Average household size:
| Strang Line: | 2.2 people |
| Overland Park: | 2.3 people |
Percentage of family households:
| Strang Line: | 39.5% |
| Overland Park: | 42.1% |
| Here: | 38.4% |
| Overland Park: | 48.0% |
Percentage of married-couple families with children (among all households):
| Strang Line: | 30.4% |
| Overland Park: | 37.4% |
Percentage of single-mother households (among all households):
| Strang Line: | 19.1% |
| Overland Park: | 4.2% |
Percentage of never married males 15 years old and over:
Percentage of never married females 15 years old and over:
| Strang Line: | 20.8% |
| Overland Park: | 17.2% |
Percentage of never married females 15 years old and over:
| Strang Line: | 14.2% |
| city: | 15.1% |
Percentage of people that speak English not well or not at all:
| Strang Line: | 3.5% |
| Overland Park: | 1.4% |
Percentage of people born in this state:
Percentage of people born in another U.S. state:
Percentage of native residents but born outside the U.S.:
Percentage of foreign born residents:
| Here: | 37.4% |
| Overland Park: | 37.4% |
Percentage of people born in another U.S. state:
| Strang Line: | 56.5% |
| Overland Park: | 50.4% |
Percentage of native residents but born outside the U.S.:
| Here: | 1.3% |
| city: | 0.9% |
Percentage of foreign born residents:
| Here: | 4.7% |
| Overland Park: | 11.3% |
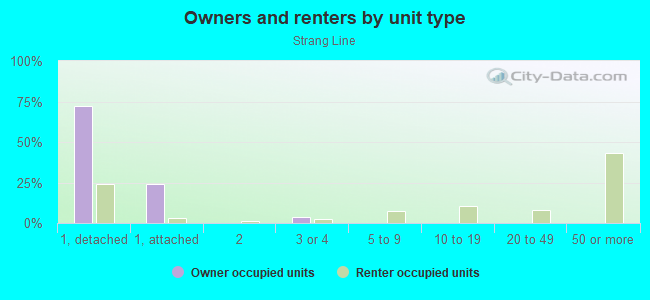
Owner-occupied
Renter-occupied

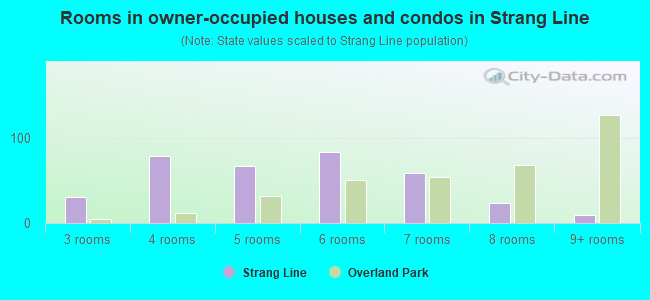
- Rooms in owner-occupied houses and condos in Strang Line
- 01 room
- 02 rooms
- 303 rooms
- 794 rooms
- 675 rooms
- 836 rooms
- 597 rooms
- 238 rooms
- 99+ rooms
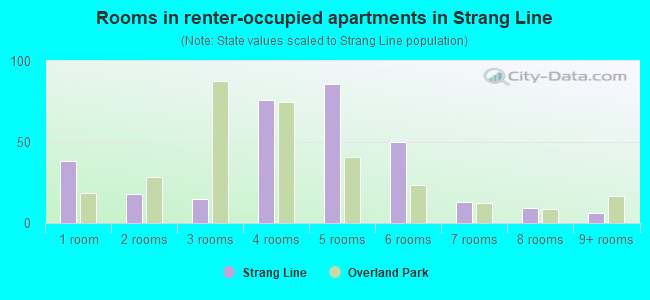
- Rooms in renter-occupied apartments in Strang Line
- 381 room
- 182 rooms
- 153 rooms
- 764 rooms
- 865 rooms
- 506 rooms
- 137 rooms
- 98 rooms
- 69+ rooms
Owner-occupied
Renter-occupied
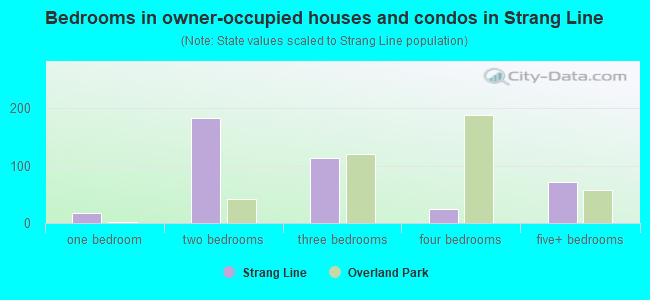
- Bedrooms in owner-occupied houses and condos in Strang Line
- 0no bedroom
- 171 bedroom
- 1832 bedrooms
- 1133 bedrooms
- 244 bedrooms
- 715+ bedrooms
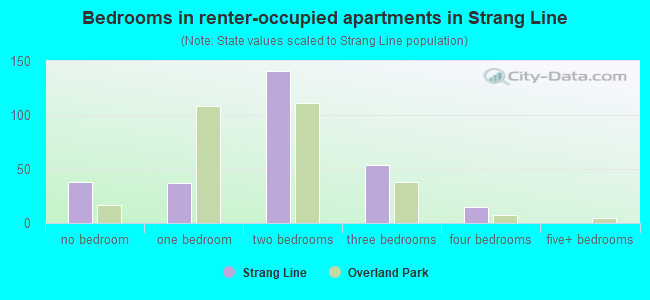
- Bedrooms in renter-occupied apartments in Strang Line
- 38no bedroom
- 371 bedroom
- 1412 bedrooms
- 543 bedrooms
- 154 bedrooms
- 05+ bedrooms
Average number of cars or other vehicles available in houses/condos:
Average number of cars or other vehicles available in apartments:
| This neighborhood: | 1.7 |
| Overland Park: | 2.0 |
Average number of cars or other vehicles available in apartments:
| Here: | 1.3 |
| city: | 1.3 |
Percentage of units with a mortgage:
| Strang Line: | 74.9% |
| Overland Park: | 67.7% |
Average estimated value of detached houses in 2022 (65.0% of all units):
| Strang Line: | $233,569 |
| Kansas: | $264,181 |
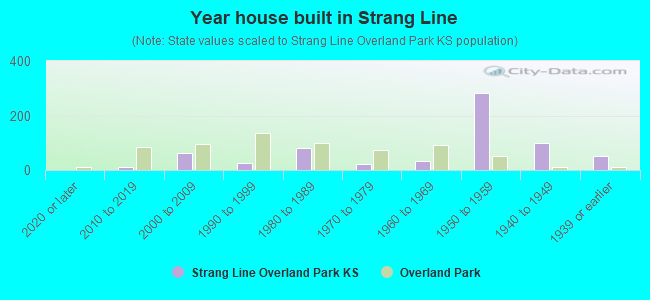
- Year house built in Strang Line
- 02020 or later
- 102010 to 2019
- 612000 to 2009
- 241990 to 1999
- 811980 to 1989
- 211970 to 1979
- 321960 to 1969
- 2821950 to 1959
- 981940 to 1949
- 501939 or earlier
City-data.com crime index for city in 2020 (higher means more crime):
| City: | 154.8 |
| U.S. average: | 219.5 |
Travel time to work (commute)
![Travel time to work (commute)]()
- 4Less than 5 minutes
- 315 to 9 minutes
- 8710 to 14 minutes
- 23115 to 19 minutes
- 18120 to 24 minutes
- 5225 to 29 minutes
- 4630 to 34 minutes
- 535 to 39 minutes
- 440 to 44 minutes
- 1945 to 59 minutes
- 1290 or more minutes

Means of transportation to work
![Means of transportation to work]()
- 89.3%577Drove a car alone
- 2.0%13Carpooled
- 4.0%26Taxi
- 1.7%11Bicycle
- 4.8%31Walked
- 1.4%9Other means
- 8.5%55Worked at home

Time leaving home to go to work
![Time leaving home to go to work]()
- 2012:00 a.m. to 4:59 a.m.
- 45:00 a.m. to 5:29 a.m.
- 405:30 a.m. to 5:59 a.m.
- 316:00 a.m. to 6:29 a.m.
- 416:30 a.m. to 6:59 a.m.
- 767:00 a.m. to 7:29 a.m.
- 1987:30 a.m. to 7:59 a.m.
- 948:00 a.m. to 8:29 a.m.
- 328:30 a.m. to 8:59 a.m.
- 639:00 a.m. to 9:59 a.m.
- 710:00 a.m. to 10:59 a.m.
- 1511:00 a.m. to 11:59 a.m.
- 2012:00 p.m. to 3:59 p.m.
- 254:00 p.m. to 11:59 p.m.

Occupations of males:
- Percentage of males in management occupations (except farmers):
Here: 16.0% city: 17.2%
- Percentage of males in business and financial operations occupations:
Here: 10.2% city: 9.9%
- Percentage of males in computer and mathematical occupations:
Here: 10.6% city: 11.2%
- Percentage of males in community and social services occupations:
Here: 1.1% city: 0.9%
- Percentage of males in legal occupations:
Here: 4.2% city: 2.2%
- Percentage of males in education, training, and library occupations:
Here: 6.1% city: 2.4%
- Percentage of males in arts, design, entertainment, sports, and media occupations:
Here: 3.3% city: 2.6%
- Percentage of males in service occupations:
Here: 14.1% city: 9.7%
- Percentage of males in sales and office occupations:
Here: 2.6% city: 19.9%
- Percentage of males in construction, extraction, and maintenance occupations:
Here: 5.2% city: 2.8%
- Percentage of males in production occupations:
Here: 1.3% city: 2.3%
- Percentage of males in transportation occupations:
Here: 20.4% city: 3.0%
- Percentage of males in material moving occupations:
Here: 7.6% city: 2.7%
Occupations of females:
- Percentage of females in management occupations (except farmers):
Here: 4.5% city: 10.8%
- Percentage of females in business and financial operations occupations:
Here: 16.1% city: 10.2%
- Percentage of females in computer and mathematical occupations:
Here: 2.8% city: 4.6%
- Percentage of females in arts, design, entertainment, sports, and media occupations:
Here: 1.3% city: 2.8%
- Percentage of females in healthcare practitioners and technical occupations:
Here: 4.1% city: 12.1%
- Percentage of females in service occupations:
Here: 22.8% city: 13.8%
- Percentage of females in sales and office occupations:
Here: 45.2% city: 25.2%
- Percentage of females in production occupations:
Here: 3.1% city: 2.0%
Education in this neighborhood (subdivision or community):
- Percentage of people 3 years and older in K-12 schools:
Strang Line: 12.4% Overland Park: 15.4%
- Percentage of people 3 years and older in undergraduate colleges:
Strang Line: 5.2% Overland Park: 3.4%
- Percentage of people 3 years and older in grad. or professional schools:
Strang Line: 2.2% Overland Park: 2.3%
- Percentage of students K-12 enrolled in private schools:
Strang Line: 117.3% Overland Park: 14.1%
Percentage of population below poverty level:
| Strang Line: | 10.8% |
| Overland Park: | 5.0% |
Median year owner moved in (as recorded in 2022):
Median year renter moved in (as recorded in 2022):
| Strang Line: | 2008 |
| Overland Park: | 2013 |
Median year renter moved in (as recorded in 2022):
| Strang Line: | 2017 |
| Overland Park: | 2021 |
Percentage of married-couple families with both working:
| Strang Line: | 114.3% |
| Overland Park: | 75.4% |
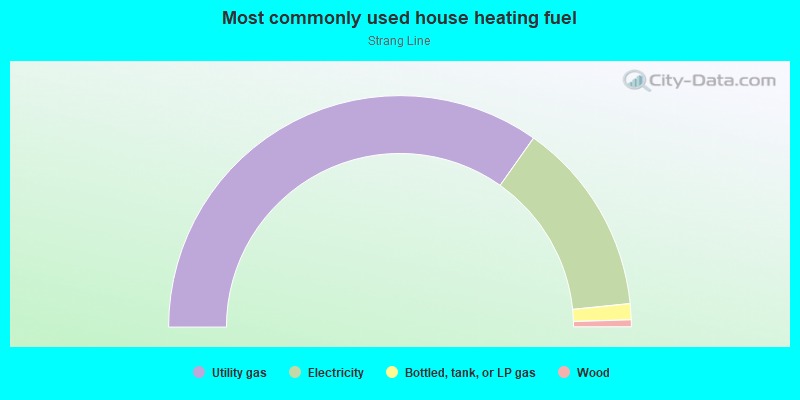
- 69.6%Utility gas
- 27.2%Electricity
- 2.2%Bottled, tank, or LP gas
- 1.0%Wood
Roads and streets:
W 79th St
Length: 0.76 miles
Direction: E-W
Address range: 7100 to 8099
Direction: E-W
Address range: 7100 to 8099
W 78th St
Length: 0.76 miles
Direction: E-W
Address range: 7100 to 7999
Direction: E-W
Address range: 7100 to 7999
W 77th St
Length: 0.72 miles
Direction: E-W
Address range: 7100 to 7999
Direction: E-W
Address range: 7100 to 7999
W 76th St
Length: 0.64 miles
Direction: E-W
Address range: 7100 to 7899
Direction: E-W
Address range: 7100 to 7899
Foster St
Length: 0.39 miles
Direction: N-S
Address range: 7600 to 7899
Direction: N-S
Address range: 7600 to 7899
Lowell Ave
Length: 0.39 miles
Direction: N-S
Address range: 7600 to 7899
Direction: N-S
Address range: 7600 to 7899
Newton St
Length: 0.39 miles
Direction: N-S
Address range: 7600 to 7899
Direction: N-S
Address range: 7600 to 7899
Robinson St
Length: 0.39 miles
Direction: N-S
Address range: 7600 to 7899
Direction: N-S
Address range: 7600 to 7899
Marty St
Length: 0.38 miles
Direction: N-S
Address range: 7600 to 7899
Direction: N-S
Address range: 7600 to 7899
Floyd St
Length: 0.38 miles
Direction: N-S
Address range: 7600 to 7899
Direction: N-S
Address range: 7600 to 7899
Santa Fe Dr
Length: 0.26 miles
Direction: N-S
Address range: 7600 to 7799
Direction: N-S
Address range: 7600 to 7799
Conser St
Length: 0.26 miles
Direction: N-S
Address range: 7600 to 7799
Direction: N-S
Address range: 7600 to 7799
Conser Pl (Conser St)
Length: 0.18 miles
Directions: E-W, N-S
Address range: 7800 to 7899
Directions: E-W, N-S
Address range: 7800 to 7899
Hardy St
Length: 0.13 miles
Direction: N-S
Address range: 7800 to 7899
Direction: N-S
Address range: 7800 to 7899
Riley St
Length: 0.10 miles
Direction: N-S
Address range: 7800 to 7899
Direction: N-S
Address range: 7800 to 7899