Stoneridge Gallery neighborhood in Mission Viejo, California (CA), 92692, 92688 detailed profile
Settings
X


Business Search - 14 Million verified businesses
Area: 0.164 square miles
Population: 860
Population density:
| Stoneridge Gallery: | 5,248 people per square mile |
| Mission Viejo: | 4,919 people per square mile |

- 56165.4%White
- 16819.6%Asian
- 566.5%Black
- 485.6%Hispanic or Latino
- 242.8%Two or more races
- 10.1%Some other race

Median household income in 2022:
| Stoneridge Gallery: | $227,557 |
| Mission Viejo: | $126,469 |
Distribution of median household income
![Distribution of median household income]()
- 9Less than $10,000
- 6$10,000 to $19,999
- 9$20,000 to $29,999
- 11$30,000 to $39,999
- 9$40,000 to $49,999
- 11$50,000 to $59,999
- 8$60,000 to $74,999
- 7$75,000 to $99,999
- 21$100,000 to $124,999
- 18$125,000 to $149,999
- 29$150,000 to $199,999
- 169$200,000 or more

Distribution of owner-occupied house/condo value
![Distribution of owner-occupied house/condo value]()
- 8Less than $50,000
- 1$100,000 to $149,999
- 4$150,000 to $199,999
- 1$300,000 to $399,999
- 5$400,000 to $499,999
- 37$500,000 to $749,999
- 19$750,000 to $999,999
- 244$1,000,000 or more

Distribution of rent paid by renters
![Distribution of rent paid by renters]()
- 1$600 to $699
- 1$800 to $899
- 1$1,500 to $1,999
- 18$2,000 or more

Median rent in 2022:
| Stoneridge Gallery: | $3,501 |
| Mission Viejo: | $2,001 |
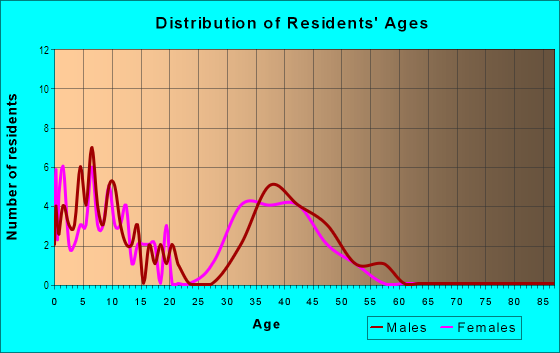
| Males: | 444 |
| Females: | 416 |
Males:
| This neighborhood: | 47.4 years |
| Whole city: | 42.6 years |
| This neighborhood: | 51.8 years |
| Whole city: | 45.6 years |
Average household size:
| Stoneridge Gallery: | 38.0 people |
| Mission Viejo: | 2.8 people |
Percentage of family households:
| Stoneridge Gallery: | 47.7% |
| Mission Viejo: | 50.2% |
| Here: | 81.3% |
| Mission Viejo: | 58.8% |
Percentage of married-couple families with children (among all households):
| Stoneridge Gallery: | 29.4% |
| Mission Viejo: | 29.0% |
Percentage of single-mother households (among all households):
| Stoneridge Gallery: | 1.5% |
| Mission Viejo: | 5.1% |
Percentage of never married males 15 years old and over:
Percentage of never married females 15 years old and over:
| Stoneridge Gallery: | 13.6% |
| Mission Viejo: | 17.0% |
Percentage of never married females 15 years old and over:
| Stoneridge Gallery: | 8.9% |
| city: | 12.1% |
Percentage of people that speak English not well or not at all:
| Stoneridge Gallery: | 59.5% |
| Mission Viejo: | 3.7% |
Percentage of people born in this state:
Percentage of people born in another U.S. state:
Percentage of native residents but born outside the U.S.:
Percentage of foreign born residents:
| Here: | 37.0% |
| Mission Viejo: | 56.8% |
Percentage of people born in another U.S. state:
| Stoneridge Gallery: | 29.8% |
| Mission Viejo: | 21.7% |
Percentage of native residents but born outside the U.S.:
| Here: | 1.4% |
| city: | 2.0% |
Percentage of foreign born residents:
| Here: | 31.8% |
| Mission Viejo: | 19.5% |

Owner-occupied
Renter-occupied


- Rooms in owner-occupied houses and condos in Stoneridge Gallery
- 21 room
- 02 rooms
- 63 rooms
- 64 rooms
- 245 rooms
- 426 rooms
- 297 rooms
- 818 rooms
- 1109+ rooms

- Rooms in renter-occupied apartments in Stoneridge Gallery
- 01 room
- 02 rooms
- 13 rooms
- 34 rooms
- 65 rooms
- 26 rooms
- 77 rooms
- 18 rooms
- 29+ rooms
Owner-occupied
Renter-occupied

- Bedrooms in owner-occupied houses and condos in Stoneridge Gallery
- 2no bedroom
- 21 bedroom
- 612 bedrooms
- 443 bedrooms
- 1564 bedrooms
- 685+ bedrooms

- Bedrooms in renter-occupied apartments in Stoneridge Gallery
- 0no bedroom
- 01 bedroom
- 112 bedrooms
- 53 bedrooms
- 14 bedrooms
- 95+ bedrooms
Average number of cars or other vehicles available in houses/condos:
Average number of cars or other vehicles available in apartments:
| This neighborhood: | 2.6 |
| Mission Viejo: | 2.3 |
Average number of cars or other vehicles available in apartments:
| Here: | 2.7 |
| city: | 1.7 |
Percentage of units with a mortgage:
| Stoneridge Gallery: | 68.9% |
| Mission Viejo: | 76.4% |
Average estimated value of detached houses in 2022 (100.0% of all units):
| Stoneridge Gallery: | $1,667,221 |
| California: | $988,808 |

- Year house built in Stoneridge Gallery
- 02020 or later
- 62010 to 2019
- 122000 to 2009
- 1201990 to 1999
- 1351980 to 1989
- 81970 to 1979
- 11960 to 1969
- 01950 to 1959
- 01940 to 1949
- 01939 or earlier

City-data.com crime index for city in 2020 (higher means more crime):
| City: | 63.4 |
| U.S. average: | 219.5 |
Travel time to work (commute)
![Travel time to work (commute)]()
- 4Less than 5 minutes
- 145 to 9 minutes
- 510 to 14 minutes
- 615 to 19 minutes
- 1020 to 24 minutes
- 625 to 29 minutes
- 830 to 34 minutes
- 335 to 39 minutes
- 540 to 44 minutes
- 3045 to 59 minutes
- 760 to 89 minutes
- 590 or more minutes

Means of transportation to work
![Means of transportation to work]()
- 80.0%353Drove a car alone
- 4.5%20Carpooled
- 1.4%6Motorcycle
- 0.2%1Other means
- 13.8%61Worked at home

Time leaving home to go to work
![Time leaving home to go to work]()
- 212:00 a.m. to 4:59 a.m.
- 85:00 a.m. to 5:29 a.m.
- 25:30 a.m. to 5:59 a.m.
- 76:00 a.m. to 6:29 a.m.
- 26:30 a.m. to 6:59 a.m.
- 127:00 a.m. to 7:29 a.m.
- 77:30 a.m. to 7:59 a.m.
- 68:00 a.m. to 8:29 a.m.
- 38:30 a.m. to 8:59 a.m.
- 39:00 a.m. to 9:59 a.m.
- 610:00 a.m. to 10:59 a.m.
- 612:00 p.m. to 3:59 p.m.
- 24:00 p.m. to 11:59 p.m.

Occupations of males:
- Percentage of males in management occupations (except farmers):
Here: 40.5% city: 21.8%
- Percentage of males in business and financial operations occupations:
Here: 8.5% city: 7.5%
- Percentage of males in computer and mathematical occupations:
Here: 7.5% city: 6.6%
- Percentage of males in architecture and engineering occupations:
Here: 13.4% city: 5.6%
- Percentage of males in life, physical, and social science occupations:
Here: 1.1% city: 0.8%
- Percentage of males in legal occupations:
Here: 5.7% city: 1.7%
- Percentage of males in education, training, and library occupations:
Here: 7.1% city: 3.1%
- Percentage of males in arts, design, entertainment, sports, and media occupations:
Here: 5.8% city: 2.4%
- Percentage of males in healthcare practitioners and technical occupations:
Here: 1.4% city: 2.6%
- Percentage of males in service occupations:
Here: 7.0% city: 12.3%
- Percentage of males in sales and office occupations:
Here: 5.3% city: 19.1%
- Percentage of males in construction, extraction, and maintenance occupations:
Here: 1.6% city: 4.4%
- Percentage of males in production occupations:
Here: 12.5% city: 3.3%
- Percentage of males in transportation occupations:
Here: 1.6% city: 2.5%
Occupations of females:
- Percentage of females in management occupations (except farmers):
Here: 10.9% city: 14.1%
- Percentage of females in business and financial operations occupations:
Here: 19.2% city: 9.2%
- Percentage of females in computer and mathematical occupations:
Here: 13.5% city: 2.8%
- Percentage of females in life, physical, and social science occupations:
Here: 1.4% city: 1.4%
- Percentage of females in legal occupations:
Here: 1.0% city: 2.0%
- Percentage of females in education, training, and library occupations:
Here: 4.8% city: 9.7%
- Percentage of females in healthcare practitioners and technical occupations:
Here: 14.1% city: 8.1%
- Percentage of females in service occupations:
Here: 17.0% city: 15.1%
- Percentage of females in sales and office occupations:
Here: 31.4% city: 28.1%
Education in this neighborhood (subdivision or community):
- Percentage of people 3 years and older in K-12 schools:
Stoneridge Gallery: 13.9% Mission Viejo: 15.0%
- Percentage of people 3 years and older in undergraduate colleges:
Stoneridge Gallery: 3.8% Mission Viejo: 5.6%
- Percentage of people 3 years and older in grad. or professional schools:
Stoneridge Gallery: 0.5% Mission Viejo: 1.0%
- Percentage of students K-12 enrolled in private schools:
Stoneridge Gallery: 23.1% Mission Viejo: 22.1%
Percentage of population below poverty level:
| Stoneridge Gallery: | 5.2% |
| Mission Viejo: | 9.3% |
Median year owner moved in (as recorded in 2022):
| Stoneridge Gallery: | 2005 |
| Mission Viejo: | 2008 |
Percentage of married-couple families with both working:
| Stoneridge Gallery: | 89.6% |
| Mission Viejo: | 78.0% |

- 74.2%Utility gas
- 17.8%Electricity
- 4.8%Solar energy
- 1.3%Bottled, tank, or LP gas
- 1.2%No fuel used
- 0.7%Fuel oil, kerosene, etc.
Roads and streets:
Stoneridge
Length: 0.49 miles
Directions: E-W, N-S, SE-NW, SW-NE
Address range: 22915 to 23125
Directions: E-W, N-S, SE-NW, SW-NE
Address range: 22915 to 23125
Bouquet Canyon
Length: 0.28 miles
Directions: E-W, N-S, SE-NW, SW-NE
Address range: 2301 to 23999
Directions: E-W, N-S, SE-NW, SW-NE
Address range: 2301 to 23999
Maiden Ln
Length: 0.18 miles
Directions: N-S, SE-NW, SW-NE
Directions: N-S, SE-NW, SW-NE
Poplar
Length: 0.16 miles
Directions: N-S, SE-NW
Address range: 2300 to 23199
Directions: N-S, SE-NW
Address range: 2300 to 23199
Fairfield
Length: 0.12 miles
Directions: N-S, SE-NW, SW-NE
Address range: 23064 to 23199
Directions: N-S, SE-NW, SW-NE
Address range: 23064 to 23199
Huntercreek
Length: 0.12 miles
Directions: N-S, SW-NE
Address range: 22885 to 22895
Directions: N-S, SW-NE
Address range: 22885 to 22895
Rockrose
Length: 0.10 miles
Directions: E-W, SW-NE
Address range: 23100 to 23143
Directions: E-W, SW-NE
Address range: 23100 to 23143
Driftstone
Length: 0.09 miles
Direction: N-S
Address range: 22800 to 22899
Direction: N-S
Address range: 22800 to 22899
Mountain Pine
Length: 0.08 miles
Direction: N-S
Address range: 23000 to 23199
Direction: N-S
Address range: 23000 to 23199
Sweetwater
Length: 0.08 miles
Direction: N-S
Direction: N-S
Walnut
Length: 0.04 miles
Directions: E-W, SE-NW
Directions: E-W, SE-NW
Sunrise
Length: 0.04 miles
Direction: E-W
Direction: E-W
Rustic Oak
Length: 0.01 miles
Direction: SE-NW
Direction: SE-NW