Stevens Park Estates neighborhood in Dallas, Texas (TX), 75208 detailed profile
Settings
X


Business Search - 14 Million verified businesses
Area: 0.167 square miles
Population: 877
Population density:
| Stevens Park Estates: | 5,252 people per square mile |
| Dallas: | 3,794 people per square mile |

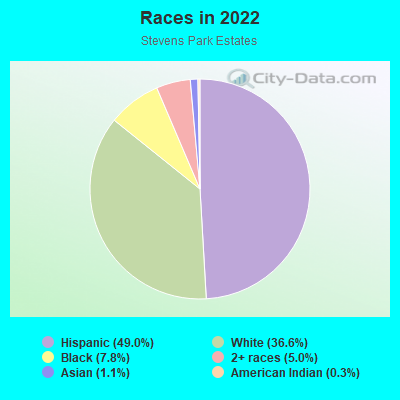
- 43149.0%Hispanic or Latino
- 32236.6%White
- 697.8%Black
- 445.0%Two or more races
- 101.1%Asian
- 30.3%American Indian
Distribution of median household income
![Distribution of median household income]()
- 20Less than $10,000
- 55$10,000 to $19,999
- 93$20,000 to $29,999
- 24$30,000 to $39,999
- 64$40,000 to $49,999
- 27$50,000 to $59,999
- 25$60,000 to $74,999
- 9$75,000 to $99,999
- 31$100,000 to $124,999
- 9$125,000 to $149,999
- 8$150,000 to $199,999
- 135$200,000 or more

Distribution of owner-occupied house/condo value
![Distribution of owner-occupied house/condo value]()
- 16Less than $50,000
- 36$50,000 to $99,999
- 13$100,000 to $149,999
- 20$150,000 to $199,999
- 16$200,000 to $249,999
- 7$250,000 to $299,999
- 17$300,000 to $399,999
- 14$400,000 to $499,999
- 25$500,000 to $749,999
- 23$750,000 to $999,999
- 84$1,000,000 or more

Distribution of rent paid by renters
![Distribution of rent paid by renters]()
- 6$100 to $199
- 21$200 to $299
- 11$300 to $399
- 12$400 to $499
- 20$500 to $599
- 8$700 to $799
- 27$800 to $899
- 217$900 to $999
- 127$1,000 to $1,249
- 28$1,250 to $1,499
- 31$1,500 to $1,999
- 18$2,000 or more

Median rent in 2022:
| Stevens Park Estates: | $1,187 |
| Dallas: | $1,208 |
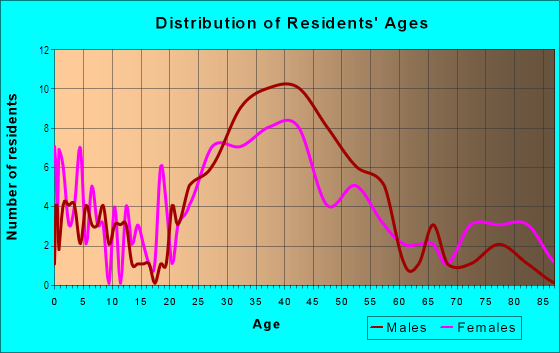
| Males: | 521 |
| Females: | 355 |
Males:
| This neighborhood: | 32.6 years |
| Whole city: | 32.8 years |
| This neighborhood: | 40.0 years |
| Whole city: | 33.4 years |
Average household size:
| Stevens Park Estates: | 15.8 people |
| Dallas: | 2.4 people |
Percentage of family households:
| Stevens Park Estates: | 63.6% |
| Dallas: | 42.6% |
| Here: | 53.4% |
| Dallas: | 33.8% |
Percentage of married-couple families with children (among all households):
| Stevens Park Estates: | 23.2% |
| Dallas: | 24.8% |
Percentage of single-mother households (among all households):
| Stevens Park Estates: | 18.4% |
| Dallas: | 13.3% |
Percentage of never married males 15 years old and over:
Percentage of never married females 15 years old and over:
| Stevens Park Estates: | 16.7% |
| Dallas: | 22.1% |
Percentage of never married females 15 years old and over:
| Stevens Park Estates: | 9.2% |
| city: | 21.8% |
Percentage of people that speak English not well or not at all:
| Stevens Park Estates: | 0.5% |
| Dallas: | 10.7% |
Percentage of people born in this state:
Percentage of people born in another U.S. state:
Percentage of native residents but born outside the U.S.:
Percentage of foreign born residents:
| Here: | 58.8% |
| Dallas: | 52.8% |
Percentage of people born in another U.S. state:
| Stevens Park Estates: | 36.3% |
| Dallas: | 22.0% |
Percentage of native residents but born outside the U.S.:
| Here: | 0.8% |
| city: | 1.3% |
Percentage of foreign born residents:
| Here: | 4.0% |
| Dallas: | 23.9% |
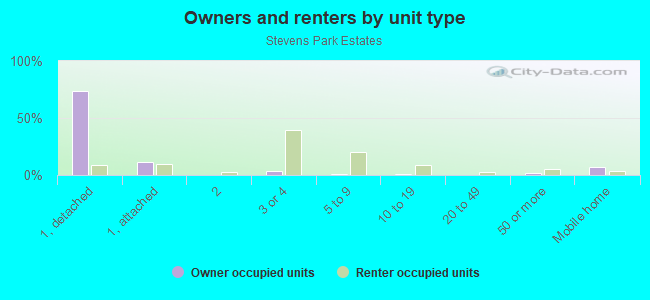
Owner-occupied
Renter-occupied

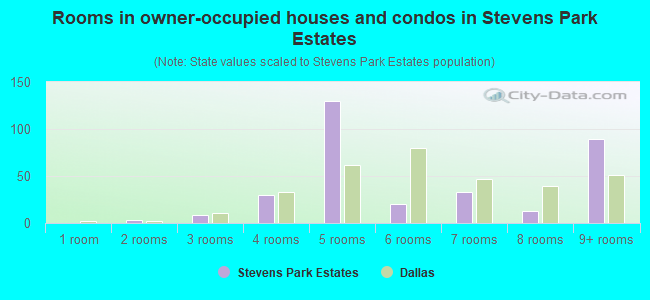
- Rooms in owner-occupied houses and condos in Stevens Park Estates
- 01 room
- 32 rooms
- 93 rooms
- 304 rooms
- 1305 rooms
- 206 rooms
- 337 rooms
- 138 rooms
- 899+ rooms
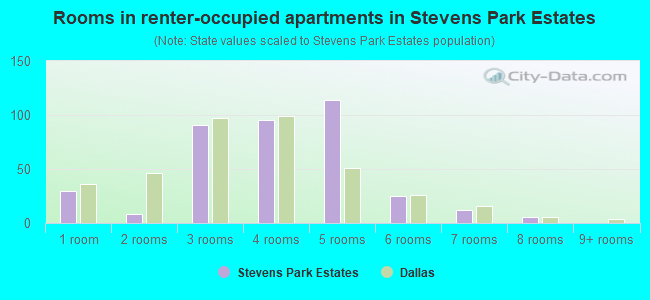
- Rooms in renter-occupied apartments in Stevens Park Estates
- 301 room
- 82 rooms
- 913 rooms
- 954 rooms
- 1145 rooms
- 256 rooms
- 127 rooms
- 68 rooms
- 09+ rooms
Owner-occupied
Renter-occupied
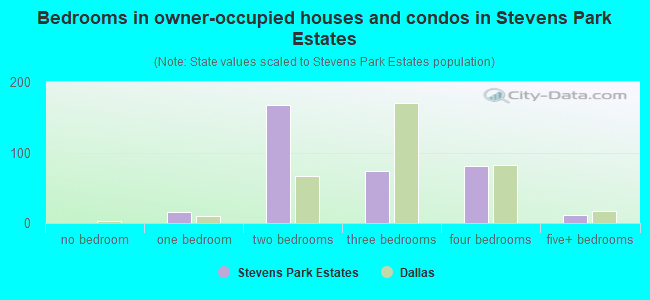
- Bedrooms in owner-occupied houses and condos in Stevens Park Estates
- 0no bedroom
- 151 bedroom
- 1672 bedrooms
- 743 bedrooms
- 814 bedrooms
- 115+ bedrooms
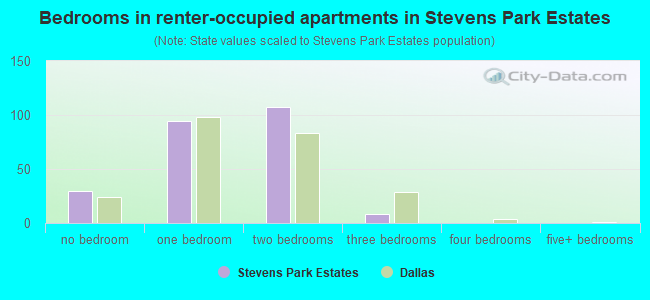
- Bedrooms in renter-occupied apartments in Stevens Park Estates
- 30no bedroom
- 941 bedroom
- 1072 bedrooms
- 83 bedrooms
- 04 bedrooms
- 05+ bedrooms
Average number of cars or other vehicles available in houses/condos:
Average number of cars or other vehicles available in apartments:
| This neighborhood: | 2.2 |
| Dallas: | 2.1 |
Average number of cars or other vehicles available in apartments:
| Here: | 1.3 |
| city: | 1.3 |
Percentage of units with a mortgage:
| Stevens Park Estates: | 54.2% |
| Dallas: | 53.9% |
Average estimated value of detached houses in 2022 (51.2% of all units):
| Stevens Park Estates: | $877,498 |
| Dallas: | $423,859 |
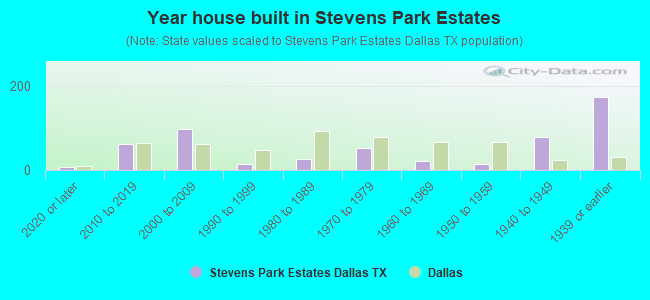
- Year house built in Stevens Park Estates
- 62020 or later
- 632010 to 2019
- 972000 to 2009
- 151990 to 1999
- 261980 to 1989
- 531970 to 1979
- 211960 to 1969
- 151950 to 1959
- 791940 to 1949
- 1741939 or earlier
City-data.com crime index for city in 2020 (higher means more crime):
| City: | 439.5 |
| U.S. average: | 219.5 |
Travel time to work (commute)
![Travel time to work (commute)]()
- 2Less than 5 minutes
- 295 to 9 minutes
- 4110 to 14 minutes
- 4715 to 19 minutes
- 2120 to 24 minutes
- 2025 to 29 minutes
- 3330 to 34 minutes
- 835 to 39 minutes
- 3840 to 44 minutes
- 4045 to 59 minutes
- 2560 to 89 minutes
- 490 or more minutes

Means of transportation to work
![Means of transportation to work]()
- 59.4%250Drove a car alone
- 12.1%51Carpooled
- 1.7%7Bus
- 0.2%1Long-distance train or commuter rail
- 0.2%1Bicycle
- 1.9%8Walked
- 0.2%1Other means
- 37.5%158Worked at home

Time leaving home to go to work
![Time leaving home to go to work]()
- 312:00 a.m. to 4:59 a.m.
- 75:00 a.m. to 5:29 a.m.
- 65:30 a.m. to 5:59 a.m.
- 476:00 a.m. to 6:29 a.m.
- 166:30 a.m. to 6:59 a.m.
- 587:00 a.m. to 7:29 a.m.
- 407:30 a.m. to 7:59 a.m.
- 308:00 a.m. to 8:29 a.m.
- 288:30 a.m. to 8:59 a.m.
- 219:00 a.m. to 9:59 a.m.
- 1510:00 a.m. to 10:59 a.m.
- 111:00 a.m. to 11:59 a.m.
- 2612:00 p.m. to 3:59 p.m.
- 34:00 p.m. to 11:59 p.m.

Occupations of males:
- Percentage of males in management occupations (except farmers):
Here: 4.6% city: 10.9%
- Percentage of males in business and financial operations occupations:
Here: 32.1% city: 7.3%
- Percentage of males in architecture and engineering occupations:
Here: 3.8% city: 2.8%
- Percentage of males in legal occupations:
Here: 1.3% city: 1.8%
- Percentage of males in arts, design, entertainment, sports, and media occupations:
Here: 4.5% city: 2.2%
- Percentage of males in healthcare practitioners and technical occupations:
Here: 7.3% city: 2.7%
- Percentage of males in sales and office occupations:
Here: 17.3% city: 14.9%
- Percentage of males in construction, extraction, and maintenance occupations:
Here: 11.4% city: 15.2%
- Percentage of males in production occupations:
Here: 12.6% city: 5.0%
Occupations of females:
- Percentage of females in management occupations (except farmers):
Here: 1.2% city: 9.6%
- Percentage of females in business and financial operations occupations:
Here: 5.0% city: 8.4%
- Percentage of females in computer and mathematical occupations:
Here: 5.5% city: 2.0%
- Percentage of females in legal occupations:
Here: 11.1% city: 1.8%
- Percentage of females in education, training, and library occupations:
Here: 9.2% city: 7.1%
- Percentage of females in healthcare practitioners and technical occupations:
Here: 9.6% city: 7.7%
- Percentage of females in service occupations:
Here: 5.3% city: 20.5%
- Percentage of females in sales and office occupations:
Here: 45.9% city: 27.7%
- Percentage of females in farming, fishing, and forestry occupations:
Here: 5.0% city: 0.1%
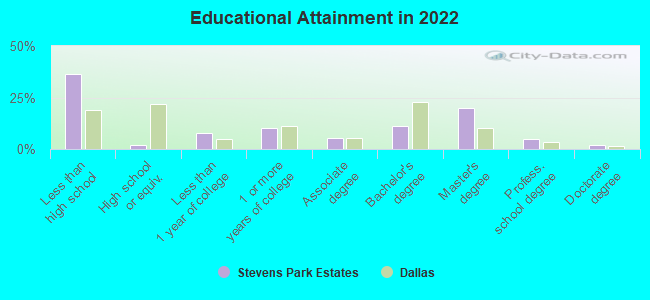
Education in this neighborhood (subdivision or community):
- Percentage of people 3 years and older in K-12 schools:
Stevens Park Estates: 31.3% Dallas: 17.3%
- Percentage of people 3 years and older in undergraduate colleges:
Stevens Park Estates: 12.5% Dallas: 4.1%
- Percentage of people 3 years and older in grad. or professional schools:
Stevens Park Estates: 2.7% Dallas: 1.7%
- Percentage of students K-12 enrolled in private schools:
Stevens Park Estates: 18.8% Dallas: 10.8%
Percentage of population below poverty level:
| Stevens Park Estates: | 6.1% |
| Dallas: | 17.8% |
Median year owner moved in (as recorded in 2022):
Median year renter moved in (as recorded in 2022):
| Stevens Park Estates: | 2010 |
| Dallas: | 2010 |
Median year renter moved in (as recorded in 2022):
| Stevens Park Estates: | 2016 |
| Dallas: | 2020 |
Percentage of married-couple families with both working:
| Stevens Park Estates: | 50.2% |
| Dallas: | 58.3% |
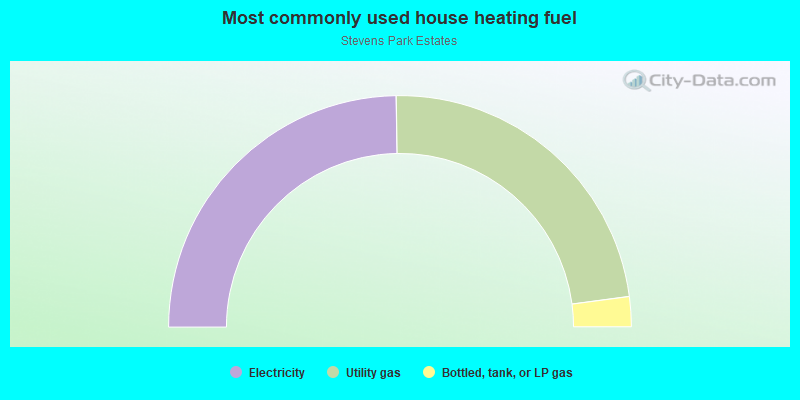
- 49.5%Electricity
- 46.3%Utility gas
- 4.2%Bottled, tank, or LP gas
Roads and streets:
N Plymouth Rd
Length: 0.89 miles
Directions: E-W, N-S, SE-NW, SW-NE
Address range: 900 to 1399
Directions: E-W, N-S, SE-NW, SW-NE
Address range: 900 to 1399
Mayflower Dr
Length: 0.42 miles
Directions: E-W, N-S, SW-NE
Address range: 1800 to 2099
Directions: E-W, N-S, SW-NE
Address range: 1800 to 2099
Fort Worth Ave
Length: 0.41 miles
Directions: E-W, SW-NE
Directions: E-W, SW-NE
N Oak Cliff Blvd
Length: 0.40 miles
Directions: N-S, SE-NW, SW-NE
Address range: 1000 to 1299
Directions: N-S, SE-NW, SW-NE
Address range: 1000 to 1299
Atlantic St
Length: 0.34 miles
Directions: E-W, SE-NW
Address range: 1800 to 2099
Directions: E-W, SE-NW
Address range: 1800 to 2099
W Colorado Blvd
Length: 0.29 miles
Direction: E-W
Address range: 1800 to 1999
Direction: E-W
Address range: 1800 to 1999
Marydale Dr (Marydale Rd)
Length: 0.22 miles
Direction: E-W
Address range: 1800 to 1999
Direction: E-W
Address range: 1800 to 1999
Tarrant Pl
Length: 0.20 miles
Directions: E-W, SE-NW
Address range: 1900 to 1999
Directions: E-W, SE-NW
Address range: 1900 to 1999
Lauraette Dr
Length: 0.18 miles
Direction: E-W
Address range: 2000 to 2099
Direction: E-W
Address range: 2000 to 2099
Old Orchard Dr
Length: 0.18 miles
Direction: E-W
Address range: 1900 to 1999
Direction: E-W
Address range: 1900 to 1999
N Hampton Rd
Length: 0.18 miles
Direction: N-S
Address range: 900 to 1098
Direction: N-S
Address range: 900 to 1098
Middlebrook Pl
Length: 0.12 miles
Directions: E-W, N-S, SE-NW, SW-NE
Address range: 1200 to 1299
Directions: E-W, N-S, SE-NW, SW-NE
Address range: 1200 to 1299
Winding Brook Cir
Length: 0.03 miles
Directions: E-W, SE-NW
Address range: 1300 to 1351
Directions: E-W, SE-NW
Address range: 1300 to 1351
Titus Pl
Length: 0.03 miles
Direction: SE-NW
Address range: 1300 to 1399
Direction: SE-NW
Address range: 1300 to 1399