Stadium Area neighborhood in Baltimore, Maryland (MD), 21230, 21201 detailed profile
Settings
X


Business Search - 14 Million verified businesses
Area: 0.166 square miles
Population: 1,250
Population density:
| Stadium Area: | 7,516 people per square mile |
| Baltimore: | 7,053 people per square mile |

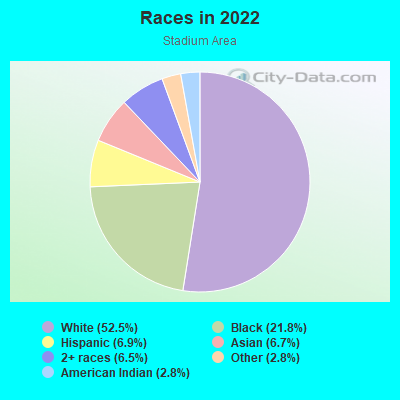
- 73752.5%White
- 30621.8%Black
- 976.9%Hispanic or Latino
- 946.7%Asian
- 916.5%Two or more races
- 392.8%American Indian
- 402.8%Some other race
Median household income in 2022:
| Stadium Area: | $86,388 |
| Baltimore: | $55,198 |
Distribution of median household income
![Distribution of median household income]()
- 102Less than $10,000
- 346$10,000 to $19,999
- 35$20,000 to $29,999
- 104$30,000 to $39,999
- 45$40,000 to $49,999
- 51$50,000 to $59,999
- 62$60,000 to $74,999
- 110$75,000 to $99,999
- 55$100,000 to $124,999
- 33$125,000 to $149,999
- 30$150,000 to $199,999
- 85$200,000 or more

Distribution of owner-occupied house/condo value
![Distribution of owner-occupied house/condo value]()
- 112Less than $50,000
- 30$50,000 to $99,999
- 68$100,000 to $149,999
- 32$150,000 to $199,999
- 35$200,000 to $249,999
- 27$250,000 to $299,999
- 81$300,000 to $399,999
- 250$400,000 to $499,999
- 102$500,000 to $749,999
- 32$750,000 to $999,999
- 30$1,000,000 or more

Distribution of rent paid by renters
![Distribution of rent paid by renters]()
- 18Less than $100
- 91$100 to $199
- 123$200 to $299
- 67$300 to $399
- 268$400 to $499
- 20$500 to $599
- 5$700 to $799
- 67$800 to $899
- 18$900 to $999
- 79$1,000 to $1,249
- 63$1,250 to $1,499
- 151$1,500 to $1,999
- 270$2,000 or more

Median rent in 2022:
| Stadium Area: | $1,573 |
| Baltimore: | $1,043 |
| Males: | 606 |
| Females: | 643 |
Males:
| This neighborhood: | 33.1 years |
| Whole city: | 35.0 years |
| This neighborhood: | 41.4 years |
| Whole city: | 38.2 years |
Average household size:
| Stadium Area: | 1.7 people |
| Baltimore: | 2.2 people |
Percentage of family households:
| Stadium Area: | 12.4% |
| Baltimore: | 34.2% |
| Here: | 15.3% |
| Baltimore: | 23.3% |
Percentage of married-couple families with children (among all households):
| Stadium Area: | 53.5% |
| Baltimore: | 22.4% |
Percentage of single-mother households (among all households):
| Stadium Area: | 147.9% |
| Baltimore: | 18.7% |
Percentage of never married males 15 years old and over:
Percentage of never married females 15 years old and over:
| Stadium Area: | 28.5% |
| Baltimore: | 25.1% |
Percentage of never married females 15 years old and over:
| Stadium Area: | 30.7% |
| city: | 27.5% |
Percentage of people that speak English not well or not at all:
| Stadium Area: | 0.3% |
| Baltimore: | 2.3% |
Percentage of people born in this state:
Percentage of people born in another U.S. state:
Percentage of native residents but born outside the U.S.:
Percentage of foreign born residents:
| Here: | 45.6% |
| Baltimore: | 64.4% |
Percentage of people born in another U.S. state:
| Stadium Area: | 43.4% |
| Baltimore: | 25.0% |
Percentage of native residents but born outside the U.S.:
| Here: | 1.0% |
| city: | 0.9% |
Percentage of foreign born residents:
| Here: | 10.0% |
| Baltimore: | 9.7% |
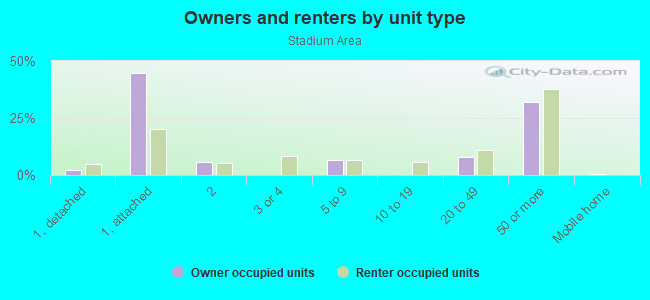
Owner-occupied
Renter-occupied

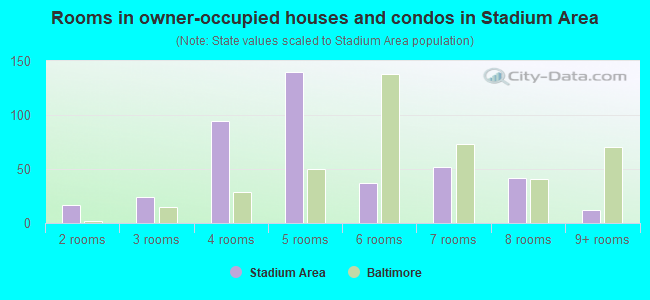
- Rooms in owner-occupied houses and condos in Stadium Area
- 01 room
- 172 rooms
- 243 rooms
- 944 rooms
- 1405 rooms
- 376 rooms
- 527 rooms
- 428 rooms
- 129+ rooms
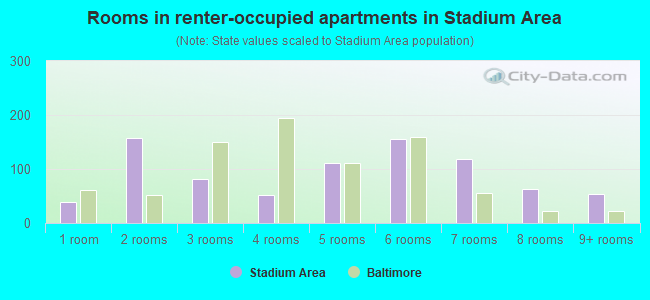
- Rooms in renter-occupied apartments in Stadium Area
- 381 room
- 1582 rooms
- 823 rooms
- 514 rooms
- 1125 rooms
- 1556 rooms
- 1187 rooms
- 638 rooms
- 539+ rooms
Owner-occupied
Renter-occupied
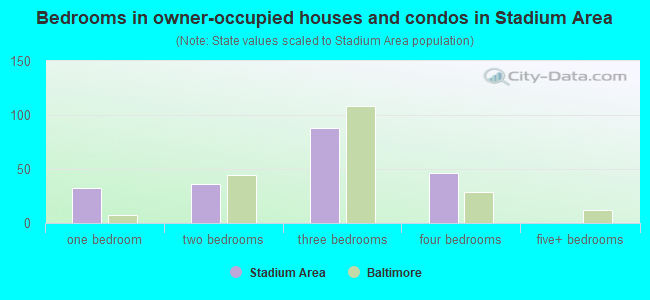
- Bedrooms in owner-occupied houses and condos in Stadium Area
- 0no bedroom
- 321 bedroom
- 362 bedrooms
- 883 bedrooms
- 464 bedrooms
- 05+ bedrooms
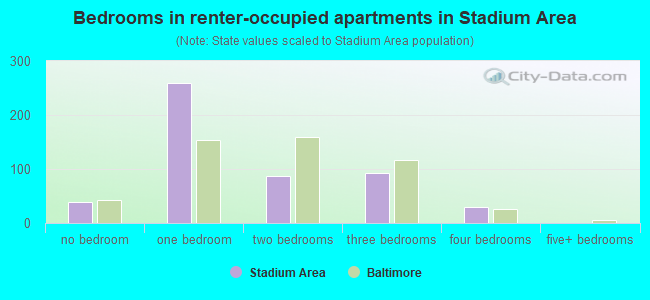
- Bedrooms in renter-occupied apartments in Stadium Area
- 38no bedroom
- 2591 bedroom
- 872 bedrooms
- 923 bedrooms
- 294 bedrooms
- 05+ bedrooms
Average number of cars or other vehicles available in houses/condos:
Average number of cars or other vehicles available in apartments:
| This neighborhood: | 1.4 |
| Baltimore: | 1.5 |
Average number of cars or other vehicles available in apartments:
| Here: | 1.0 |
| city: | 0.8 |
Percentage of units with a mortgage:
| Stadium Area: | 60.1% |
| Baltimore: | 64.3% |
Average estimated value of townhouses or other attached units in 2022 (36.9% of all units):
| This neighborhood: | $465,908 |
| city: | $206,258 |
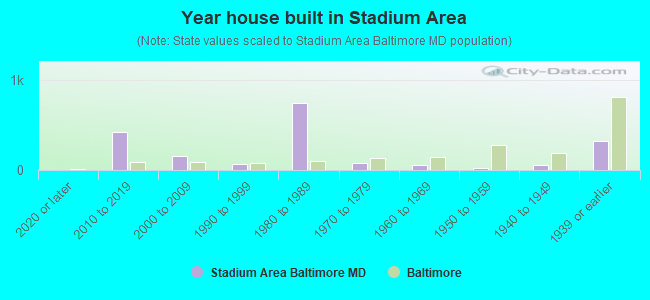
- Year house built in Stadium Area
- 02020 or later
- 4182010 to 2019
- 1602000 to 2009
- 651990 to 1999
- 7411980 to 1989
- 731970 to 1979
- 601960 to 1969
- 231950 to 1959
- 551940 to 1949
- 3201939 or earlier
Travel time to work (commute)
![Travel time to work (commute)]()
- 2Less than 5 minutes
- 215 to 9 minutes
- 6610 to 14 minutes
- 9715 to 19 minutes
- 4820 to 24 minutes
- 1825 to 29 minutes
- 4430 to 34 minutes
- 3135 to 39 minutes
- 1540 to 44 minutes
- 4345 to 59 minutes
- 2260 to 89 minutes
- 1290 or more minutes

Means of transportation to work
![Means of transportation to work]()
- 50.0%390Drove a car alone
- 3.5%27Carpooled
- 6.0%47Bus
- 0.1%1Subway or elevated rail
- 3.1%24Long-distance train or commuter rail
- 0.3%2Light rail, streetcar or trolley
- 0.1%1Taxi
- 8.1%63Bicycle
- 19.2%150Walked
- 1.4%11Other means
- 16.7%130Worked at home

Time leaving home to go to work
![Time leaving home to go to work]()
- 412:00 a.m. to 4:59 a.m.
- 35:00 a.m. to 5:29 a.m.
- 25:30 a.m. to 5:59 a.m.
- 336:00 a.m. to 6:29 a.m.
- 336:30 a.m. to 6:59 a.m.
- 607:00 a.m. to 7:29 a.m.
- 387:30 a.m. to 7:59 a.m.
- 668:00 a.m. to 8:29 a.m.
- 618:30 a.m. to 8:59 a.m.
- 669:00 a.m. to 9:59 a.m.
- 710:00 a.m. to 10:59 a.m.
- 711:00 a.m. to 11:59 a.m.
- 1012:00 p.m. to 3:59 p.m.
- 194:00 p.m. to 11:59 p.m.

Occupations of males:
- Percentage of males in management occupations (except farmers):
Here: 30.3% city: 10.7%
- Percentage of males in business and financial operations occupations:
Here: 14.9% city: 5.9%
- Percentage of males in computer and mathematical occupations:
Here: 12.5% city: 6.1%
- Percentage of males in architecture and engineering occupations:
Here: 1.8% city: 2.9%
- Percentage of males in arts, design, entertainment, sports, and media occupations:
Here: 3.0% city: 2.8%
- Percentage of males in healthcare practitioners and technical occupations:
Here: 8.0% city: 4.0%
- Percentage of males in service occupations:
Here: 5.3% city: 14.7%
- Percentage of males in sales and office occupations:
Here: 12.4% city: 14.2%
- Percentage of males in production occupations:
Here: 8.7% city: 4.2%
Occupations of females:
- Percentage of females in management occupations (except farmers):
Here: 13.2% city: 10.1%
- Percentage of females in business and financial operations occupations:
Here: 3.5% city: 6.6%
- Percentage of females in life, physical, and social science occupations:
Here: 3.5% city: 2.5%
- Percentage of females in education, training, and library occupations:
Here: 10.4% city: 10.7%
- Percentage of females in arts, design, entertainment, sports, and media occupations:
Here: 2.0% city: 2.4%
- Percentage of females in healthcare practitioners and technical occupations:
Here: 40.6% city: 9.8%
- Percentage of females in service occupations:
Here: 19.9% city: 20.4%
- Percentage of females in sales and office occupations:
Here: 4.3% city: 22.3%
Percentage of people 16-64 in Armed Forces:
| Stadium Area: | 0.3% |
| Baltimore: | 0.4% |
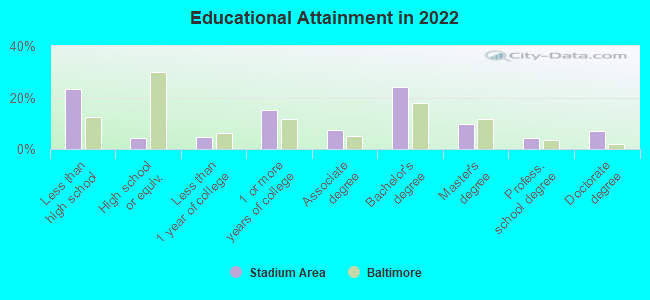
Education in this neighborhood (subdivision or community):
- Percentage of people 3 years and older in K-12 schools:
Stadium Area: 26.3% Baltimore: 14.7%
- Percentage of people 3 years and older in undergraduate colleges:
Stadium Area: 4.7% Baltimore: 6.0%
- Percentage of people 3 years and older in grad. or professional schools:
Stadium Area: 18.1% Baltimore: 2.8%
- Percentage of students K-12 enrolled in private schools:
Stadium Area: 76.2% Baltimore: 12.7%
Percentage of population below poverty level:
| Stadium Area: | 14.2% |
| Baltimore: | 18.5% |
Median year owner moved in (as recorded in 2022):
| Stadium Area: | 2015 |
| Baltimore: | 2009 |
Percentage of married-couple families with both working:
| Stadium Area: | 36.5% |
| Baltimore: | 79.2% |
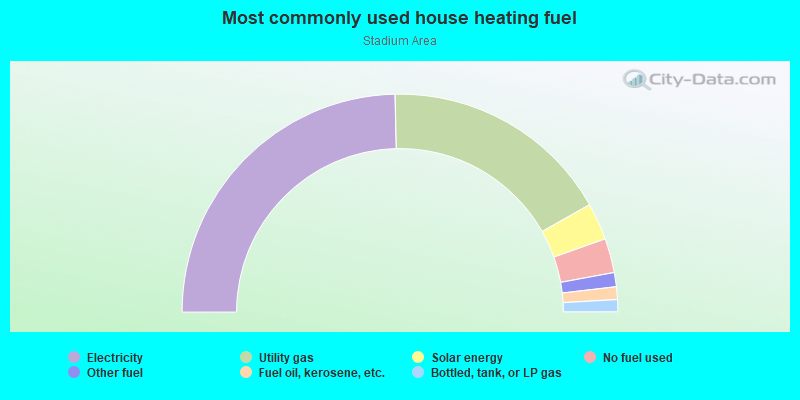
- 49.3%Electricity
- 34.3%Utility gas
- 5.5%Solar energy
- 5.1%No fuel used
- 2.1%Other fuel
- 1.9%Fuel oil, kerosene, etc.
- 1.8%Bottled, tank, or LP gas
Limited-access highways (interstate or state) in this neighborhood:
I- 395 (N Martin Luther King Jr Blvd)
Length: 1.69 miles
Directions: E-W, N-S, SE-NW, SW-NE
Address range: 400 to 1199
Directions: E-W, N-S, SE-NW, SW-NE
Address range: 400 to 1199
Highways in this neighborhood:
Eislen St (State Hwy 129)
Length: 0.06 miles
Directions: N-S, SW-NE
Address range: 400 to 451
Directions: N-S, SW-NE
Address range: 400 to 451
Roads and streets:
S Eutaw St
Length: 0.64 miles
Directions: E-W, N-S, SE-NW, SW-NE
Address range: 354 to 1299
Directions: E-W, N-S, SE-NW, SW-NE
Address range: 354 to 1299
S Howard St
Length: 0.44 miles
Directions: N-S, SW-NE
Address range: 900 to 1399
Directions: N-S, SW-NE
Address range: 900 to 1399
W Lee St
Length: 0.31 miles
Directions: E-W, N-S, SE-NW, SW-NE
Address range: 400 to 499
Directions: E-W, N-S, SE-NW, SW-NE
Address range: 400 to 499
W Hamburg St
Length: 0.22 miles
Direction: E-W
Address range: 230 to 483
Direction: E-W
Address range: 230 to 483
W Conway St
Length: 0.20 miles
Directions: E-W, N-S, SE-NW, SW-NE
Address range: 400 to 563
Directions: E-W, N-S, SE-NW, SW-NE
Address range: 400 to 563
W West St
Length: 0.19 miles
Direction: E-W
Address range: 200 to 499
Direction: E-W
Address range: 200 to 499
Houser St
Length: 0.11 miles
Direction: E-W
Address range: 400 to 599
Direction: E-W
Address range: 400 to 599
W Cross St
Length: 0.07 miles
Directions: E-W, N-S, SE-NW
Address range: 214 to 299
Directions: E-W, N-S, SE-NW
Address range: 214 to 299
Briscoe St
Length: 0.05 miles
Directions: E-W, N-S, SE-NW
Directions: E-W, N-S, SE-NW
S Paca St
Length: 0.04 miles
Direction: SE-NW
Address range: 300 to 499
Direction: SE-NW
Address range: 300 to 499
Railroad features:
Baltimore and Ohio RR
Length: 1.35 miles
Directions: N-S, SE-NW, SW-NE
Directions: N-S, SE-NW, SW-NE