St. Vincent's Historic District neighborhood in Vallejo, California (CA), 94590 detailed profile
Settings
X


Business Search - 14 Million verified businesses
Area: 0.210 square miles
Population: 985
Population density:
| St. Vincent's Historic District: | 4,686 people per square mile |
| Vallejo: | 4,094 people per square mile |

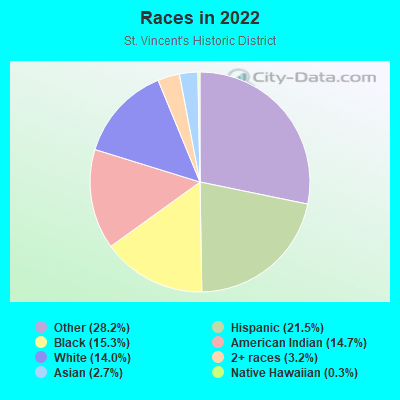
- 47828.2%Some other race
- 36521.5%Hispanic or Latino
- 26015.3%Black
- 25014.7%American Indian
- 23714.0%White
- 543.2%Two or more races
- 462.7%Asian
- 50.3%Native Hawaiian and Other
Pacific Islander
Distribution of median household income
![Distribution of median household income]()
- 32Less than $10,000
- 54$10,000 to $19,999
- 44$20,000 to $29,999
- 77$30,000 to $39,999
- 49$40,000 to $49,999
- 93$50,000 to $59,999
- 30$60,000 to $74,999
- 27$75,000 to $99,999
- 33$100,000 to $124,999
- 14$125,000 to $149,999
- 27$150,000 to $199,999
- 29$200,000 or more

Distribution of owner-occupied house/condo value
![Distribution of owner-occupied house/condo value]()
- 8$200,000 to $249,999
- 41$250,000 to $299,999
- 53$300,000 to $399,999
- 17$400,000 to $499,999
- 43$500,000 to $749,999
- 8$750,000 to $999,999
- 17$1,000,000 or more

Distribution of rent paid by renters
![Distribution of rent paid by renters]()
- 37$100 to $199
- 28$200 to $299
- 70$300 to $399
- 54$400 to $499
- 21$500 to $599
- 33$600 to $699
- 37$700 to $799
- 48$800 to $899
- 25$900 to $999
- 79$1,000 to $1,249
- 65$1,250 to $1,499
- 98$1,500 to $1,999
- 57$2,000 or more

Median rent in 2022:
| St. Vincent's Historic District: | $1,376 |
| Vallejo: | $1,780 |
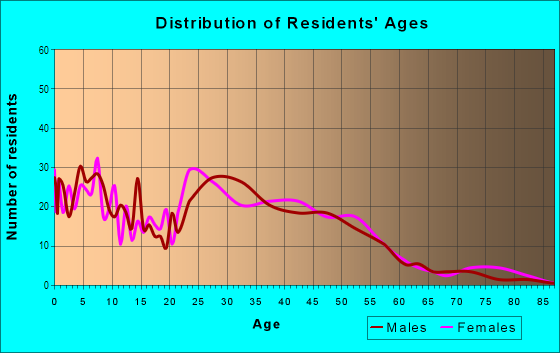
| Males: | 547 |
| Females: | 438 |
Males:
| This neighborhood: | 39.3 years |
| Whole city: | 39.4 years |
| This neighborhood: | 44.5 years |
| Whole city: | 43.4 years |
Average household size:
| St. Vincent's Historic District: | 2.3 people |
| Vallejo: | 2.6 people |
Percentage of family households:
| St. Vincent's Historic District: | 40.3% |
| Vallejo: | 44.4% |
| Here: | 21.7% |
| Vallejo: | 39.4% |
Percentage of married-couple families with children (among all households):
| St. Vincent's Historic District: | 19.8% |
| Vallejo: | 19.6% |
Percentage of single-mother households (among all households):
| St. Vincent's Historic District: | 16.2% |
| Vallejo: | 13.8% |
Percentage of never married males 15 years old and over:
Percentage of never married females 15 years old and over:
| St. Vincent's Historic District: | 25.1% |
| Vallejo: | 21.9% |
Percentage of never married females 15 years old and over:
| St. Vincent's Historic District: | 24.7% |
| city: | 16.3% |
Percentage of people that speak English not well or not at all:
| St. Vincent's Historic District: | 5.4% |
| Vallejo: | 7.3% |
Percentage of people born in this state:
Percentage of people born in another U.S. state:
Percentage of native residents but born outside the U.S.:
Percentage of foreign born residents:
| Here: | 61.9% |
| Vallejo: | 53.4% |
Percentage of people born in another U.S. state:
| St. Vincent's Historic District: | 14.3% |
| Vallejo: | 13.0% |
Percentage of native residents but born outside the U.S.:
| Here: | 2.3% |
| city: | 2.1% |
Percentage of foreign born residents:
| Here: | 21.5% |
| Vallejo: | 31.5% |
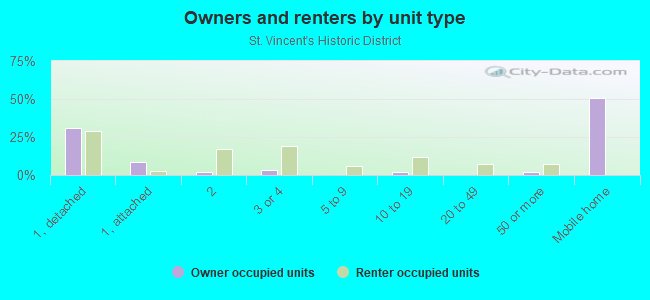
Owner-occupied
Renter-occupied

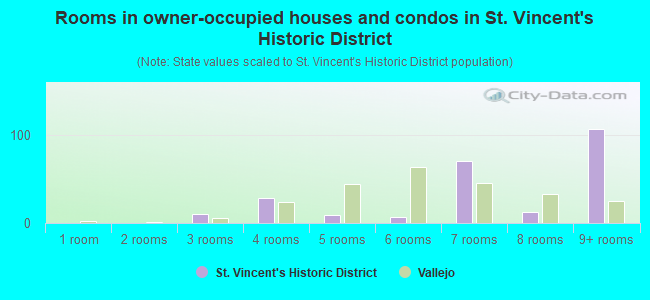
- Rooms in owner-occupied houses and condos in St. Vincent's Historic District
- 01 room
- 02 rooms
- 103 rooms
- 294 rooms
- 95 rooms
- 76 rooms
- 717 rooms
- 128 rooms
- 1079+ rooms
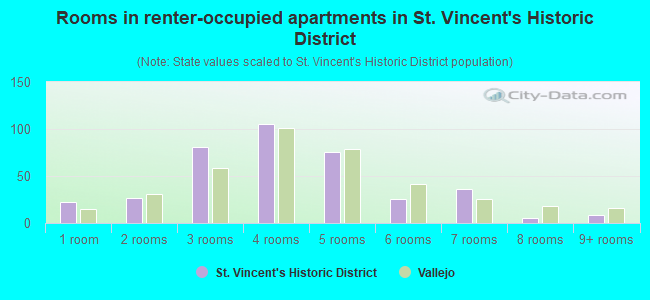
- Rooms in renter-occupied apartments in St. Vincent's Historic District
- 221 room
- 272 rooms
- 813 rooms
- 1054 rooms
- 765 rooms
- 266 rooms
- 367 rooms
- 58 rooms
- 89+ rooms
Owner-occupied
Renter-occupied
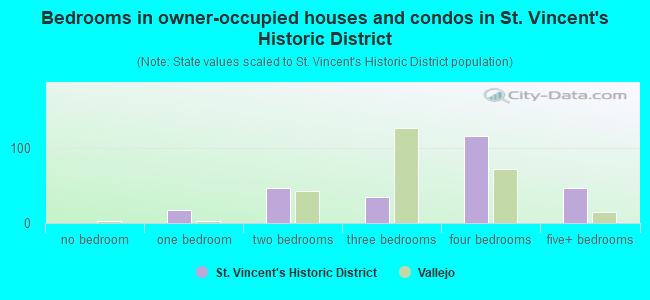
- Bedrooms in owner-occupied houses and condos in St. Vincent's Historic District
- 0no bedroom
- 171 bedroom
- 462 bedrooms
- 343 bedrooms
- 1164 bedrooms
- 475+ bedrooms
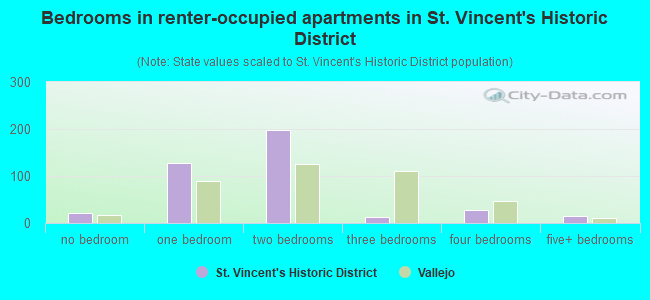
- Bedrooms in renter-occupied apartments in St. Vincent's Historic District
- 22no bedroom
- 1271 bedroom
- 1972 bedrooms
- 133 bedrooms
- 274 bedrooms
- 145+ bedrooms
Average number of cars or other vehicles available in houses/condos:
Average number of cars or other vehicles available in apartments:
| This neighborhood: | 2.0 |
| Vallejo: | 2.2 |
Average number of cars or other vehicles available in apartments:
| Here: | 1.3 |
| city: | 1.8 |
Percentage of units with a mortgage:
| St. Vincent's Historic District: | 77.0% |
| Vallejo: | 72.1% |
Average estimated value of detached houses in 2022 (38.6% of all units):
| St. Vincent's Historic District: | $664,198 |
| Vallejo: | $530,848 |
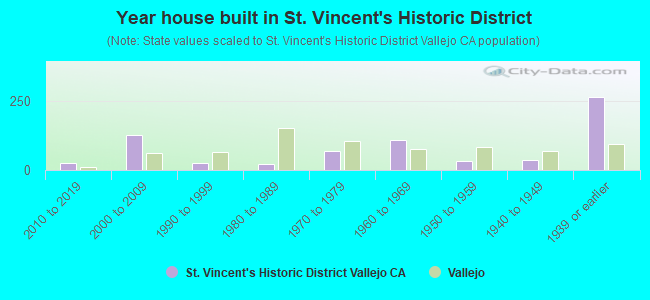
- Year house built in St. Vincent's Historic District
- 02020 or later
- 272010 to 2019
- 1272000 to 2009
- 261990 to 1999
- 231980 to 1989
- 701970 to 1979
- 1081960 to 1969
- 341950 to 1959
- 351940 to 1949
- 2621939 or earlier
City-data.com crime index for city in 2020 (higher means more crime):
| City: | 542.0 |
| U.S. average: | 219.5 |
Travel time to work (commute)
![Travel time to work (commute)]()
- 5Less than 5 minutes
- 315 to 9 minutes
- 3010 to 14 minutes
- 2915 to 19 minutes
- 3720 to 24 minutes
- 4725 to 29 minutes
- 7830 to 34 minutes
- 735 to 39 minutes
- 740 to 44 minutes
- 5545 to 59 minutes
- 6360 to 89 minutes
- 4290 or more minutes

Means of transportation to work
![Means of transportation to work]()
- 71.3%282Drove a car alone
- 8.6%34Carpooled
- 6.6%26Bus
- 1.0%4Long-distance train or commuter rail
- 6.3%25Ferryboat
- 2.5%10Bicycle
- 3.8%15Walked
- 5.1%20Other means
- 7.6%30Worked at home

Time leaving home to go to work
![Time leaving home to go to work]()
- 3412:00 a.m. to 4:59 a.m.
- 325:00 a.m. to 5:29 a.m.
- 115:30 a.m. to 5:59 a.m.
- 386:00 a.m. to 6:29 a.m.
- 396:30 a.m. to 6:59 a.m.
- 427:00 a.m. to 7:29 a.m.
- 547:30 a.m. to 7:59 a.m.
- 118:00 a.m. to 8:29 a.m.
- 308:30 a.m. to 8:59 a.m.
- 169:00 a.m. to 9:59 a.m.
- 710:00 a.m. to 10:59 a.m.
- 1611:00 a.m. to 11:59 a.m.
- 2512:00 p.m. to 3:59 p.m.
- 904:00 p.m. to 11:59 p.m.

Occupations of males:
- Percentage of males in business and financial operations occupations:
Here: 10.7% city: 3.6%
- Percentage of males in computer and mathematical occupations:
Here: 4.6% city: 3.5%
- Percentage of males in architecture and engineering occupations:
Here: 4.2% city: 1.7%
- Percentage of males in life, physical, and social science occupations:
Here: 2.3% city: 0.9%
- Percentage of males in education, training, and library occupations:
Here: 1.3% city: 2.0%
- Percentage of males in arts, design, entertainment, sports, and media occupations:
Here: 1.2% city: 2.6%
- Percentage of males in service occupations:
Here: 16.5% city: 16.8%
- Percentage of males in sales and office occupations:
Here: 18.2% city: 17.5%
- Percentage of males in construction, extraction, and maintenance occupations:
Here: 20.6% city: 11.1%
- Percentage of males in production occupations:
Here: 6.4% city: 6.9%
- Percentage of males in transportation occupations:
Here: 8.1% city: 7.9%
- Percentage of males in material moving occupations:
Here: 4.7% city: 6.0%
Occupations of females:
- Percentage of females in management occupations (except farmers):
Here: 9.0% city: 8.8%
- Percentage of females in community and social services occupations:
Here: 5.8% city: 3.7%
- Percentage of females in education, training, and library occupations:
Here: 11.5% city: 6.4%
- Percentage of females in healthcare practitioners and technical occupations:
Here: 8.8% city: 10.2%
- Percentage of females in service occupations:
Here: 32.7% city: 23.2%
- Percentage of females in sales and office occupations:
Here: 23.9% city: 27.3%
- Percentage of females in production occupations:
Here: 2.1% city: 3.9%
- Percentage of females in material moving occupations:
Here: 5.5% city: 3.0%
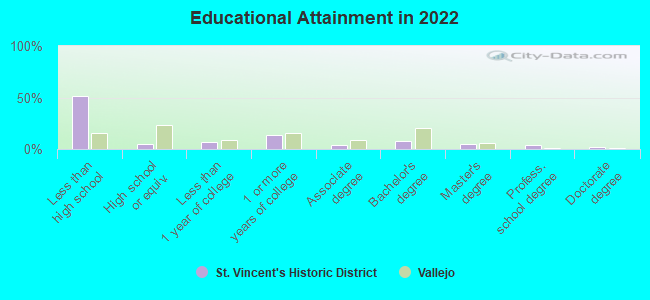
Education in this neighborhood (subdivision or community):
- Percentage of people 3 years and older in K-12 schools:
St. Vincent's Historic District: 22.2% Vallejo: 15.1%
- Percentage of people 3 years and older in undergraduate colleges:
St. Vincent's Historic District: 4.9% Vallejo: 4.9%
- Percentage of people 3 years and older in grad. or professional schools:
St. Vincent's Historic District: 5.4% Vallejo: 1.2%
- Percentage of students K-12 enrolled in private schools:
St. Vincent's Historic District: 71.0% Vallejo: 14.5%
Percentage of population below poverty level:
| St. Vincent's Historic District: | 29.4% |
| Vallejo: | 11.2% |
Median year renter moved in (as recorded in 2022):
| St. Vincent's Historic District: | 2016 |
| Vallejo: | 2019 |
Percentage of married-couple families with both working:
| St. Vincent's Historic District: | 249.5% |
| Vallejo: | 57.4% |
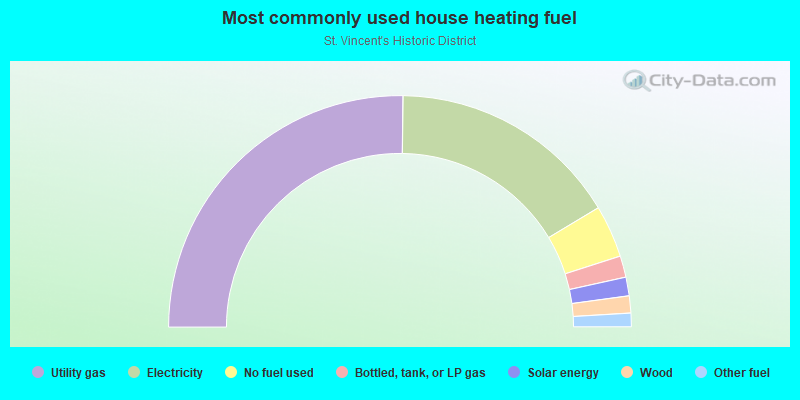
- 50.4%Utility gas
- 32.3%Electricity
- 7.3%No fuel used
- 3.0%Bottled, tank, or LP gas
- 2.6%Solar energy
- 2.4%Wood
- 1.9%Other fuel
Highways in this neighborhood:
Sonoma Blvd (State Rte 29)
Length: 0.20 miles
Direction: N-S
Address range: 2200 to 2499
Direction: N-S
Address range: 2200 to 2499
Roads and streets:
Ohio St
Length: 0.83 miles
Directions: E-W, N-S, SW-NE
Address range: 19 to 699
Directions: E-W, N-S, SW-NE
Address range: 19 to 699
Florida St
Length: 0.75 miles
Direction: E-W
Address range: 1 to 699
Direction: E-W
Address range: 1 to 699
Kentucky St
Length: 0.69 miles
Direction: E-W
Address range: 100 to 699
Direction: E-W
Address range: 100 to 699
Louisiana St
Length: 0.66 miles
Direction: E-W
Address range: 100 to 699
Direction: E-W
Address range: 100 to 699
Alabama St
Length: 0.65 miles
Direction: E-W
Address range: 1 to 599
Direction: E-W
Address range: 1 to 599
Carolina St
Length: 0.44 miles
Direction: E-W
Address range: 100 to 499
Direction: E-W
Address range: 100 to 499
Sacramento St
Length: 0.38 miles
Direction: N-S
Address range: 750 to 1299
Direction: N-S
Address range: 750 to 1299
Marin St
Length: 0.37 miles
Direction: N-S
Address range: 852 to 1399
Direction: N-S
Address range: 852 to 1399
Santa Clara St
Length: 0.34 miles
Direction: N-S
Address range: 700 to 1199
Direction: N-S
Address range: 700 to 1199
Branciforte St
Length: 0.34 miles
Direction: N-S
Address range: 500 to 999
Direction: N-S
Address range: 500 to 999
Butte St
Length: 0.27 miles
Direction: N-S
Address range: 500 to 799
Direction: N-S
Address range: 500 to 799
Trinity St
Length: 0.22 miles
Directions: E-W, N-S, SW-NE
Address range: 201 to 499
Directions: E-W, N-S, SW-NE
Address range: 201 to 499