St. Clair neighborhood in Pittsburgh, Pennsylvania (PA), 15210 detailed profile
Settings
X


Business Search - 14 Million verified businesses
Area: 0.310 square miles
Population: 304
Population density:
| St. Clair: | 982 people per square mile |
| Pittsburgh: | 5,449 people per square mile |

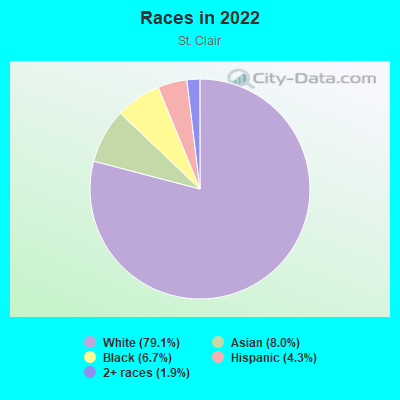
- 29679.1%White
- 308.0%Asian
- 256.7%Black
- 164.3%Hispanic or Latino
- 71.9%Two or more races
Median household income in 2022:
| St. Clair: | $51,836 |
| Pittsburgh: | $63,380 |
Distribution of median household income
![Distribution of median household income]()
- 11Less than $10,000
- 16$10,000 to $19,999
- 8$20,000 to $29,999
- 26$30,000 to $39,999
- 9$40,000 to $49,999
- 24$50,000 to $59,999
- 17$60,000 to $74,999
- 6$75,000 to $99,999
- 13$100,000 to $124,999
- 7$125,000 to $149,999
- 17$150,000 to $199,999
- 5$200,000 or more

Distribution of owner-occupied house/condo value
![Distribution of owner-occupied house/condo value]()
- 28Less than $50,000
- 30$50,000 to $99,999
- 41$100,000 to $149,999
- 27$150,000 to $199,999
- 11$200,000 to $249,999
- 6$250,000 to $299,999
- 4$300,000 to $399,999
- 4$400,000 to $499,999
- 4$500,000 to $749,999
- 4$750,000 to $999,999

Distribution of rent paid by renters
![Distribution of rent paid by renters]()
- 3$200 to $299
- 13$600 to $699
- 23$700 to $799
- 5$800 to $899
- 9$900 to $999
- 8$1,000 to $1,249
- 5$1,250 to $1,499
- 2$2,000 or more

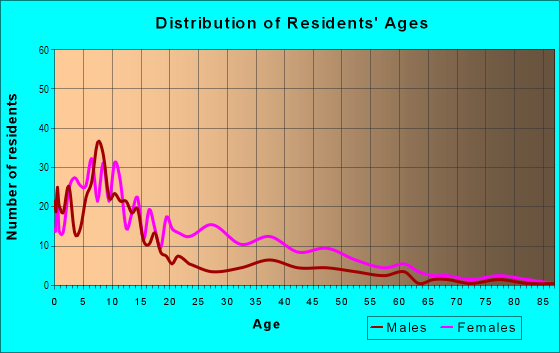
| Males: | 147 |
| Females: | 156 |
Males:
| This neighborhood: | 47.5 years |
| Whole city: | 33.3 years |
| This neighborhood: | 43.4 years |
| Whole city: | 32.9 years |
Average household size:
| St. Clair: | 22.0 people |
| Pittsburgh: | 24.0 people |
Percentage of family households:
| St. Clair: | 24.1% |
| Pittsburgh: | 28.6% |
| Here: | 37.3% |
| Pittsburgh: | 27.2% |
Percentage of married-couple families with children (among all households):
| St. Clair: | 49.5% |
| Pittsburgh: | 24.6% |
Percentage of single-mother households (among all households):
| St. Clair: | 25.5% |
| Pittsburgh: | 14.6% |
Percentage of never married males 15 years old and over:
Percentage of never married females 15 years old and over:
| St. Clair: | 13.1% |
| Pittsburgh: | 28.4% |
Percentage of never married females 15 years old and over:
| St. Clair: | 20.3% |
| city: | 27.6% |
Percentage of people that speak English not well or not at all:
| St. Clair: | 0.0% |
| Pittsburgh: | 1.2% |
Percentage of people born in this state:
Percentage of people born in another U.S. state:
Percentage of native residents but born outside the U.S.:
Percentage of foreign born residents:
| Here: | 88.5% |
| Pittsburgh: | 65.9% |
Percentage of people born in another U.S. state:
| St. Clair: | 7.3% |
| Pittsburgh: | 24.4% |
Percentage of native residents but born outside the U.S.:
| Here: | 0.1% |
| city: | 1.5% |
Percentage of foreign born residents:
| Here: | 4.1% |
| Pittsburgh: | 8.2% |
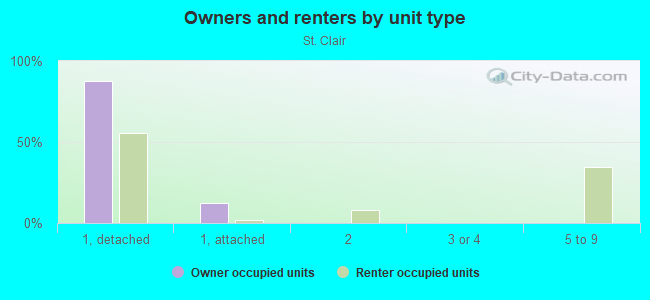
Owner-occupied
Renter-occupied

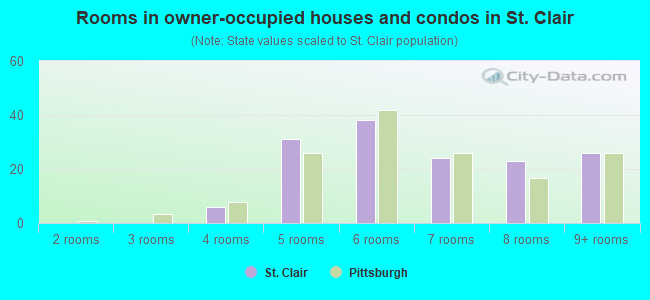
- Rooms in owner-occupied houses and condos in St. Clair
- 01 room
- 02 rooms
- 03 rooms
- 64 rooms
- 315 rooms
- 386 rooms
- 247 rooms
- 238 rooms
- 269+ rooms
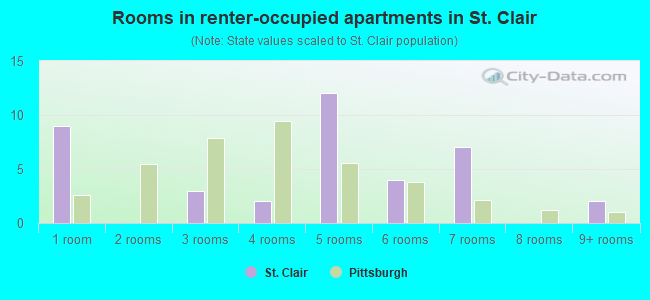
- Rooms in renter-occupied apartments in St. Clair
- 91 room
- 02 rooms
- 33 rooms
- 24 rooms
- 125 rooms
- 46 rooms
- 77 rooms
- 08 rooms
- 29+ rooms
Owner-occupied
Renter-occupied
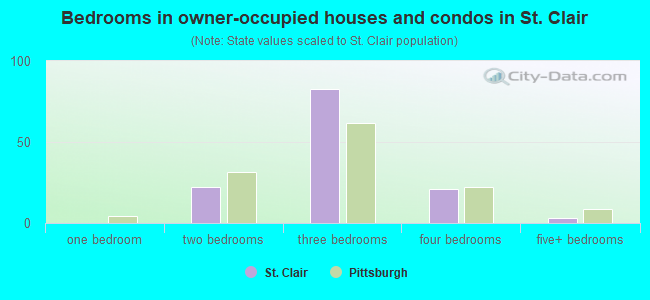
- Bedrooms in owner-occupied houses and condos in St. Clair
- 0no bedroom
- 01 bedroom
- 222 bedrooms
- 833 bedrooms
- 214 bedrooms
- 35+ bedrooms
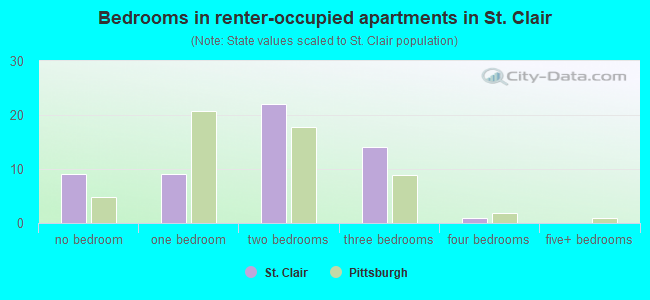
- Bedrooms in renter-occupied apartments in St. Clair
- 9no bedroom
- 91 bedroom
- 222 bedrooms
- 143 bedrooms
- 14 bedrooms
- 05+ bedrooms
Average number of cars or other vehicles available in houses/condos:
Average number of cars or other vehicles available in apartments:
| This neighborhood: | 1.6 |
| Pittsburgh: | 1.5 |
Average number of cars or other vehicles available in apartments:
| Here: | 1.7 |
| city: | 0.9 |
Percentage of units with a mortgage:
| St. Clair: | 53.8% |
| Pittsburgh: | 56.7% |
Housing prices:
- Average estimated value of detached houses in 2022 (88.0% of all units):
St. Clair: $177,031 Pittsburgh: $225,939
- Average estimated value of townhouses or other attached units in 2022 (10.0% of all units):
This neighborhood: $173,710 city: $258,058
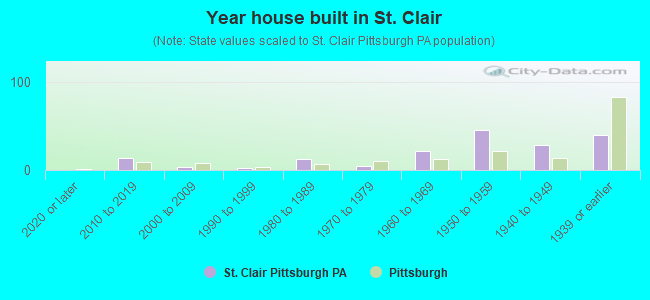
- Year house built in St. Clair
- 02020 or later
- 142010 to 2019
- 32000 to 2009
- 21990 to 1999
- 121980 to 1989
- 41970 to 1979
- 221960 to 1969
- 461950 to 1959
- 281940 to 1949
- 401939 or earlier
City-data.com crime index for city in 2019 (higher means more crime):
| City: | 257.1 |
| U.S. average: | 223.9 |
Travel time to work (commute)
![Travel time to work (commute)]()
- 125 to 9 minutes
- 1810 to 14 minutes
- 7915 to 19 minutes
- 11020 to 24 minutes
- 4825 to 29 minutes
- 8030 to 34 minutes
- 1435 to 39 minutes
- 1440 to 44 minutes
- 2945 to 59 minutes
- 2660 to 89 minutes
- 790 or more minutes

Means of transportation to work
![Means of transportation to work]()
- 88.5%153Drove a car alone
- 23.1%40Carpooled
- 4.1%7Bus
- 0.6%1Subway or elevated rail
- 1.7%3Walked
- 9.8%17Worked at home

Time leaving home to go to work
![Time leaving home to go to work]()
- 4112:00 a.m. to 4:59 a.m.
- 165:00 a.m. to 5:29 a.m.
- 185:30 a.m. to 5:59 a.m.
- 596:00 a.m. to 6:29 a.m.
- 866:30 a.m. to 6:59 a.m.
- 507:00 a.m. to 7:29 a.m.
- 557:30 a.m. to 7:59 a.m.
- 478:00 a.m. to 8:29 a.m.
- 268:30 a.m. to 8:59 a.m.
- 109:00 a.m. to 9:59 a.m.
- 310:00 a.m. to 10:59 a.m.
- 611:00 a.m. to 11:59 a.m.
- 812:00 p.m. to 3:59 p.m.
- 224:00 p.m. to 11:59 p.m.

Occupations of males:
- Percentage of males in management occupations (except farmers):
Here: 5.0% city: 11.1%
- Percentage of males in business and financial operations occupations:
Here: 2.0% city: 8.0%
- Percentage of males in computer and mathematical occupations:
Here: 7.0% city: 9.0%
- Percentage of males in architecture and engineering occupations:
Here: 10.4% city: 3.4%
- Percentage of males in life, physical, and social science occupations:
Here: 3.0% city: 2.7%
- Percentage of males in community and social services occupations:
Here: 4.0% city: 1.6%
- Percentage of males in legal occupations:
Here: 12.4% city: 1.8%
- Percentage of males in education, training, and library occupations:
Here: 6.0% city: 7.0%
- Percentage of males in healthcare practitioners and technical occupations:
Here: 12.2% city: 6.1%
- Percentage of males in service occupations:
Here: 18.0% city: 14.7%
- Percentage of males in sales and office occupations:
Here: 13.0% city: 12.2%
- Percentage of males in construction, extraction, and maintenance occupations:
Here: 21.0% city: 5.0%
- Percentage of males in production occupations:
Here: 7.2% city: 3.3%
- Percentage of males in transportation occupations:
Here: 9.0% city: 4.4%
- Percentage of males in material moving occupations:
Here: 15.6% city: 3.8%
Occupations of females:
- Percentage of females in management occupations (except farmers):
Here: 8.3% city: 8.7%
- Percentage of females in business and financial operations occupations:
Here: 15.9% city: 8.1%
- Percentage of females in architecture and engineering occupations:
Here: 2.8% city: 1.2%
- Percentage of females in life, physical, and social science occupations:
Here: 2.2% city: 2.1%
- Percentage of females in community and social services occupations:
Here: 9.8% city: 3.4%
- Percentage of females in education, training, and library occupations:
Here: 8.3% city: 9.9%
- Percentage of females in healthcare practitioners and technical occupations:
Here: 3.2% city: 10.9%
- Percentage of females in service occupations:
Here: 33.1% city: 20.1%
- Percentage of females in sales and office occupations:
Here: 21.0% city: 23.5%
- Percentage of females in production occupations:
Here: 1.3% city: 1.3%
- Percentage of females in transportation occupations:
Here: 20.2% city: 0.8%
- Percentage of females in material moving occupations:
Here: 10.2% city: 1.4%
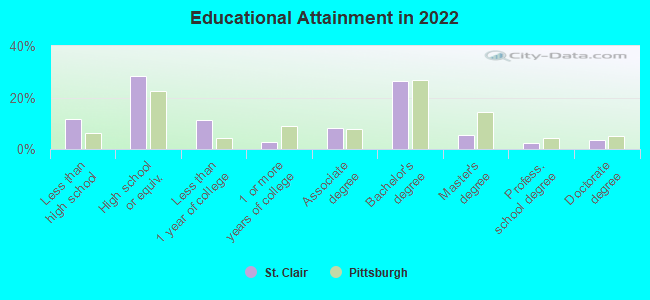
Education in this neighborhood (subdivision or community):
- Percentage of people 3 years and older in K-12 schools:
St. Clair: 20.7% Pittsburgh: 10.4%
- Percentage of people 3 years and older in undergraduate colleges:
St. Clair: 8.0% Pittsburgh: 12.9%
- Percentage of people 3 years and older in grad. or professional schools:
St. Clair: 1.0% Pittsburgh: 4.1%
- Percentage of students K-12 enrolled in private schools:
St. Clair: 16.1% Pittsburgh: 19.6%
Percentage of population below poverty level:
| St. Clair: | 4.8% |
| Pittsburgh: | 19.0% |
Median year owner moved in (as recorded in 2022):
Median year renter moved in (as recorded in 2022):
| St. Clair: | 1999 |
| Pittsburgh: | 2007 |
Median year renter moved in (as recorded in 2022):
| St. Clair: | 2013 |
| Pittsburgh: | 2020 |
Percentage of married-couple families with both working:
| St. Clair: | 179.3% |
| Pittsburgh: | 79.2% |
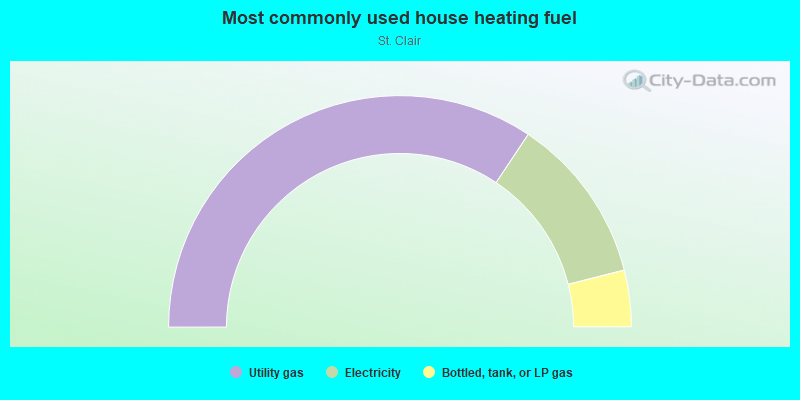
- 68.7%Utility gas
- 23.4%Electricity
- 7.9%Bottled, tank, or LP gas
Roads and streets:
Becks Run Rd
Length: 0.79 miles
Directions: E-W, N-S, SW-NE
Address range: 569 to 976
Directions: E-W, N-S, SW-NE
Address range: 569 to 976
Fisher St
Length: 0.63 miles
Directions: E-W, N-S, SE-NW, SW-NE
Address range: 700 to 1199
Directions: E-W, N-S, SE-NW, SW-NE
Address range: 700 to 1199
Cresswell St
Length: 0.47 miles
Directions: E-W, SE-NW, SW-NE
Address range: 731 to 1199
Directions: E-W, SE-NW, SW-NE
Address range: 731 to 1199
Bonifay St
Length: 0.35 miles
Directions: E-W, N-S, SE-NW, SW-NE
Address range: 100 to 398
Directions: E-W, N-S, SE-NW, SW-NE
Address range: 100 to 398
Henger St
Length: 0.18 miles
Direction: E-W
Address range: 800 to 999
Direction: E-W
Address range: 800 to 999
Kohne St
Length: 0.15 miles
Directions: N-S, SE-NW
Address range: 500 to 599
Directions: N-S, SE-NW
Address range: 500 to 599
Pliny Way
Length: 0.10 miles
Direction: E-W
Address range: 700 to 799
Direction: E-W
Address range: 700 to 799
Engstler St
Length: 0.10 miles
Direction: N-S
Address range: 501 to 599
Direction: N-S
Address range: 501 to 599
Ormsby St
Length: 0.03 miles
Direction: E-W
Address range: 799 to 826
Direction: E-W
Address range: 799 to 826
Bebel St
Length: 0.03 miles
Direction: N-S
Direction: N-S
Schuler St
Length: 0.03 miles
Direction: E-W
Address range: 878 to 899
Direction: E-W
Address range: 878 to 899