Spring Valley neighborhood in Greensboro, North Carolina (NC), 27406 detailed profile
Settings
X


Business Search - 14 Million verified businesses
Area: 0.362 square miles
Population: 298
Population density:
| Spring Valley: | 822 people per square mile |
| Greensboro: | 2,876 people per square mile |

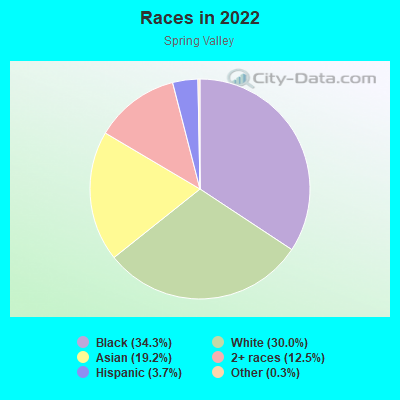
- 10234.3%Black
- 8930.0%White
- 5719.2%Asian
- 3712.5%Two or more races
- 113.7%Hispanic or Latino
- 10.3%Some other race

Median household income in 2022:
| Spring Valley: | $46,195 |
| Greensboro: | $55,120 |
Distribution of median household income
![Distribution of median household income]()
- 15Less than $10,000
- 31$10,000 to $19,999
- 57$20,000 to $29,999
- 57$30,000 to $39,999
- 23$40,000 to $49,999
- 9$50,000 to $59,999
- 12$60,000 to $74,999
- 23$75,000 to $99,999
- 19$100,000 to $124,999
- 37$125,000 to $149,999

Distribution of owner-occupied house/condo value
![Distribution of owner-occupied house/condo value]()
- 29Less than $50,000
- 73$50,000 to $99,999
- 42$100,000 to $149,999
- 74$150,000 to $199,999
- 21$200,000 to $249,999
- 3$300,000 to $399,999
- 12$1,000,000 or more

Distribution of rent paid by renters
![Distribution of rent paid by renters]()
- 3$100 to $199
- 1$200 to $299
- 17$300 to $399
- 17$400 to $499
- 29$500 to $599
- 3$600 to $699
- 10$700 to $799
- 6$800 to $899
- 14$900 to $999
- 42$1,000 to $1,249

Median rent in 2022:
| Spring Valley: | $905 |
| Greensboro: | $915 |
| Males: | 116 |
| Females: | 181 |
Males:
| This neighborhood: | 37.1 years |
| Whole city: | 32.4 years |
| This neighborhood: | 42.5 years |
| Whole city: | 35.3 years |
Average household size:
| Spring Valley: | 22.7 people |
| Greensboro: | 2.3 people |
Percentage of family households:
| Spring Valley: | 47.6% |
| Greensboro: | 43.6% |
| Here: | 32.2% |
| Greensboro: | 36.2% |
Percentage of married-couple families with children (among all households):
| Spring Valley: | 44.3% |
| Greensboro: | 22.4% |
Percentage of single-mother households (among all households):
| Spring Valley: | 281.1% |
| Greensboro: | 15.5% |
Percentage of never married males 15 years old and over:
Percentage of never married females 15 years old and over:
| Spring Valley: | 18.7% |
| Greensboro: | 20.8% |
Percentage of never married females 15 years old and over:
| Spring Valley: | 19.2% |
| city: | 23.9% |
Percentage of people that speak English not well or not at all:
| Spring Valley: | 4.5% |
| Greensboro: | 2.7% |
Percentage of people born in this state:
Percentage of people born in another U.S. state:
Percentage of native residents but born outside the U.S.:
Percentage of foreign born residents:
| Here: | 66.7% |
| Greensboro: | 52.7% |
Percentage of people born in another U.S. state:
| Spring Valley: | 21.8% |
| Greensboro: | 33.7% |
Percentage of native residents but born outside the U.S.:
| Here: | 2.0% |
| city: | 1.6% |
Percentage of foreign born residents:
| Here: | 9.6% |
| Greensboro: | 12.0% |
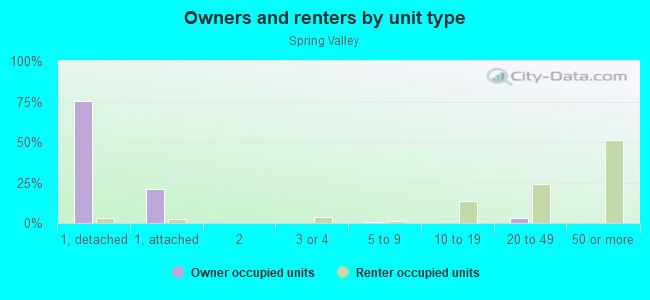
Owner-occupied
Renter-occupied

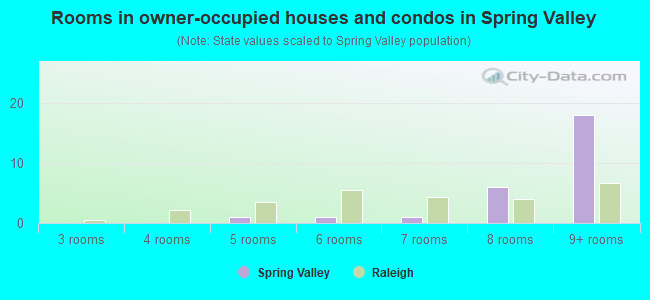
- Rooms in owner-occupied houses and condos in Spring Valley
- 31 room
- 02 rooms
- 113 rooms
- 94 rooms
- 295 rooms
- 136 rooms
- 177 rooms
- 128 rooms
- 1069+ rooms
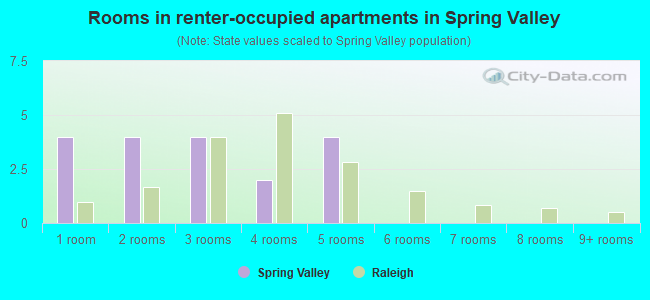
- Rooms in renter-occupied apartments in Spring Valley
- 51 room
- 42 rooms
- 43 rooms
- 174 rooms
- 95 rooms
- 86 rooms
- 687 rooms
- 08 rooms
- 09+ rooms
Owner-occupied
Renter-occupied
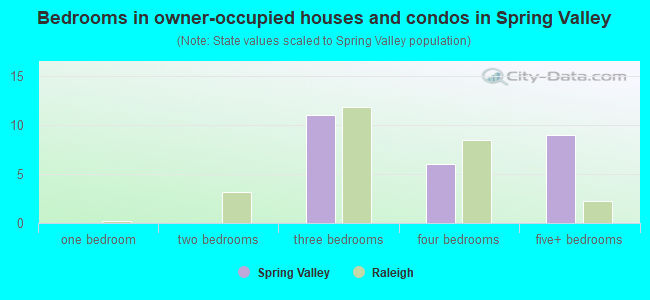
- Bedrooms in owner-occupied houses and condos in Spring Valley
- 3no bedroom
- 111 bedroom
- 222 bedrooms
- 573 bedrooms
- 34 bedrooms
- 05+ bedrooms
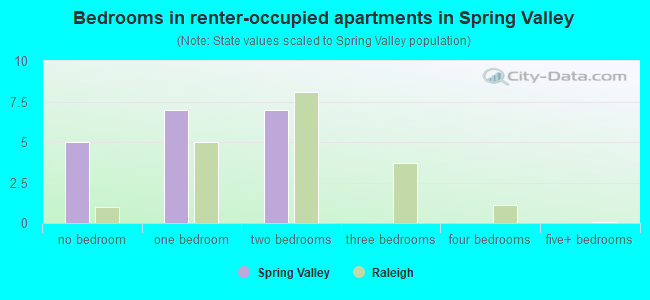
- Bedrooms in renter-occupied apartments in Spring Valley
- 8no bedroom
- 41 bedroom
- 172 bedrooms
- 173 bedrooms
- 284 bedrooms
- 05+ bedrooms
Average number of cars or other vehicles available in houses/condos:
Average number of cars or other vehicles available in apartments:
| This neighborhood: | 2.1 |
| Greensboro: | 2.0 |
Average number of cars or other vehicles available in apartments:
| Here: | 1.0 |
| city: | 1.4 |
Percentage of units with a mortgage:
| Spring Valley: | 55.4% |
| Greensboro: | 67.4% |
Average estimated value of detached houses in 2022 (82.1% of all units):
| Spring Valley: | $113,952 |
| Greensboro: | $297,193 |
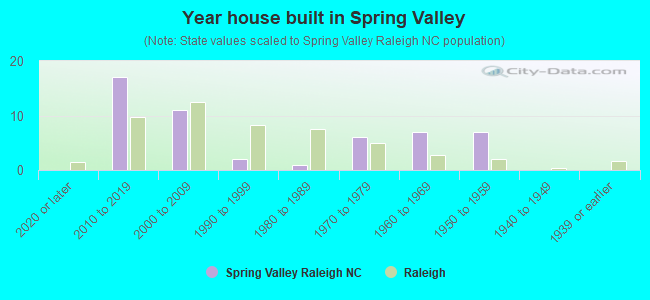
- Year house built in Spring Valley
- 02020 or later
- 282010 to 2019
- 52000 to 2009
- 111990 to 1999
- 671980 to 1989
- 331970 to 1979
- 661960 to 1969
- 321950 to 1959
- 31940 to 1949
- 121939 or earlier
City-data.com crime index for city in 2020 (higher means more crime):
| City: | 435.6 |
| U.S. average: | 219.5 |
Travel time to work (commute)
![Travel time to work (commute)]()
- 85 to 9 minutes
- 1510 to 14 minutes
- 2915 to 19 minutes
- 1220 to 24 minutes
- 825 to 29 minutes
- 630 to 34 minutes
- 140 to 44 minutes
- 545 to 59 minutes

Means of transportation to work
![Means of transportation to work]()
- 71.3%82Drove a car alone
- 24.3%28Carpooled
- 0.9%1Bus
- 0.9%1Other means
- 2.6%3Worked at home

Time leaving home to go to work
![Time leaving home to go to work]()
- 25:00 a.m. to 5:29 a.m.
- 65:30 a.m. to 5:59 a.m.
- 76:30 a.m. to 6:59 a.m.
- 127:00 a.m. to 7:29 a.m.
- 77:30 a.m. to 7:59 a.m.
- 98:00 a.m. to 8:29 a.m.
- 128:30 a.m. to 8:59 a.m.
- 59:00 a.m. to 9:59 a.m.
- 910:00 a.m. to 10:59 a.m.
- 512:00 p.m. to 3:59 p.m.
- 14:00 p.m. to 11:59 p.m.

Occupations of males:
- Percentage of males in business and financial operations occupations:
Here: 9.5% city: 4.8%
- Percentage of males in education, training, and library occupations:
Here: 3.6% city: 4.0%
- Percentage of males in healthcare practitioners and technical occupations:
Here: 2.0% city: 3.1%
- Percentage of males in service occupations:
Here: 25.0% city: 14.3%
- Percentage of males in sales and office occupations:
Here: 1.7% city: 17.1%
- Percentage of males in production occupations:
Here: 21.5% city: 7.5%
- Percentage of males in transportation occupations:
Here: 3.5% city: 6.8%
- Percentage of males in material moving occupations:
Here: 38.0% city: 9.6%
Occupations of females:
- Percentage of females in community and social services occupations:
Here: 11.2% city: 3.2%
- Percentage of females in education, training, and library occupations:
Here: 17.0% city: 10.3%
- Percentage of females in arts, design, entertainment, sports, and media occupations:
Here: 4.7% city: 1.8%
- Percentage of females in service occupations:
Here: 3.0% city: 19.4%
- Percentage of females in sales and office occupations:
Here: 58.2% city: 29.0%
- Percentage of females in production occupations:
Here: 5.9% city: 5.2%
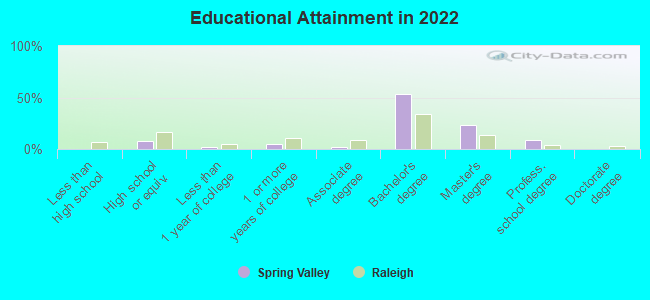
Education in this neighborhood (subdivision or community):
- Percentage of people 3 years and older in K-12 schools:
Spring Valley: 60.9% Greensboro: 17.6%
- Percentage of people 3 years and older in undergraduate colleges:
Spring Valley: 5.7% Greensboro: 11.2%
- Percentage of people 3 years and older in grad. or professional schools:
Spring Valley: 0.0% Greensboro: 2.6%
- Percentage of students K-12 enrolled in private schools:
Spring Valley: 0.0% Greensboro: 13.3%
Percentage of population below poverty level:
| Spring Valley: | 23.8% |
| Greensboro: | 21.9% |
Median year owner moved in (as recorded in 2022):
Median year renter moved in (as recorded in 2022):
| Spring Valley: | 1993 |
| Greensboro: | 2010 |
Median year renter moved in (as recorded in 2022):
| Spring Valley: | 2016 |
| Greensboro: | 2020 |
Percentage of married-couple families with both working:
| Spring Valley: | 414.9% |
| Greensboro: | 70.9% |
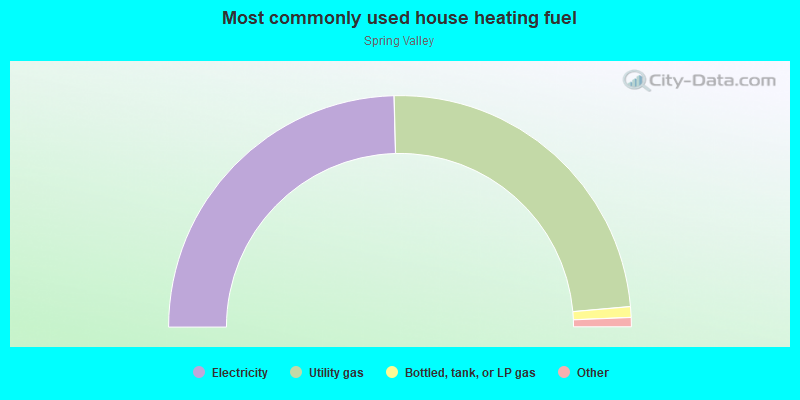
- 57.8%Utility gas
- 36.1%Electricity
- 6.1%Bottled, tank, or LP gas
Roads and streets:
W Meadowview Rd
Length: 1.22 miles
Directions: E-W, SE-NW, SW-NE
Address range: 400 to 1299
Directions: E-W, SE-NW, SW-NE
Address range: 400 to 1299
Cliffwood Dr
Length: 0.56 miles
Directions: E-W, N-S, SE-NW
Address range: 1100 to 1499
Directions: E-W, N-S, SE-NW
Address range: 1100 to 1499
Glenhaven Dr
Length: 0.50 miles
Directions: E-W, N-S, SW-NE
Address range: 2300 to 2599
Directions: E-W, N-S, SW-NE
Address range: 2300 to 2599
Kindley St
Length: 0.47 miles
Directions: E-W, SE-NW
Address range: 1100 to 1599
Directions: E-W, SE-NW
Address range: 1100 to 1599
Atlanta St
Length: 0.28 miles
Directions: E-W, N-S, SE-NW
Address range: 2405 to 2699
Directions: E-W, N-S, SE-NW
Address range: 2405 to 2699
Corregidor St
Length: 0.23 miles
Directions: E-W, N-S, SE-NW
Address range: 1400 to 1499
Directions: E-W, N-S, SE-NW
Address range: 1400 to 1499
Floyd St
Length: 0.22 miles
Directions: N-S, SE-NW
Address range: 2500 to 2699
Directions: N-S, SE-NW
Address range: 2500 to 2699
Daleview Pl
Length: 0.22 miles
Directions: E-W, SW-NE
Address range: 800 to 899
Directions: E-W, SW-NE
Address range: 800 to 899
Monterey St
Length: 0.19 miles
Direction: N-S
Address range: 2900 to 3099
Direction: N-S
Address range: 2900 to 3099
Kersey St
Length: 0.18 miles
Direction: N-S
Address range: 2406 to 2599
Direction: N-S
Address range: 2406 to 2599
Tampa St
Length: 0.15 miles
Directions: N-S, SW-NE
Address range: 2500 to 2599
Directions: N-S, SW-NE
Address range: 2500 to 2599
Memphis St
Length: 0.14 miles
Directions: E-W, SW-NE
Address range: 400 to 499
Directions: E-W, SW-NE
Address range: 400 to 499
Randleman Rd
Length: 0.12 miles
Direction: N-S
Address range: 2400 to 2417
Direction: N-S
Address range: 2400 to 2417
Woodlark Ln
Length: 0.09 miles
Directions: E-W, SW-NE
Address range: 1000 to 1099
Directions: E-W, SW-NE
Address range: 1000 to 1099
Birchcrest Dr
Length: 0.07 miles
Directions: E-W, SE-NW
Address range: 1100 to 1199
Directions: E-W, SE-NW
Address range: 1100 to 1199
Brye Ct
Length: 0.05 miles
Directions: E-W, N-S
Address range: 2400 to 2499
Directions: E-W, N-S
Address range: 2400 to 2499
Kindley Ct
Length: 0.04 miles
Direction: SW-NE
Address range: 1100 to 1199
Direction: SW-NE
Address range: 1100 to 1199
Cliffwood Ct
Length: 0.03 miles
Direction: E-W
Address range: 1000 to 1099
Direction: E-W
Address range: 1000 to 1099
Placid Ln
Length: 0.03 miles
Direction: N-S
Address range: 2300 to 2399
Direction: N-S
Address range: 2300 to 2399
Daleview Ct
Length: 0.03 miles
Direction: SE-NW
Address range: 800 to 899
Direction: SE-NW
Address range: 800 to 899
Other features:
Piedmont Crk
Length: 0.40 miles
Directions: E-W, N-S, SE-NW
Directions: E-W, N-S, SE-NW
S Buffalo Crk
Length: 0.13 miles
Directions: E-W, SW-NE
Directions: E-W, SW-NE