Spartan (Keyes) neighborhood in San Jose, California (CA), 95112 detailed profile
Settings
X

Business Search - 14 Million verified businesses
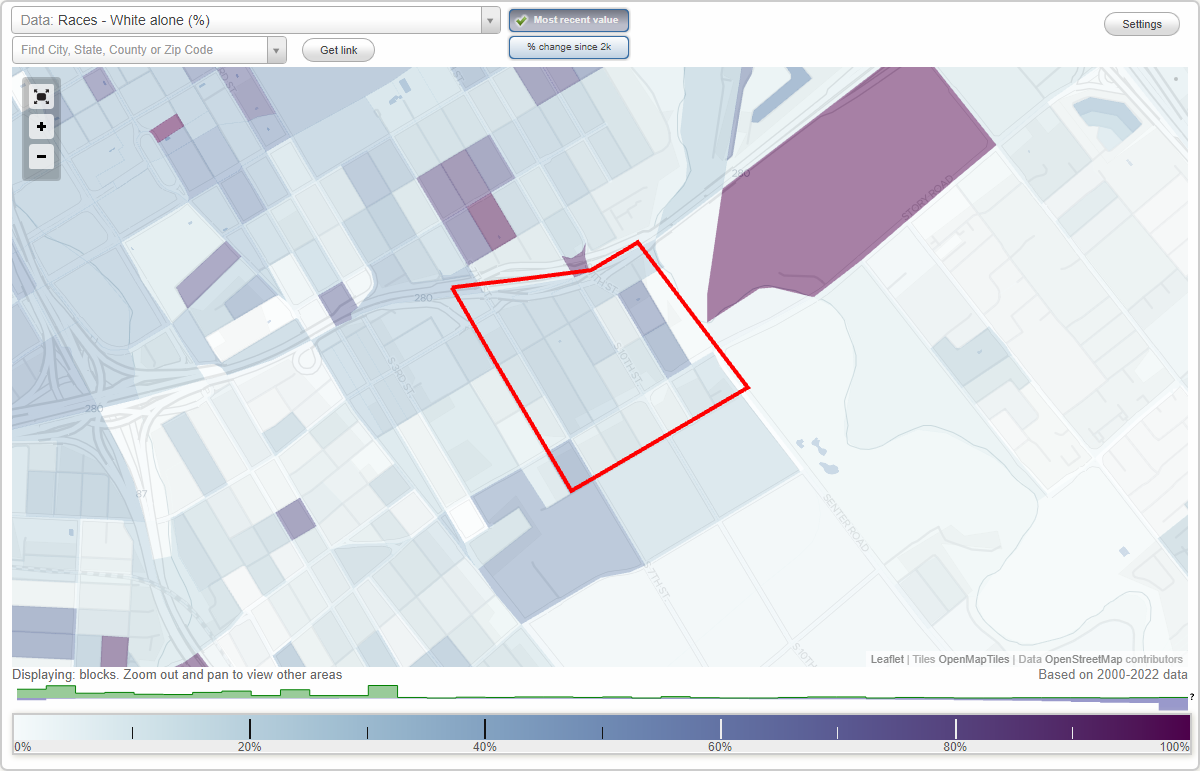
Area: 0.214 square miles
Population: 1,330
Population density:
| Spartan (Keyes): | 6,201 people per square mile |
| San Jose: | 5,554 people per square mile |

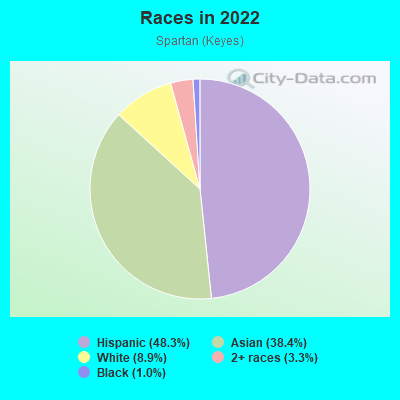
- 65948.3%Hispanic or Latino
- 52438.4%Asian
- 1228.9%White
- 453.3%Two or more races
- 141.0%Black
Median household income in 2022:
| Spartan (Keyes): | $69,309 |
| San Jose: | $133,835 |
Distribution of median household income
![Distribution of median household income]()
- 20Less than $10,000
- 55$10,000 to $19,999
- 26$20,000 to $29,999
- 28$30,000 to $39,999
- 43$40,000 to $49,999
- 21$50,000 to $59,999
- 40$60,000 to $74,999
- 67$75,000 to $99,999
- 52$100,000 to $124,999
- 24$125,000 to $149,999
- 27$150,000 to $199,999
- 40$200,000 or more

Distribution of owner-occupied house/condo value
![Distribution of owner-occupied house/condo value]()
- 12Less than $50,000
- 3$100,000 to $149,999
- 6$300,000 to $399,999
- 7$400,000 to $499,999
- 107$500,000 to $749,999
- 85$750,000 to $999,999
- 14$1,000,000 or more

Distribution of rent paid by renters
![Distribution of rent paid by renters]()
- 6Less than $100
- 6$100 to $199
- 25$200 to $299
- 17$300 to $399
- 67$500 to $599
- 7$600 to $699
- 33$700 to $799
- 10$800 to $899
- 5$900 to $999
- 11$1,000 to $1,249
- 15$1,250 to $1,499
- 71$1,500 to $1,999
- 119$2,000 or more

Median rent in 2022:
| Spartan (Keyes): | $1,842 |
| San Jose: | $2,001 |
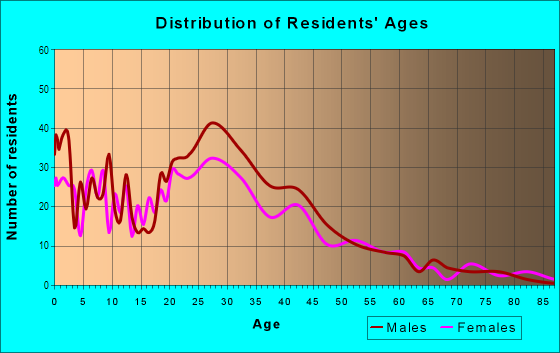
| Males: | 676 |
| Females: | 653 |
Males:
| This neighborhood: | 39.4 years |
| Whole city: | 37.6 years |
| This neighborhood: | 39.6 years |
| Whole city: | 39.1 years |
Average household size:
| Spartan (Keyes): | 3.1 people |
| San Jose: | 2.9 people |
Percentage of family households:
| Spartan (Keyes): | 48.7% |
| San Jose: | 49.9% |
| Here: | 42.2% |
| San Jose: | 53.0% |
Percentage of married-couple families with children (among all households):
| Spartan (Keyes): | 14.2% |
| San Jose: | 25.8% |
Percentage of single-mother households (among all households):
| Spartan (Keyes): | 16.6% |
| San Jose: | 5.2% |
Percentage of never married males 15 years old and over:
Percentage of never married females 15 years old and over:
| Spartan (Keyes): | 23.2% |
| San Jose: | 20.9% |
Percentage of never married females 15 years old and over:
| Spartan (Keyes): | 18.3% |
| city: | 16.7% |
Percentage of people that speak English not well or not at all:
| Spartan (Keyes): | 29.2% |
| San Jose: | 11.4% |
Percentage of people born in this state:
Percentage of people born in another U.S. state:
Percentage of native residents but born outside the U.S.:
Percentage of foreign born residents:
| Here: | 50.1% |
| San Jose: | 46.1% |
Percentage of people born in another U.S. state:
| Spartan (Keyes): | 6.1% |
| San Jose: | 10.4% |
Percentage of native residents but born outside the U.S.:
| Here: | 1.3% |
| city: | 1.7% |
Percentage of foreign born residents:
| Here: | 42.5% |
| San Jose: | 41.8% |
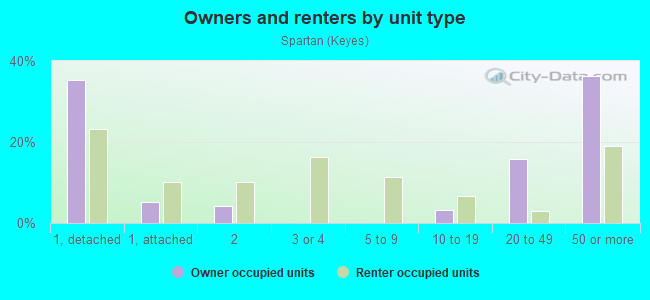
Owner-occupied
Renter-occupied

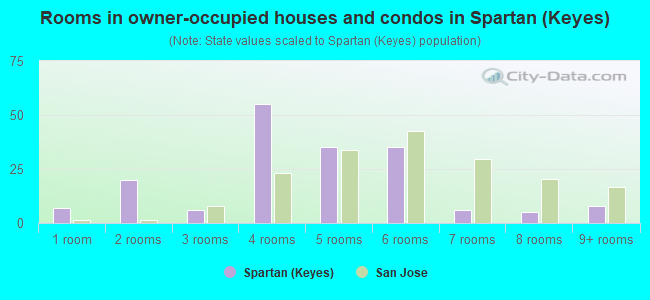
- Rooms in owner-occupied houses and condos in Spartan <
> - 71 room
- 202 rooms
- 63 rooms
- 554 rooms
- 355 rooms
- 356 rooms
- 67 rooms
- 58 rooms
- 89+ rooms
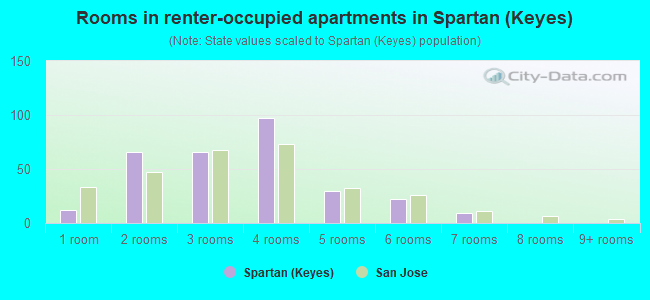
- Rooms in renter-occupied apartments in Spartan <
> - 121 room
- 662 rooms
- 663 rooms
- 974 rooms
- 305 rooms
- 226 rooms
- 97 rooms
- 08 rooms
- 09+ rooms
Owner-occupied
Renter-occupied
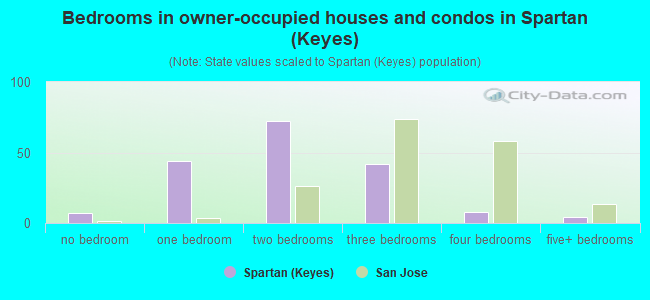
- Bedrooms in owner-occupied houses and condos in Spartan <
> - 7no bedroom
- 441 bedroom
- 722 bedrooms
- 423 bedrooms
- 84 bedrooms
- 45+ bedrooms
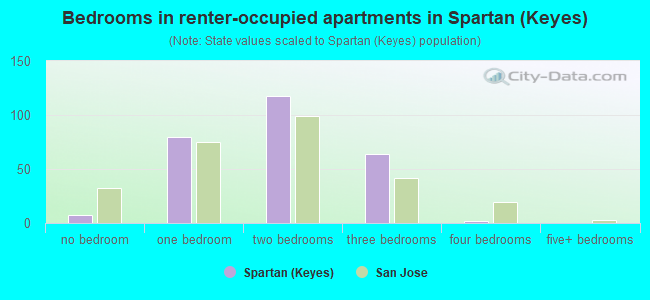
- Bedrooms in renter-occupied apartments in Spartan <
> - 7no bedroom
- 801 bedroom
- 1182 bedrooms
- 643 bedrooms
- 24 bedrooms
- 05+ bedrooms
Average number of cars or other vehicles available in houses/condos:
Average number of cars or other vehicles available in apartments:
| This neighborhood: | 2.3 |
| San Jose: | 2.3 |
Average number of cars or other vehicles available in apartments:
| Here: | 1.5 |
| city: | 1.6 |
Percentage of units with a mortgage:
| Spartan (Keyes): | 66.5% |
| San Jose: | 66.9% |
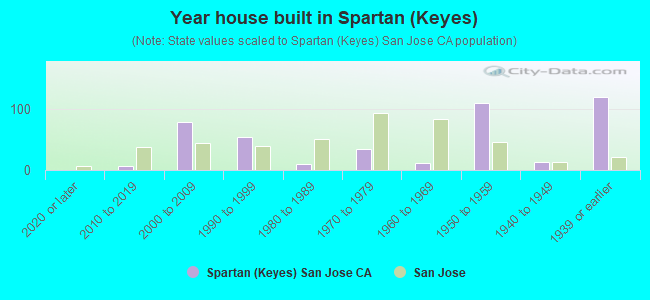
- Year house built in Spartan <
> - 02020 or later
- 62010 to 2019
- 782000 to 2009
- 541990 to 1999
- 101980 to 1989
- 341970 to 1979
- 111960 to 1969
- 1091950 to 1959
- 131940 to 1949
- 1191939 or earlier
City-data.com crime index for city in 2020 (higher means more crime):
| City: | 268.4 |
| U.S. average: | 219.5 |
Travel time to work (commute)
![Travel time to work (commute)]()
- 19Less than 5 minutes
- 875 to 9 minutes
- 17010 to 14 minutes
- 16815 to 19 minutes
- 18520 to 24 minutes
- 4325 to 29 minutes
- 20530 to 34 minutes
- 735 to 39 minutes
- 540 to 44 minutes
- 4645 to 59 minutes
- 4860 to 89 minutes
- 3890 or more minutes

Means of transportation to work
![Means of transportation to work]()
- 67.1%358Drove a car alone
- 19.5%104Carpooled
- 8.1%43Bus
- 0.7%4Long-distance train or commuter rail
- 4.9%26Walked
- 3.2%17Other means
- 6.0%32Worked at home

Time leaving home to go to work
![Time leaving home to go to work]()
- 8012:00 a.m. to 4:59 a.m.
- 475:00 a.m. to 5:29 a.m.
- 405:30 a.m. to 5:59 a.m.
- 606:00 a.m. to 6:29 a.m.
- 1406:30 a.m. to 6:59 a.m.
- 1637:00 a.m. to 7:29 a.m.
- 377:30 a.m. to 7:59 a.m.
- 1988:00 a.m. to 8:29 a.m.
- 238:30 a.m. to 8:59 a.m.
- 279:00 a.m. to 9:59 a.m.
- 4410:00 a.m. to 10:59 a.m.
- 2411:00 a.m. to 11:59 a.m.
- 11912:00 p.m. to 3:59 p.m.
- 414:00 p.m. to 11:59 p.m.

Occupations of males:
- Percentage of males in management occupations (except farmers):
Here: 12.5% city: 13.0%
- Percentage of males in computer and mathematical occupations:
Here: 3.0% city: 13.6%
- Percentage of males in architecture and engineering occupations:
Here: 8.9% city: 10.2%
- Percentage of males in life, physical, and social science occupations:
Here: 1.9% city: 1.1%
- Percentage of males in community and social services occupations:
Here: 2.6% city: 0.8%
- Percentage of males in service occupations:
Here: 24.4% city: 12.7%
- Percentage of males in sales and office occupations:
Here: 10.4% city: 12.8%
- Percentage of males in construction, extraction, and maintenance occupations:
Here: 4.0% city: 7.8%
- Percentage of males in production occupations:
Here: 13.8% city: 5.5%
- Percentage of males in transportation occupations:
Here: 2.5% city: 3.6%
- Percentage of males in material moving occupations:
Here: 11.8% city: 3.1%
Occupations of females:
- Percentage of females in management occupations (except farmers):
Here: 4.6% city: 11.0%
- Percentage of females in business and financial operations occupations:
Here: 11.1% city: 8.6%
- Percentage of females in computer and mathematical occupations:
Here: 1.5% city: 5.4%
- Percentage of females in life, physical, and social science occupations:
Here: 6.7% city: 1.7%
- Percentage of females in community and social services occupations:
Here: 1.2% city: 1.8%
- Percentage of females in legal occupations:
Here: 5.2% city: 1.3%
- Percentage of females in education, training, and library occupations:
Here: 3.7% city: 8.1%
- Percentage of females in healthcare practitioners and technical occupations:
Here: 6.0% city: 6.8%
- Percentage of females in service occupations:
Here: 33.3% city: 21.7%
- Percentage of females in sales and office occupations:
Here: 22.7% city: 22.0%
- Percentage of females in production occupations:
Here: 3.9% city: 4.0%
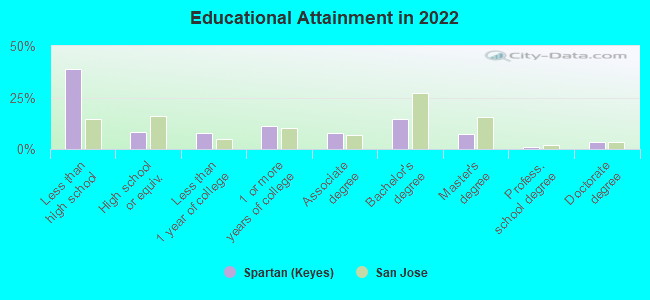
Education in this neighborhood (subdivision or community):
- Percentage of people 3 years and older in K-12 schools:
Spartan (Keyes): 18.1% San Jose: 16.1%
- Percentage of people 3 years and older in undergraduate colleges:
Spartan (Keyes): 8.0% San Jose: 6.5%
- Percentage of people 3 years and older in grad. or professional schools:
Spartan (Keyes): 2.5% San Jose: 2.0%
- Percentage of students K-12 enrolled in private schools:
Spartan (Keyes): 0.0% San Jose: 14.9%
Percentage of population below poverty level:
| Spartan (Keyes): | 16.3% |
| San Jose: | 9.0% |
Median year owner moved in (as recorded in 2022):
Median year renter moved in (as recorded in 2022):
| Spartan (Keyes): | 2004 |
| San Jose: | 2008 |
Median year renter moved in (as recorded in 2022):
| Spartan (Keyes): | 2014 |
| San Jose: | 2020 |
Percentage of married-couple families with both working:
| Spartan (Keyes): | 130.9% |
| San Jose: | 72.5% |
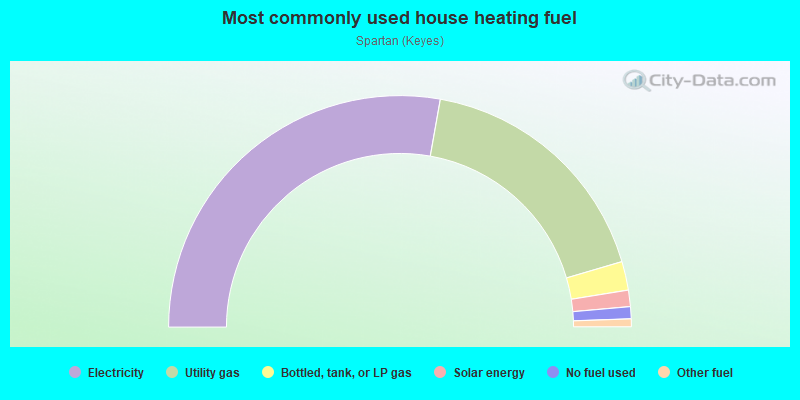
- 55.6%Electricity
- 35.3%Utility gas
- 4.0%Bottled, tank, or LP gas
- 2.3%Solar energy
- 1.7%No fuel used
- 1.1%Other fuel
Limited-access highways (interstate or state) in this neighborhood:
Sinclair Fwy (I- 280)
Length: 0.18 miles
Direction: E-W
Direction: E-W
Roads and streets:
S 9th St
Length: 0.50 miles
Direction: SE-NW
Address range: 800 to 1199
Direction: SE-NW
Address range: 800 to 1199
Keyes St
Length: 0.47 miles
Directions: E-W, SW-NE
Address range: 300 to 629
Directions: E-W, SW-NE
Address range: 300 to 629
S 10th St
Length: 0.46 miles
Direction: SE-NW
Address range: 867 to 1199
Direction: SE-NW
Address range: 867 to 1199
S 11th St
Length: 0.45 miles
Directions: E-W, SE-NW
Address range: 882 to 1199
Directions: E-W, SE-NW
Address range: 882 to 1199
S 7th St
Length: 0.44 miles
Direction: SE-NW
Address range: 751 to 1099
Direction: SE-NW
Address range: 751 to 1099
Martha St
Length: 0.43 miles
Direction: SW-NE
Address range: 300 to 899
Direction: SW-NE
Address range: 300 to 899
S 12th St
Length: 0.37 miles
Directions: N-S, SE-NW
Address range: 900 to 1199
Directions: N-S, SE-NW
Address range: 900 to 1199
S 8th St
Length: 0.35 miles
Direction: SE-NW
Address range: 800 to 1099
Direction: SE-NW
Address range: 800 to 1099
E Humboldt St
Length: 0.29 miles
Directions: E-W, N-S, SW-NE
Address range: 400 to 599
Directions: E-W, N-S, SW-NE
Address range: 400 to 599
Bestor St
Length: 0.24 miles
Direction: SW-NE
Address range: 400 to 599
Direction: SW-NE
Address range: 400 to 599
E Virginia St
Length: 0.08 miles
Directions: E-W, SW-NE
Directions: E-W, SW-NE
Spartan Ct
Length: 0.03 miles
Direction: SW-NE
Address range: 500 to 599
Direction: SW-NE
Address range: 500 to 599
Railroad features:
Union Pacific RR
Length: 0.12 miles
Direction: SE-NW
Direction: SE-NW