Southwest Industrial Park neighborhood in Fontana, California (CA), 92337 detailed profile
Settings
X


Business Search - 14 Million verified businesses
Area: 0.976 square miles
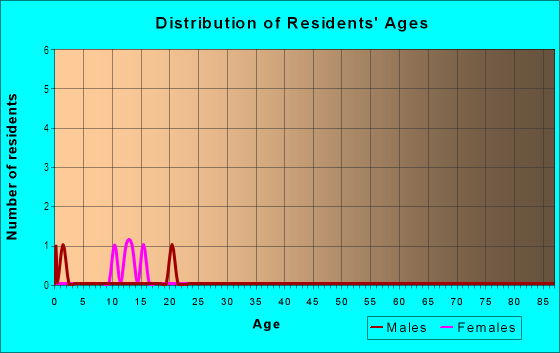
Population: 851
Population density:
| Southwest Industrial Park: | 872 people per square mile |
| Fontana: | 5,882 people per square mile |

- 70783.2%Hispanic or Latino
- 708.2%White
- 394.6%Black
- 263.1%Asian
- 80.9%Two or more races

Median household income in 2022:
| Southwest Industrial Park: | $85,607 |
| Fontana: | $93,581 |
Distribution of median household income
![Distribution of median household income]()
- 56Less than $10,000
- 9$10,000 to $19,999
- 37$20,000 to $29,999
- 59$30,000 to $39,999
- 10$40,000 to $49,999
- 10$50,000 to $59,999
- 6$60,000 to $74,999
- 73$75,000 to $99,999
- 34$100,000 to $124,999
- 13$125,000 to $149,999
- 33$150,000 to $199,999
- 10$200,000 or more

Distribution of owner-occupied house/condo value
![Distribution of owner-occupied house/condo value]()
- 57Less than $50,000
- 19$50,000 to $99,999
- 1$100,000 to $149,999
- 55$200,000 to $249,999
- 44$250,000 to $299,999
- 9$300,000 to $399,999
- 80$400,000 to $499,999
- 41$500,000 to $749,999
- 8$750,000 to $999,999
- 44$1,000,000 or more

Distribution of rent paid by renters
![Distribution of rent paid by renters]()
- 2$500 to $599
- 1$600 to $699
- 1$700 to $799
- 1$800 to $899
- 1$900 to $999
- 4$1,000 to $1,249
- 1$1,250 to $1,499
- 10$1,500 to $1,999
- 109$2,000 or more

Median rent in 2022:
| Southwest Industrial Park: | $1,593 |
| Fontana: | $1,500 |
| Males: | 357 |
| Females: | 493 |
Males:
| This neighborhood: | 35.7 years |
| Whole city: | 33.0 years |
| This neighborhood: | 35.2 years |
| Whole city: | 34.9 years |
Average household size:
| Southwest Industrial Park: | 3.6 people |
| Fontana: | 3.7 people |
Percentage of family households:
| Southwest Industrial Park: | 78.3% |
| Fontana: | 66.1% |
| Here: | 54.6% |
| Fontana: | 61.8% |
Percentage of married-couple families with children (among all households):
| Southwest Industrial Park: | 10.5% |
| Fontana: | 20.7% |
Percentage of single-mother households (among all households):
| Southwest Industrial Park: | 7.0% |
| Fontana: | 3.7% |
Percentage of never married males 15 years old and over:
Percentage of never married females 15 years old and over:
| Southwest Industrial Park: | 18.7% |
| Fontana: | 24.0% |
Percentage of never married females 15 years old and over:
| Southwest Industrial Park: | 26.6% |
| city: | 17.8% |
Percentage of people that speak English not well or not at all:
| Southwest Industrial Park: | 14.8% |
| Fontana: | 10.7% |
Percentage of people born in this state:
Percentage of people born in another U.S. state:
Percentage of native residents but born outside the U.S.:
Percentage of foreign born residents:
| Here: | 66.4% |
| Fontana: | 63.9% |
Percentage of people born in another U.S. state:
| Southwest Industrial Park: | 2.5% |
| Fontana: | 6.1% |
Percentage of native residents but born outside the U.S.:
| Here: | 1.0% |
| city: | 1.0% |
Percentage of foreign born residents:
| Here: | 30.1% |
| Fontana: | 29.1% |
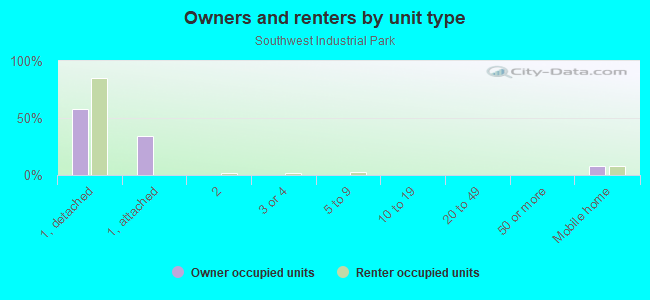
Owner-occupied
Renter-occupied

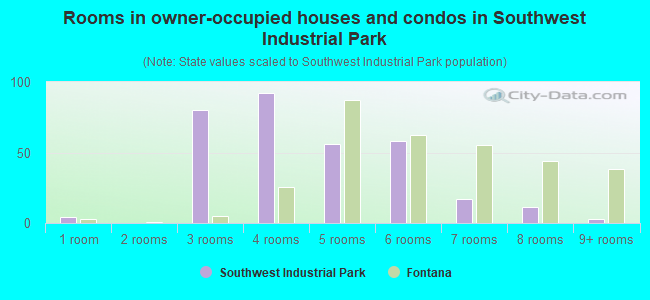
- Rooms in owner-occupied houses and condos in Southwest Industrial Park
- 41 room
- 02 rooms
- 803 rooms
- 924 rooms
- 565 rooms
- 586 rooms
- 177 rooms
- 118 rooms
- 39+ rooms
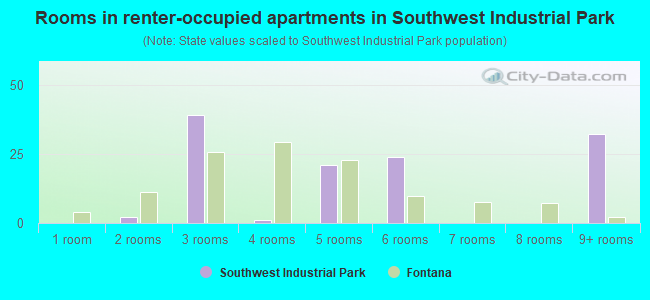
- Rooms in renter-occupied apartments in Southwest Industrial Park
- 01 room
- 22 rooms
- 393 rooms
- 14 rooms
- 215 rooms
- 246 rooms
- 07 rooms
- 08 rooms
- 329+ rooms
Owner-occupied
Renter-occupied

- Bedrooms in owner-occupied houses and condos in Southwest Industrial Park
- 4no bedroom
- 551 bedroom
- 782 bedrooms
- 693 bedrooms
- 774 bedrooms
- 255+ bedrooms
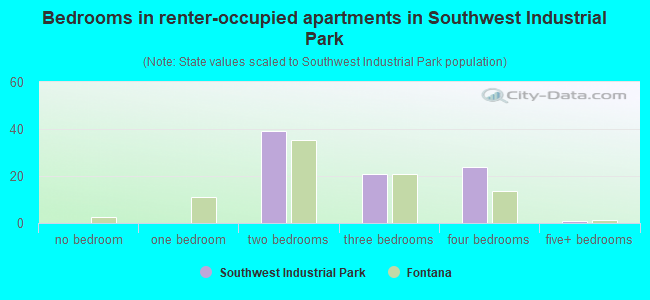
- Bedrooms in renter-occupied apartments in Southwest Industrial Park
- 0no bedroom
- 01 bedroom
- 392 bedrooms
- 213 bedrooms
- 244 bedrooms
- 15+ bedrooms
Average number of cars or other vehicles available in houses/condos:
Average number of cars or other vehicles available in apartments:
| This neighborhood: | 2.9 |
| Fontana: | 2.7 |
Average number of cars or other vehicles available in apartments:
| Here: | 2.3 |
| city: | 2.1 |
Percentage of units with a mortgage:
| Southwest Industrial Park: | 68.5% |
| Fontana: | 76.9% |
Average estimated value of detached houses in 2022 (89.5% of all units):
| Southwest Industrial Park: | $459,457 |
| California: | $988,808 |
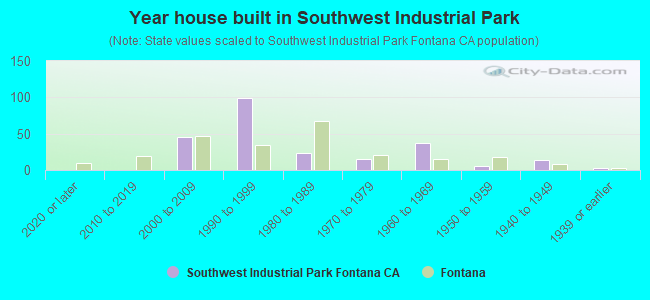
- Year house built in Southwest Industrial Park
- 02020 or later
- 02010 to 2019
- 462000 to 2009
- 991990 to 1999
- 241980 to 1989
- 151970 to 1979
- 371960 to 1969
- 61950 to 1959
- 141940 to 1949
- 31939 or earlier
City-data.com crime index for city in 2020 (higher means more crime):
| City: | 162.4 |
| U.S. average: | 219.5 |
Travel time to work (commute)
![Travel time to work (commute)]()
- 110 to 14 minutes
- 115 to 19 minutes
- 120 to 24 minutes
- 130 to 34 minutes
- 345 to 59 minutes
- 190 or more minutes

Means of transportation to work
![Means of transportation to work]()
- 68.6%304Drove a car alone
- 15.3%68Carpooled
- 0.9%4Bus
- 18.1%80Long-distance train or commuter rail
- 2.5%11Walked
- 1.6%7Other means
- 10.4%46Worked at home

Time leaving home to go to work
![Time leaving home to go to work]()
- 112:00 a.m. to 4:59 a.m.
- 15:00 a.m. to 5:29 a.m.
- 17:30 a.m. to 7:59 a.m.
- 18:00 a.m. to 8:29 a.m.
- 14:00 p.m. to 11:59 p.m.

Occupations of males:
- Percentage of males in management occupations (except farmers):
Here: 4.9% city: 8.4%
- Percentage of males in computer and mathematical occupations:
Here: 5.5% city: 1.8%
- Percentage of males in architecture and engineering occupations:
Here: 1.5% city: 1.8%
- Percentage of males in community and social services occupations:
Here: 5.0% city: 1.0%
- Percentage of males in arts, design, entertainment, sports, and media occupations:
Here: 3.2% city: 1.2%
- Percentage of males in service occupations:
Here: 19.2% city: 12.1%
- Percentage of males in sales and office occupations:
Here: 14.2% city: 14.7%
- Percentage of males in construction, extraction, and maintenance occupations:
Here: 10.1% city: 11.4%
- Percentage of males in production occupations:
Here: 23.6% city: 8.1%
- Percentage of males in transportation occupations:
Here: 1.9% city: 11.3%
- Percentage of males in material moving occupations:
Here: 9.4% city: 14.1%
Occupations of females:
- Percentage of females in management occupations (except farmers):
Here: 4.9% city: 7.4%
- Percentage of females in business and financial operations occupations:
Here: 4.8% city: 5.5%
- Percentage of females in community and social services occupations:
Here: 2.0% city: 3.3%
- Percentage of females in healthcare practitioners and technical occupations:
Here: 7.3% city: 8.8%
- Percentage of females in service occupations:
Here: 34.3% city: 20.7%
- Percentage of females in sales and office occupations:
Here: 16.8% city: 29.9%
- Percentage of females in production occupations:
Here: 7.7% city: 3.4%
- Percentage of females in material moving occupations:
Here: 20.8% city: 9.9%
Percentage of people 16-64 in Armed Forces:
| Southwest Industrial Park: | 0.3% |
| Fontana: | 0.2% |
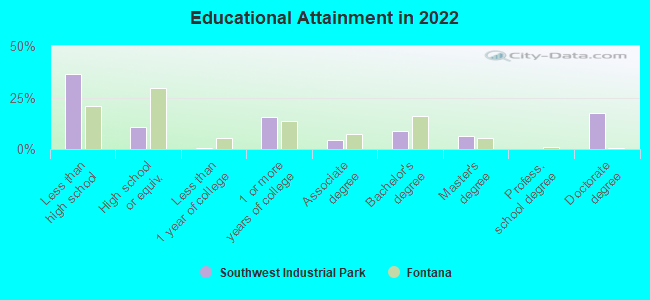
Education in this neighborhood (subdivision or community):
- Percentage of people 3 years and older in K-12 schools:
Southwest Industrial Park: 22.0% Fontana: 19.9%
- Percentage of people 3 years and older in undergraduate colleges:
Southwest Industrial Park: 13.6% Fontana: 7.2%
- Percentage of people 3 years and older in grad. or professional schools:
Southwest Industrial Park: 0.5% Fontana: 1.6%
- Percentage of students K-12 enrolled in private schools:
Southwest Industrial Park: 70.9% Fontana: 3.5%
Percentage of population below poverty level:
| Southwest Industrial Park: | 15.2% |
| Fontana: | 8.5% |
Median year owner moved in (as recorded in 2022):
Median year renter moved in (as recorded in 2022):
| Southwest Industrial Park: | 2005 |
| Fontana: | 2011 |
Median year renter moved in (as recorded in 2022):
| Southwest Industrial Park: | 2014 |
| Fontana: | 2017 |
Percentage of married-couple families with both working:
| Southwest Industrial Park: | 49.7% |
| Fontana: | 58.9% |
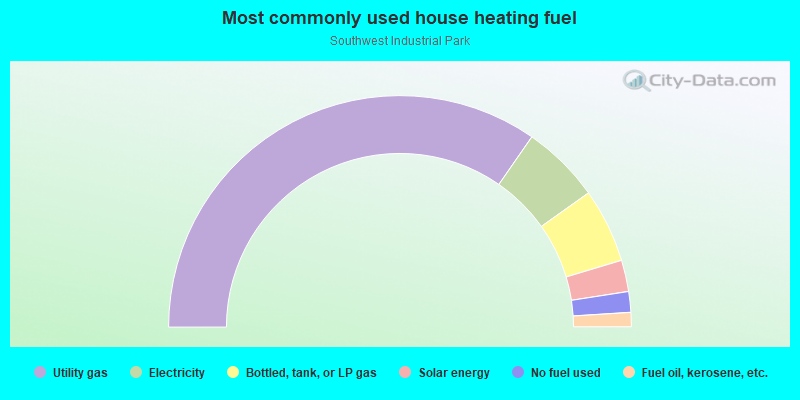
- 69.4%Utility gas
- 11.0%Electricity
- 10.4%Bottled, tank, or LP gas
- 4.4%Solar energy
- 2.9%No fuel used
- 2.0%Fuel oil, kerosene, etc.
Roads and streets:
Marlay Ave
Length: 1.01 miles
Direction: E-W
Address range: 13000 to 13699
Direction: E-W
Address range: 13000 to 13699
Mulberry Ave
Length: 0.81 miles
Direction: N-S
Address range: 11450 to 12099
Direction: N-S
Address range: 11450 to 12099
Cabernet Dr
Length: 0.52 miles
Directions: N-S, SE-NW
Address range: 11700 to 12099
Directions: N-S, SE-NW
Address range: 11700 to 12099
E Palms Ave
Length: 0.50 miles
Direction: N-S
Address range: 11700 to 12099
Direction: N-S
Address range: 11700 to 12099
Industry Ave
Length: 0.43 miles
Direction: N-S
Address range: 11600 to 12038
Direction: N-S
Address range: 11600 to 12038
Pacific Ave
Length: 0.29 miles
Direction: N-S
Address range: 11700 to 11999
Direction: N-S
Address range: 11700 to 11999
Union Ave
Length: 0.22 miles
Direction: E-W
Address range: 13001 to 13199
Direction: E-W
Address range: 13001 to 13199
Chardonnay Ct
Length: 0.17 miles
Directions: N-S, SW-NE
Address range: 11700 to 11779
Directions: N-S, SW-NE
Address range: 11700 to 11779
Chaparral Ave
Length: 0.13 miles
Direction: E-W
Address range: 13600 to 13699
Direction: E-W
Address range: 13600 to 13699
Chateau Ct
Length: 0.12 miles
Directions: E-W, N-S, SE-NW, SW-NE
Address range: 13540 to 13599
Directions: E-W, N-S, SE-NW, SW-NE
Address range: 13540 to 13599
Colombard Ct
Length: 0.10 miles
Direction: E-W
Address range: 13500 to 13579
Direction: E-W
Address range: 13500 to 13579
Railroad features:
Burlington Northern Santa Fe Rlwy
Length: 0.88 miles
Directions: E-W, N-S, SW-NE
Directions: E-W, N-S, SW-NE