South Shore neighborhood in Pittsburgh, Pennsylvania (PA), 15203, 15211, 15219 detailed profile
Settings
X


Business Search - 14 Million verified businesses
Area: 0.207 square miles
Population: 1,098
Population density:
| South Shore: | 5,316 people per square mile |
| Pittsburgh: | 5,449 people per square mile |

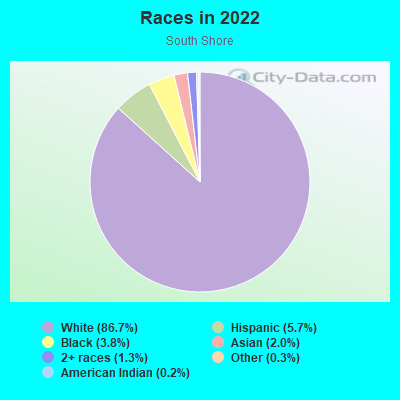
- 1,01686.7%White
- 675.7%Hispanic or Latino
- 453.8%Black
- 232.0%Asian
- 151.3%Two or more races
- 40.3%Some other race
- 20.2%American Indian
Median household income in 2022:
| South Shore: | $76,400 |
| Pittsburgh: | $63,380 |
Distribution of median household income
![Distribution of median household income]()
- 11Less than $10,000
- 151$10,000 to $19,999
- 66$20,000 to $29,999
- 25$30,000 to $39,999
- 24$40,000 to $49,999
- 61$50,000 to $59,999
- 41$60,000 to $74,999
- 36$75,000 to $99,999
- 120$100,000 to $124,999
- 39$125,000 to $149,999
- 60$150,000 to $199,999
- 95$200,000 or more

Distribution of owner-occupied house/condo value
![Distribution of owner-occupied house/condo value]()
- 59Less than $50,000
- 80$50,000 to $99,999
- 56$100,000 to $149,999
- 48$150,000 to $199,999
- 32$200,000 to $249,999
- 37$250,000 to $299,999
- 96$300,000 to $399,999
- 47$400,000 to $499,999
- 33$500,000 to $749,999
- 12$750,000 to $999,999
- 10$1,000,000 or more

Distribution of rent paid by renters
![Distribution of rent paid by renters]()
- 5$100 to $199
- 22$200 to $299
- 38$300 to $399
- 32$400 to $499
- 100$500 to $599
- 51$600 to $699
- 20$700 to $799
- 62$800 to $899
- 40$900 to $999
- 33$1,000 to $1,249
- 16$1,250 to $1,499
- 24$1,500 to $1,999
- 68$2,000 or more

Median rent in 2022:
| South Shore: | $987 |
| Pittsburgh: | $981 |
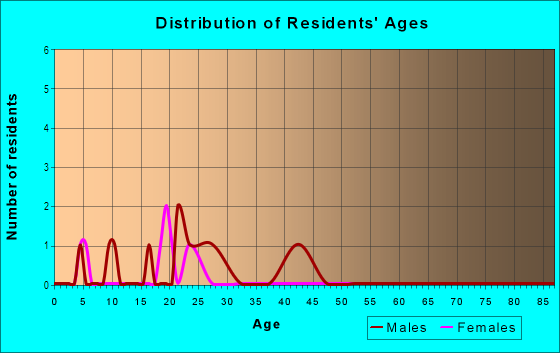
| Males: | 537 |
| Females: | 560 |
Males:
| This neighborhood: | 34.7 years |
| Whole city: | 33.3 years |
| This neighborhood: | 45.1 years |
| Whole city: | 32.9 years |
Average household size:
| South Shore: | 1.7 people |
| Pittsburgh: | 24.0 people |
Percentage of family households:
| South Shore: | 17.3% |
| Pittsburgh: | 28.6% |
| Here: | 18.9% |
| Pittsburgh: | 27.2% |
Percentage of married-couple families with children (among all households):
| South Shore: | 25.3% |
| Pittsburgh: | 24.6% |
Percentage of single-mother households (among all households):
| South Shore: | 30.0% |
| Pittsburgh: | 14.6% |
Percentage of never married males 15 years old and over:
Percentage of never married females 15 years old and over:
| South Shore: | 19.9% |
| Pittsburgh: | 28.4% |
Percentage of never married females 15 years old and over:
| South Shore: | 21.1% |
| city: | 27.6% |
Percentage of people that speak English not well or not at all:
| South Shore: | 0.0% |
| Pittsburgh: | 1.2% |
Percentage of people born in this state:
Percentage of people born in another U.S. state:
Percentage of native residents but born outside the U.S.:
Percentage of foreign born residents:
| Here: | 75.6% |
| Pittsburgh: | 65.9% |
Percentage of people born in another U.S. state:
| South Shore: | 17.6% |
| Pittsburgh: | 24.4% |
Percentage of native residents but born outside the U.S.:
| Here: | 1.3% |
| city: | 1.5% |
Percentage of foreign born residents:
| Here: | 5.5% |
| Pittsburgh: | 8.2% |
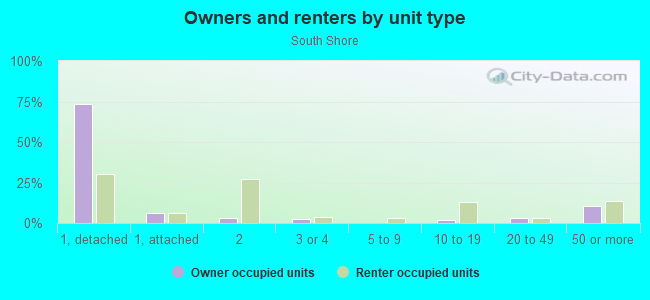
Owner-occupied
Renter-occupied

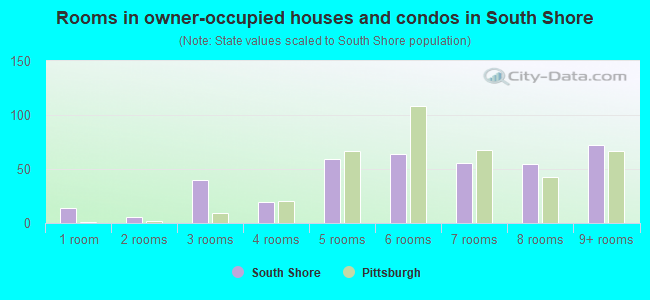
- Rooms in owner-occupied houses and condos in South Shore
- 141 room
- 62 rooms
- 403 rooms
- 194 rooms
- 595 rooms
- 646 rooms
- 567 rooms
- 558 rooms
- 729+ rooms
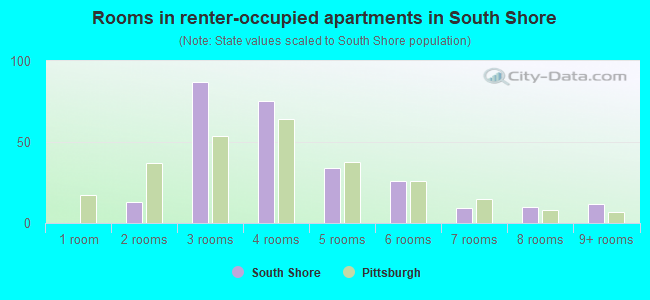
- Rooms in renter-occupied apartments in South Shore
- 01 room
- 132 rooms
- 873 rooms
- 754 rooms
- 345 rooms
- 266 rooms
- 97 rooms
- 108 rooms
- 129+ rooms
Owner-occupied
Renter-occupied
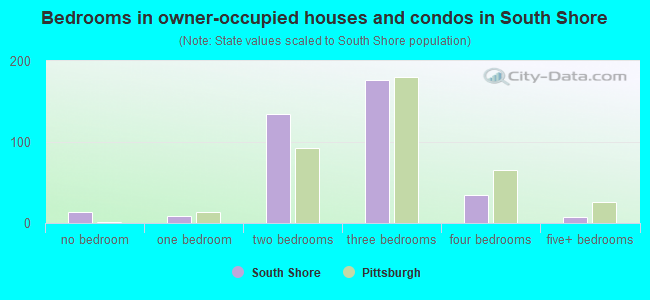
- Bedrooms in owner-occupied houses and condos in South Shore
- 14no bedroom
- 91 bedroom
- 1352 bedrooms
- 1773 bedrooms
- 354 bedrooms
- 85+ bedrooms
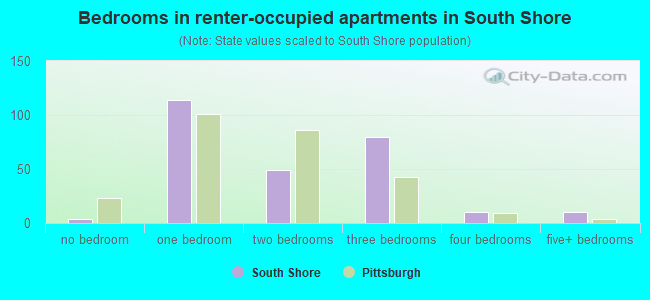
- Bedrooms in renter-occupied apartments in South Shore
- 4no bedroom
- 1141 bedroom
- 492 bedrooms
- 803 bedrooms
- 104 bedrooms
- 105+ bedrooms
Average number of cars or other vehicles available in houses/condos:
Average number of cars or other vehicles available in apartments:
| This neighborhood: | 1.5 |
| Pittsburgh: | 1.5 |
Average number of cars or other vehicles available in apartments:
| Here: | 1.3 |
| city: | 0.9 |
Percentage of units with a mortgage:
| South Shore: | 67.5% |
| Pittsburgh: | 56.7% |
Housing prices:
- Average estimated value of detached houses in 2022 (64.0% of all units):
South Shore: $199,339 Pittsburgh: $225,939
- Average estimated value of townhouses or other attached units in 2022 (7.3% of all units):
This neighborhood: $227,262 city: $258,058
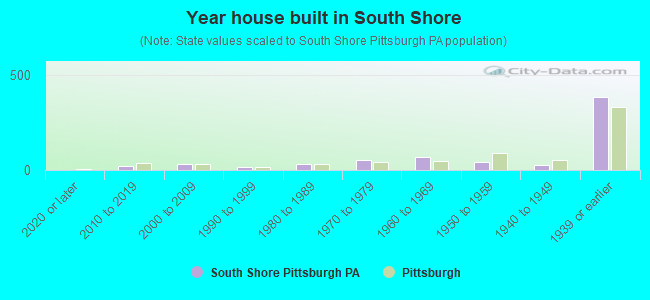
- Year house built in South Shore
- 02020 or later
- 232010 to 2019
- 322000 to 2009
- 151990 to 1999
- 311980 to 1989
- 511970 to 1979
- 681960 to 1969
- 431950 to 1959
- 271940 to 1949
- 3811939 or earlier
City-data.com crime index for city in 2019 (higher means more crime):
| City: | 257.1 |
| U.S. average: | 223.9 |
Travel time to work (commute)
![Travel time to work (commute)]()
- 15Less than 5 minutes
- 175 to 9 minutes
- 11610 to 14 minutes
- 22515 to 19 minutes
- 11520 to 24 minutes
- 8325 to 29 minutes
- 5130 to 34 minutes
- 1835 to 39 minutes
- 3740 to 44 minutes
- 1145 to 59 minutes
- 1760 to 89 minutes
- 1590 or more minutes

Means of transportation to work
![Means of transportation to work]()
- 69.3%491Drove a car alone
- 5.6%40Carpooled
- 2.0%14Bus
- 3.0%21Subway or elevated rail
- 0.6%4Taxi
- 3.2%23Bicycle
- 4.4%31Walked
- 0.4%3Other means
- 18.1%128Worked at home

Time leaving home to go to work
![Time leaving home to go to work]()
- 2612:00 a.m. to 4:59 a.m.
- 45:00 a.m. to 5:29 a.m.
- 105:30 a.m. to 5:59 a.m.
- 456:00 a.m. to 6:29 a.m.
- 576:30 a.m. to 6:59 a.m.
- 787:00 a.m. to 7:29 a.m.
- 1287:30 a.m. to 7:59 a.m.
- 928:00 a.m. to 8:29 a.m.
- 518:30 a.m. to 8:59 a.m.
- 1869:00 a.m. to 9:59 a.m.
- 1610:00 a.m. to 10:59 a.m.
- 711:00 a.m. to 11:59 a.m.
- 912:00 p.m. to 3:59 p.m.
- 94:00 p.m. to 11:59 p.m.

Occupations of males:
- Percentage of males in management occupations (except farmers):
Here: 7.5% city: 11.1%
- Percentage of males in business and financial operations occupations:
Here: 4.6% city: 8.0%
- Percentage of males in computer and mathematical occupations:
Here: 5.9% city: 9.0%
- Percentage of males in architecture and engineering occupations:
Here: 8.2% city: 3.4%
- Percentage of males in life, physical, and social science occupations:
Here: 4.3% city: 2.7%
- Percentage of males in legal occupations:
Here: 3.5% city: 1.8%
- Percentage of males in arts, design, entertainment, sports, and media occupations:
Here: 3.4% city: 3.0%
- Percentage of males in healthcare practitioners and technical occupations:
Here: 10.6% city: 6.1%
- Percentage of males in service occupations:
Here: 9.4% city: 14.7%
- Percentage of males in sales and office occupations:
Here: 14.0% city: 12.2%
- Percentage of males in construction, extraction, and maintenance occupations:
Here: 7.1% city: 5.0%
- Percentage of males in production occupations:
Here: 13.0% city: 3.3%
- Percentage of males in transportation occupations:
Here: 2.4% city: 4.4%
Occupations of females:
- Percentage of females in management occupations (except farmers):
Here: 28.1% city: 8.7%
- Percentage of females in business and financial operations occupations:
Here: 11.6% city: 8.1%
- Percentage of females in computer and mathematical occupations:
Here: 6.2% city: 2.8%
- Percentage of females in architecture and engineering occupations:
Here: 3.3% city: 1.2%
- Percentage of females in life, physical, and social science occupations:
Here: 3.9% city: 2.1%
- Percentage of females in community and social services occupations:
Here: 3.5% city: 3.4%
- Percentage of females in education, training, and library occupations:
Here: 3.8% city: 9.9%
- Percentage of females in arts, design, entertainment, sports, and media occupations:
Here: 2.8% city: 3.0%
- Percentage of females in service occupations:
Here: 7.6% city: 20.1%
- Percentage of females in sales and office occupations:
Here: 31.6% city: 23.5%
- Percentage of females in farming, fishing, and forestry occupations:
Here: 2.2% city: 0.1%
Percentage of people 16-64 in Armed Forces:
| South Shore: | 2.4% |
| Pittsburgh: | 0.2% |
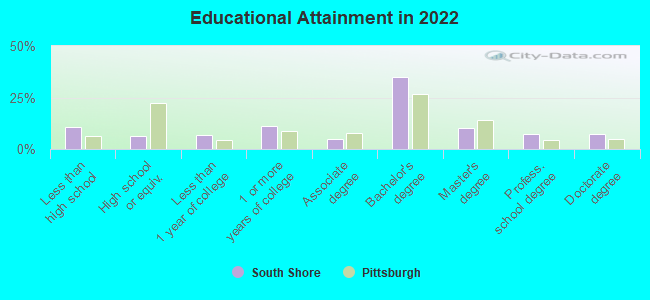
Education in this neighborhood (subdivision or community):
- Percentage of people 3 years and older in K-12 schools:
South Shore: 8.8% Pittsburgh: 10.4%
- Percentage of people 3 years and older in undergraduate colleges:
South Shore: 2.5% Pittsburgh: 12.9%
- Percentage of people 3 years and older in grad. or professional schools:
South Shore: 7.2% Pittsburgh: 4.1%
- Percentage of students K-12 enrolled in private schools:
South Shore: 12.6% Pittsburgh: 19.6%
Percentage of population below poverty level:
| South Shore: | 3.9% |
| Pittsburgh: | 19.0% |
Median year owner moved in (as recorded in 2022):
Median year renter moved in (as recorded in 2022):
| South Shore: | 2001 |
| Pittsburgh: | 2007 |
Median year renter moved in (as recorded in 2022):
| South Shore: | 2018 |
| Pittsburgh: | 2020 |
Percentage of married-couple families with both working:
| South Shore: | 100.0% |
| Pittsburgh: | 79.2% |
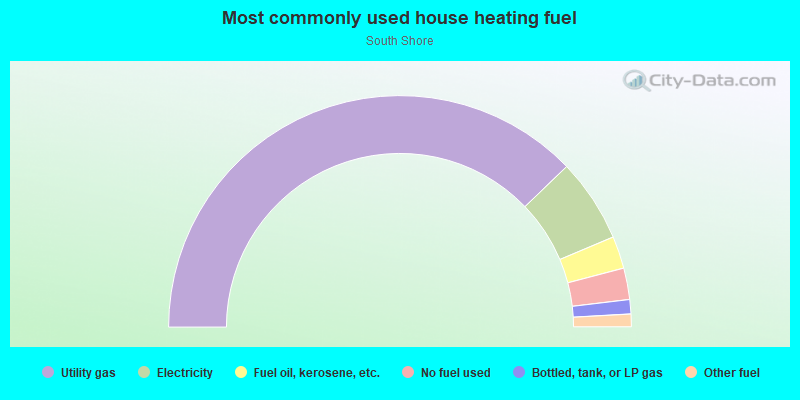
- 75.7%Utility gas
- 11.7%Electricity
- 4.5%Fuel oil, kerosene, etc.
- 4.4%No fuel used
- 2.0%Bottled, tank, or LP gas
- 1.8%Other fuel
Limited-access highways (interstate or state) in this neighborhood:
Fort Pitt Tunl (US Hwy 22, US Hwy 30, I- 279, US Hwy 19(Trk))
Length: 0.07 miles
Directions: E-W, SW-NE
Directions: E-W, SW-NE
Highways in this neighborhood:
State Rte 837 (E Carson St)
Length: 0.44 miles
Directions: E-W, N-S, SE-NW
Address range: 1 to 199
Directions: E-W, N-S, SE-NW
Address range: 1 to 199
Liberty Brg
Length: 0.08 miles
Direction: SW-NE
Direction: SW-NE
Roads and streets:
W Carson St
Length: 1.40 miles
Directions: E-W, N-S, SE-NW, SW-NE
Address range: 100 to 1399
Directions: E-W, N-S, SE-NW, SW-NE
Address range: 100 to 1399
Mc Kean St
Length: 0.16 miles
Directions: E-W, SW-NE
Address range: 100 to 217
Directions: E-W, SW-NE
Address range: 100 to 217
Arlington Ave
Length: 0.14 miles
Directions: SE-NW, SW-NE
Address range: 100 to 149
Directions: SE-NW, SW-NE
Address range: 100 to 149
McArdle Roadway
Length: 0.13 miles
Directions: E-W, SE-NW
Address range: 501 to 553
Directions: E-W, SE-NW
Address range: 501 to 553
Wabash Tunl
Length: 0.07 miles
Directions: N-S, SW-NE
Directions: N-S, SW-NE
S 2nd St
Length: 0.06 miles
Direction: SW-NE
Address range: 101 to 199
Direction: SW-NE
Address range: 101 to 199
S 1st St
Length: 0.04 miles
Direction: SW-NE
Direction: SW-NE
Fort Pitt Brg (I 279)
Length: 0.04 miles
Direction: SW-NE
Direction: SW-NE
Station Sq
Length: 0.04 miles
Directions: E-W, SE-NW
Address range: 1 to 99
Directions: E-W, SE-NW
Address range: 1 to 99
Carson St (Pa 837)
Length: 0.02 miles
Direction: SE-NW
Direction: SE-NW
Railroad features:
Penn Central RR
Length: 2.42 miles
Directions: E-W, N-S, SE-NW, SW-NE
Directions: E-W, N-S, SE-NW, SW-NE
Pittsburgh and Lake Erie RR
Length: 0.70 miles
Directions: E-W, SE-NW
Directions: E-W, SE-NW
Pennsylvania RR
Length: 0.26 miles
Directions: N-S, SE-NW, SW-NE
Directions: N-S, SE-NW, SW-NE
Cog rail lines or incline rail lines:
Monongahela Incline Rlwy
Length: 0.09 miles
Direction: SW-NE
Direction: SW-NE