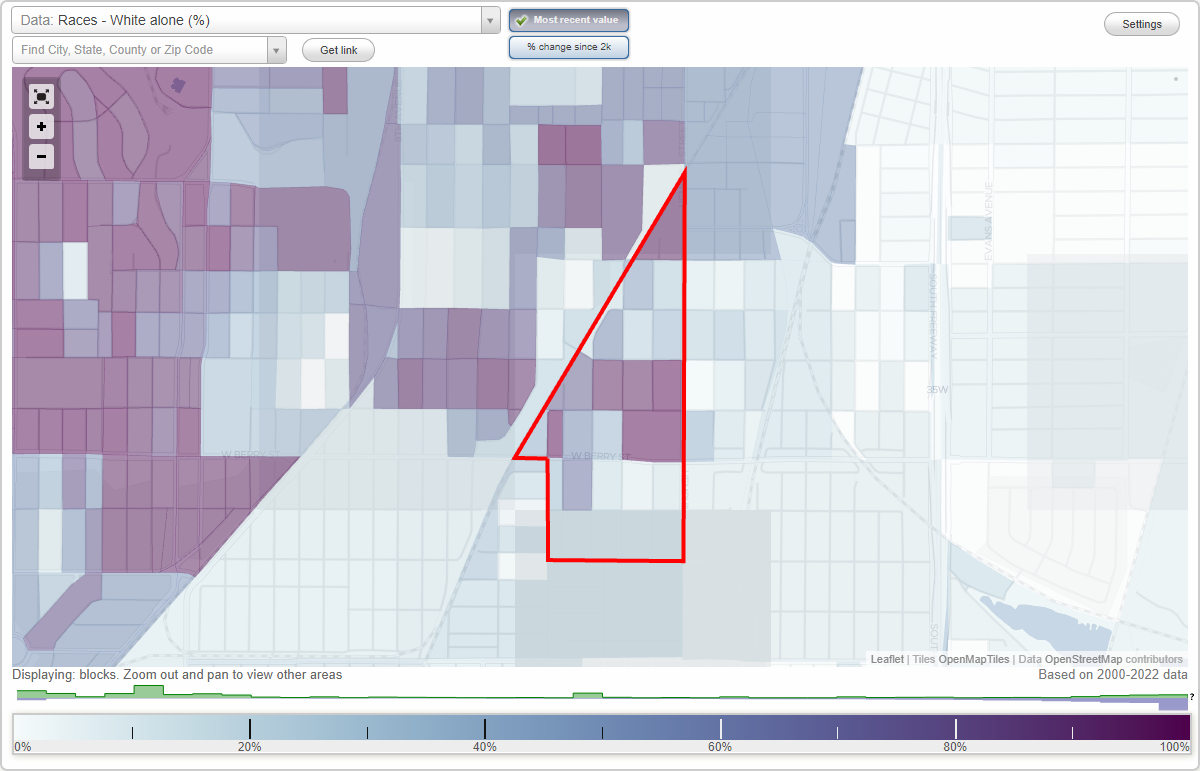
South Hemphill Heights neighborhood in Fort Worth, Texas (TX), 76110 detailed profile
Settings
X

Business Search - 14 Million verified businesses
Area: 0.237 square miles
Population: 1,758
Population density:
| South Hemphill Heights: | 7,428 people per square mile |
| Fort Worth: | 3,286 people per square mile |

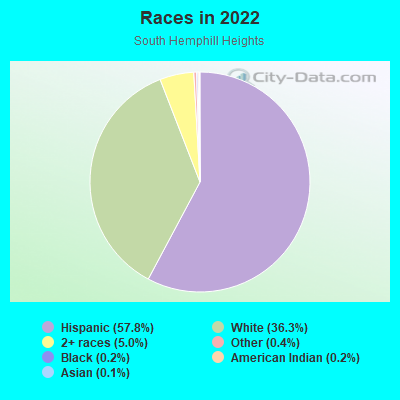
- 1,01357.8%Hispanic or Latino
- 63736.3%White
- 885.0%Two or more races
- 70.4%Some other race
- 40.2%Black
- 30.2%American Indian
- 20.1%Asian
Median household income in 2022:
| South Hemphill Heights: | $66,372 |
| Fort Worth: | $71,527 |
Distribution of median household income
![Distribution of median household income]()
- 44Less than $10,000
- 28$10,000 to $19,999
- 35$20,000 to $29,999
- 53$30,000 to $39,999
- 54$40,000 to $49,999
- 63$50,000 to $59,999
- 37$60,000 to $74,999
- 73$75,000 to $99,999
- 46$100,000 to $124,999
- 51$125,000 to $149,999
- 38$150,000 to $199,999
- 78$200,000 or more

Distribution of owner-occupied house/condo value
![Distribution of owner-occupied house/condo value]()
- 16Less than $50,000
- 45$50,000 to $99,999
- 27$100,000 to $149,999
- 39$150,000 to $199,999
- 10$200,000 to $249,999
- 31$250,000 to $299,999
- 99$300,000 to $399,999
- 44$400,000 to $499,999
- 53$500,000 to $749,999
- 6$750,000 to $999,999
- 5$1,000,000 or more

Distribution of rent paid by renters
![Distribution of rent paid by renters]()
- 9$100 to $199
- 9$200 to $299
- 3$400 to $499
- 14$500 to $599
- 31$600 to $699
- 11$700 to $799
- 35$800 to $899
- 16$900 to $999
- 78$1,000 to $1,249
- 60$1,250 to $1,499
- 7$1,500 to $1,999
- 24$2,000 or more

Median rent in 2022:
| South Hemphill Heights: | $1,106 |
| Fort Worth: | $1,182 |
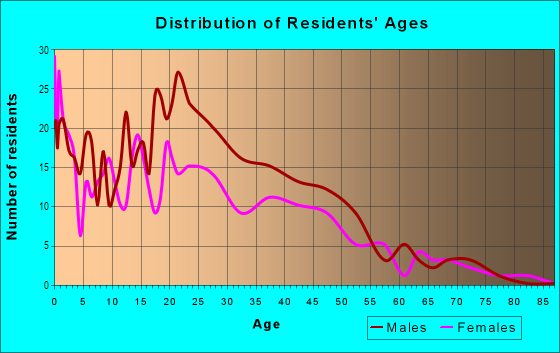
| Males: | 875 |
| Females: | 882 |
Males:
| This neighborhood: | 32.7 years |
| Whole city: | 33.6 years |
| This neighborhood: | 37.6 years |
| Whole city: | 34.8 years |
Average household size:
| South Hemphill Heights: | 3.0 people |
| Fort Worth: | 2.7 people |
Percentage of family households:
| South Hemphill Heights: | 50.8% |
| Fort Worth: | 52.4% |
| Here: | 46.7% |
| Fort Worth: | 48.2% |
Percentage of married-couple families with children (among all households):
| South Hemphill Heights: | 24.7% |
| Fort Worth: | 25.9% |
Percentage of single-mother households (among all households):
| South Hemphill Heights: | 7.9% |
| Fort Worth: | 7.4% |
Percentage of never married males 15 years old and over:
Percentage of never married females 15 years old and over:
| South Hemphill Heights: | 22.1% |
| Fort Worth: | 18.5% |
Percentage of never married females 15 years old and over:
| South Hemphill Heights: | 13.3% |
| city: | 17.3% |
Percentage of people that speak English not well or not at all:
| South Hemphill Heights: | 15.1% |
| Fort Worth: | 6.5% |
Percentage of people born in this state:
Percentage of people born in another U.S. state:
Percentage of native residents but born outside the U.S.:
Percentage of foreign born residents:
| Here: | 58.2% |
| Fort Worth: | 55.0% |
Percentage of people born in another U.S. state:
| South Hemphill Heights: | 16.9% |
| Fort Worth: | 26.2% |
Percentage of native residents but born outside the U.S.:
| Here: | 0.7% |
| city: | 2.1% |
Percentage of foreign born residents:
| Here: | 24.2% |
| Fort Worth: | 16.6% |
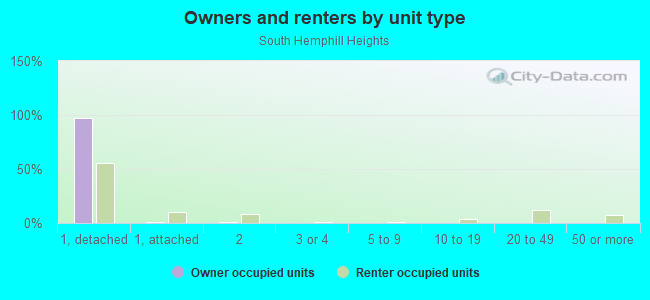
Owner-occupied
Renter-occupied

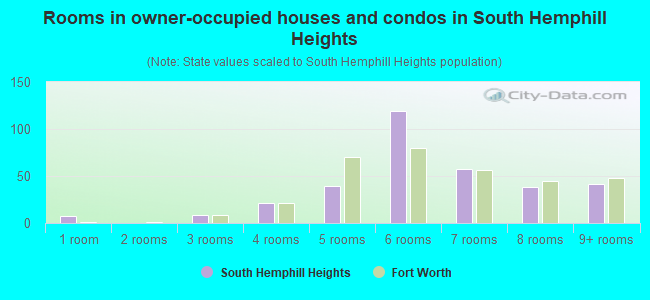
- Rooms in owner-occupied houses and condos in South Hemphill Heights
- 71 room
- 02 rooms
- 83 rooms
- 214 rooms
- 395 rooms
- 1196 rooms
- 577 rooms
- 388 rooms
- 419+ rooms
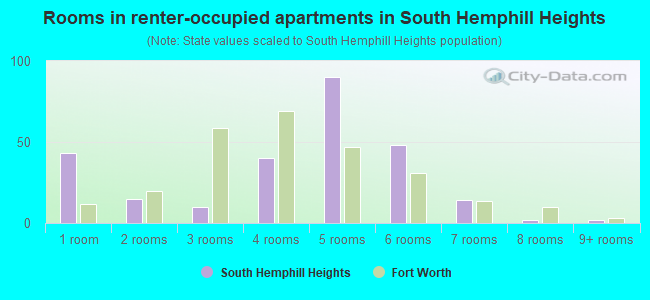
- Rooms in renter-occupied apartments in South Hemphill Heights
- 431 room
- 152 rooms
- 103 rooms
- 404 rooms
- 905 rooms
- 486 rooms
- 147 rooms
- 28 rooms
- 29+ rooms
Owner-occupied
Renter-occupied
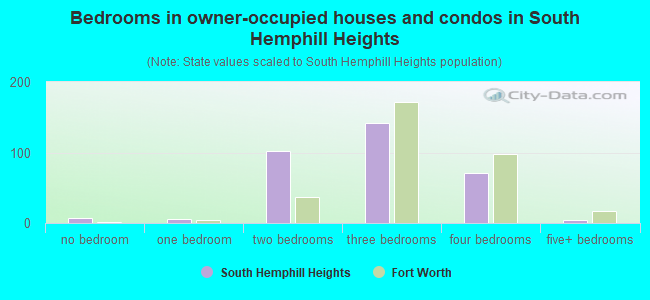
- Bedrooms in owner-occupied houses and condos in South Hemphill Heights
- 7no bedroom
- 51 bedroom
- 1022 bedrooms
- 1423 bedrooms
- 714 bedrooms
- 45+ bedrooms
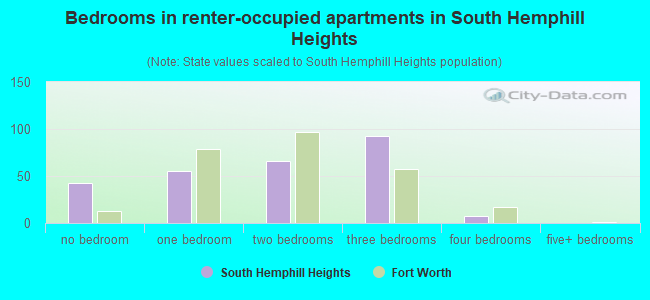
- Bedrooms in renter-occupied apartments in South Hemphill Heights
- 43no bedroom
- 551 bedroom
- 662 bedrooms
- 933 bedrooms
- 74 bedrooms
- 05+ bedrooms
Average number of cars or other vehicles available in houses/condos:
Average number of cars or other vehicles available in apartments:
| This neighborhood: | 2.2 |
| Fort Worth: | 2.1 |
Average number of cars or other vehicles available in apartments:
| Here: | 1.8 |
| city: | 1.5 |
Percentage of units with a mortgage:
| South Hemphill Heights: | 56.6% |
| Fort Worth: | 61.2% |
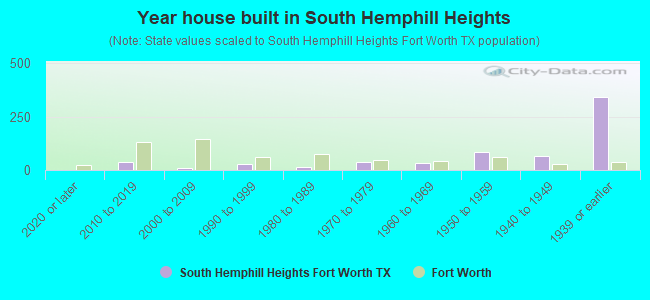
- Year house built in South Hemphill Heights
- 02020 or later
- 372010 to 2019
- 112000 to 2009
- 301990 to 1999
- 131980 to 1989
- 361970 to 1979
- 351960 to 1969
- 851950 to 1959
- 641940 to 1949
- 3401939 or earlier
City-data.com crime index for city in 2020 (higher means more crime):
| City: | 303.1 |
| U.S. average: | 219.5 |
Travel time to work (commute)
![Travel time to work (commute)]()
- 17Less than 5 minutes
- 355 to 9 minutes
- 10410 to 14 minutes
- 12315 to 19 minutes
- 14120 to 24 minutes
- 4325 to 29 minutes
- 10730 to 34 minutes
- 2835 to 39 minutes
- 540 to 44 minutes
- 7145 to 59 minutes
- 1760 to 89 minutes

Means of transportation to work
![Means of transportation to work]()
- 60.1%505Drove a car alone
- 19.4%163Carpooled
- 2.5%21Bus
- 0.7%6Walked
- 0.8%7Other means
- 16.9%142Worked at home

Time leaving home to go to work
![Time leaving home to go to work]()
- 1712:00 a.m. to 4:59 a.m.
- 275:00 a.m. to 5:29 a.m.
- 485:30 a.m. to 5:59 a.m.
- 746:00 a.m. to 6:29 a.m.
- 936:30 a.m. to 6:59 a.m.
- 1187:00 a.m. to 7:29 a.m.
- 787:30 a.m. to 7:59 a.m.
- 688:00 a.m. to 8:29 a.m.
- 518:30 a.m. to 8:59 a.m.
- 409:00 a.m. to 9:59 a.m.
- 1610:00 a.m. to 10:59 a.m.
- 2311:00 a.m. to 11:59 a.m.
- 612:00 p.m. to 3:59 p.m.
- 314:00 p.m. to 11:59 p.m.

Occupations of males:
- Percentage of males in management occupations (except farmers):
Here: 3.4% city: 11.7%
- Percentage of males in business and financial operations occupations:
Here: 4.8% city: 4.9%
- Percentage of males in computer and mathematical occupations:
Here: 18.4% city: 4.3%
- Percentage of males in architecture and engineering occupations:
Here: 3.5% city: 3.4%
- Percentage of males in legal occupations:
Here: 2.1% city: 0.8%
- Percentage of males in education, training, and library occupations:
Here: 3.4% city: 2.9%
- Percentage of males in healthcare practitioners and technical occupations:
Here: 7.5% city: 2.6%
- Percentage of males in service occupations:
Here: 13.2% city: 12.0%
- Percentage of males in sales and office occupations:
Here: 7.6% city: 15.8%
- Percentage of males in construction, extraction, and maintenance occupations:
Here: 17.1% city: 11.7%
- Percentage of males in production occupations:
Here: 15.2% city: 7.8%
- Percentage of males in material moving occupations:
Here: 1.5% city: 7.1%
Occupations of females:
- Percentage of females in management occupations (except farmers):
Here: 9.0% city: 9.6%
- Percentage of females in business and financial operations occupations:
Here: 4.9% city: 6.3%
- Percentage of females in computer and mathematical occupations:
Here: 5.7% city: 1.8%
- Percentage of females in life, physical, and social science occupations:
Here: 1.6% city: 0.5%
- Percentage of females in community and social services occupations:
Here: 3.0% city: 2.2%
- Percentage of females in legal occupations:
Here: 2.7% city: 1.2%
- Percentage of females in education, training, and library occupations:
Here: 6.0% city: 9.5%
- Percentage of females in healthcare practitioners and technical occupations:
Here: 2.4% city: 7.9%
- Percentage of females in service occupations:
Here: 21.1% city: 20.2%
- Percentage of females in sales and office occupations:
Here: 25.2% city: 28.3%
- Percentage of females in construction, extraction, and maintenance occupations:
Here: 3.6% city: 0.3%
- Percentage of females in production occupations:
Here: 6.9% city: 3.5%
- Percentage of females in material moving occupations:
Here: 7.3% city: 3.4%
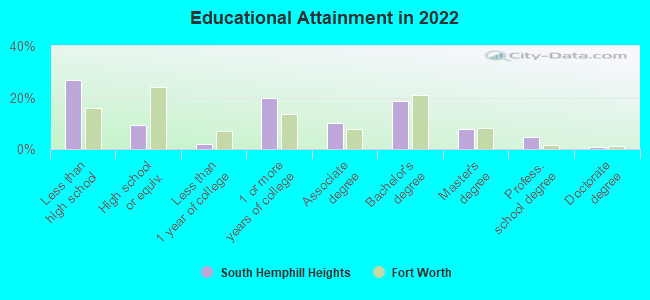
Education in this neighborhood (subdivision or community):
- Percentage of people 3 years and older in K-12 schools:
South Hemphill Heights: 17.1% Fort Worth: 20.3%
- Percentage of people 3 years and older in undergraduate colleges:
South Hemphill Heights: 5.8% Fort Worth: 4.7%
- Percentage of people 3 years and older in grad. or professional schools:
South Hemphill Heights: 2.8% Fort Worth: 1.6%
- Percentage of students K-12 enrolled in private schools:
South Hemphill Heights: 4.2% Fort Worth: 7.2%
Percentage of population below poverty level:
| South Hemphill Heights: | 19.2% |
| Fort Worth: | 12.0% |
Median year owner moved in (as recorded in 2022):
Median year renter moved in (as recorded in 2022):
| South Hemphill Heights: | 2010 |
| Fort Worth: | 2013 |
Median year renter moved in (as recorded in 2022):
| South Hemphill Heights: | 2018 |
| Fort Worth: | 2020 |
Percentage of married-couple families with both working:
| South Hemphill Heights: | 70.0% |
| Fort Worth: | 71.2% |
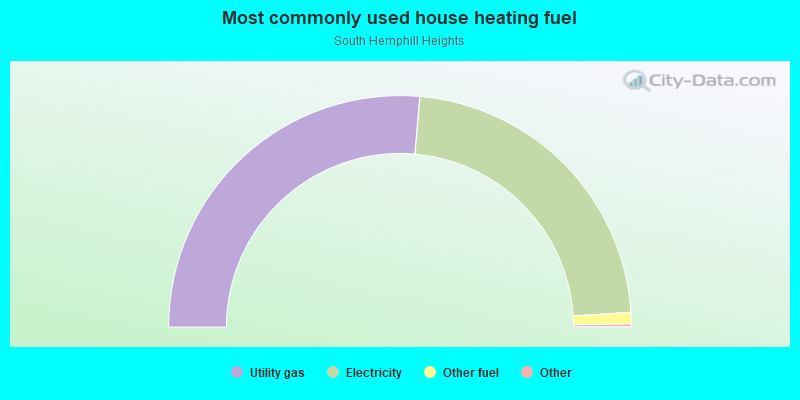
- 52.7%Utility gas
- 45.2%Electricity
- 1.6%Other fuel
Roads and streets:
Hemphill St
Length: 0.93 miles
Direction: N-S
Address range: 2501 to 3299
Direction: N-S
Address range: 2501 to 3299
Travis Ave
Length: 0.79 miles
Direction: N-S
Address range: 2600 to 3299
Direction: N-S
Address range: 2600 to 3299
Lipscomb St
Length: 0.62 miles
Direction: N-S
Address range: 2800 to 3299
Direction: N-S
Address range: 2800 to 3299
College Ave
Length: 0.56 miles
Direction: N-S
Address range: 2800 to 3299
Direction: N-S
Address range: 2800 to 3299
S Adams St
Length: 0.44 miles
Direction: N-S
Address range: 2900 to 3299
Direction: N-S
Address range: 2900 to 3299
W Berry St
Length: 0.40 miles
Direction: E-W
Address range: 700 to 1199
Direction: E-W
Address range: 700 to 1199
W Bowie St
Length: 0.39 miles
Direction: E-W
Address range: 700 to 1199
Direction: E-W
Address range: 700 to 1199
W Devitt St
Length: 0.36 miles
Direction: E-W
Address range: 700 to 1099
Direction: E-W
Address range: 700 to 1099
W Cantey St
Length: 0.30 miles
Directions: E-W, N-S, SW-NE
Address range: 700 to 949
Directions: E-W, N-S, SW-NE
Address range: 700 to 949
W Lowden St
Length: 0.27 miles
Direction: E-W
Address range: 700 to 999
Direction: E-W
Address range: 700 to 999
W Shaw St
Length: 0.23 miles
Direction: E-W
Address range: 700 to 999
Direction: E-W
Address range: 700 to 999
S Henderson St
Length: 0.12 miles
Directions: N-S, SW-NE
Address range: 3000 to 3099
Directions: N-S, SW-NE
Address range: 3000 to 3099
W Capps St
Length: 0.09 miles
Direction: E-W
Address range: 700 to 799
Direction: E-W
Address range: 700 to 799