South Campus neighborhood in San Jose, California (CA), 95112 detailed profile
Settings
X

Business Search - 14 Million verified businesses
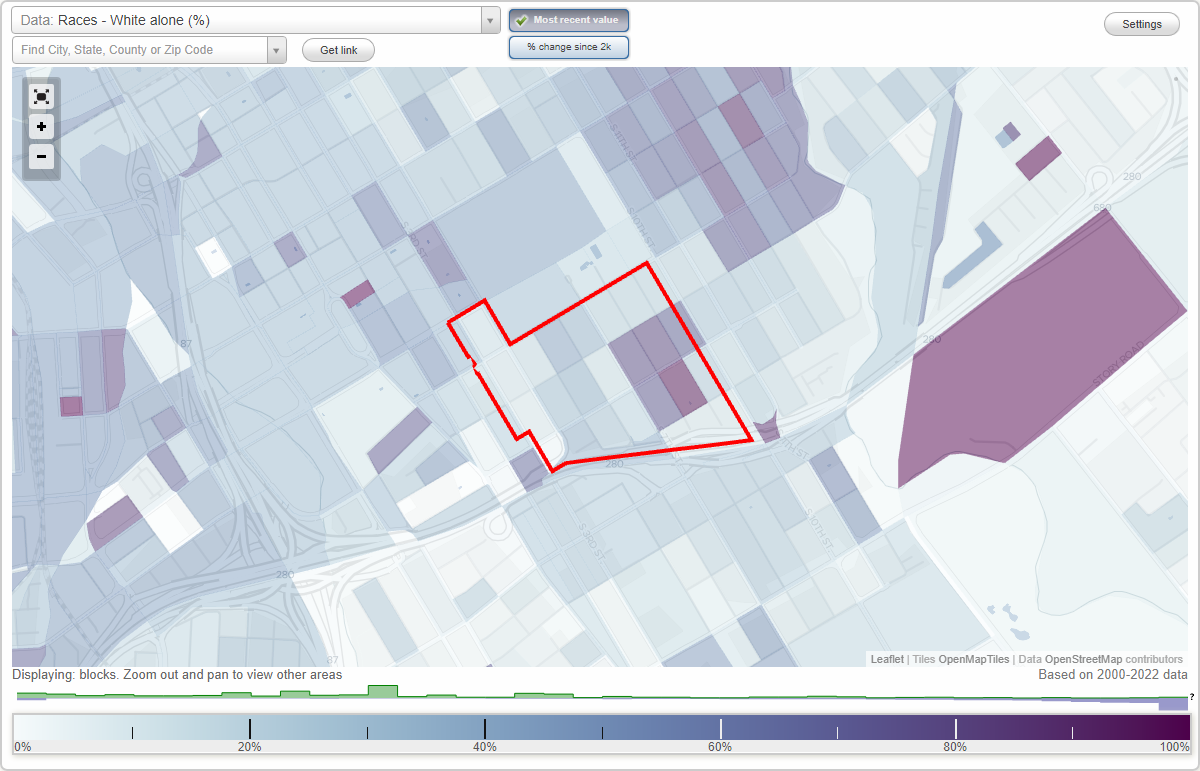
Area: 0.190 square miles
Population: 2,242
Population density:
| South Campus: | 11,786 people per square mile |
| San Jose: | 5,554 people per square mile |

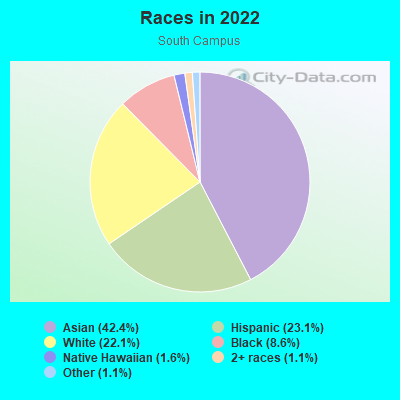
- 96242.4%Asian
- 52423.1%Hispanic or Latino
- 50122.1%White
- 1958.6%Black
- 361.6%Native Hawaiian and Other
Pacific Islander - 251.1%Some other race
- 261.1%Two or more races
- 20.09%American Indian
Distribution of median household income
![Distribution of median household income]()
- 66Less than $10,000
- 118$10,000 to $19,999
- 44$20,000 to $29,999
- 76$30,000 to $39,999
- 91$40,000 to $49,999
- 59$50,000 to $59,999
- 28$60,000 to $74,999
- 59$75,000 to $99,999
- 79$100,000 to $124,999
- 57$125,000 to $149,999
- 351$150,000 to $199,999
- 169$200,000 or more

Distribution of owner-occupied house/condo value
![Distribution of owner-occupied house/condo value]()
- 130$500,000 to $749,999
- 317$750,000 to $999,999
- 173$1,000,000 or more

Distribution of rent paid by renters
![Distribution of rent paid by renters]()
- 22$100 to $199
- 82$200 to $299
- 22$300 to $399
- 20$400 to $499
- 37$500 to $599
- 41$600 to $699
- 7$800 to $899
- 35$900 to $999
- 13$1,000 to $1,249
- 75$1,250 to $1,499
- 143$1,500 to $1,999
- 490$2,000 or more

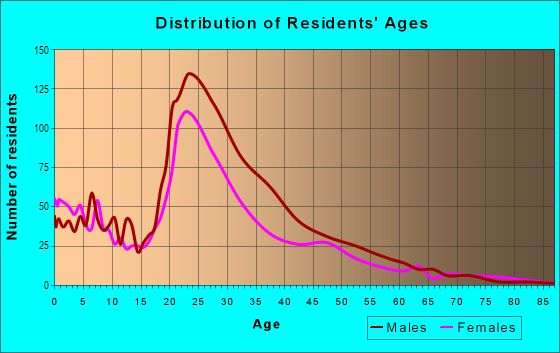
| Males: | 1,346 |
| Females: | 896 |
Males:
| This neighborhood: | 31.3 years |
| Whole city: | 37.6 years |
| This neighborhood: | 26.9 years |
| Whole city: | 39.1 years |
Average household size:
| South Campus: | 2.1 people |
| San Jose: | 2.9 people |
Percentage of family households:
| South Campus: | 28.0% |
| San Jose: | 49.9% |
| Here: | 25.1% |
| San Jose: | 53.0% |
Percentage of married-couple families with children (among all households):
| South Campus: | 34.8% |
| San Jose: | 25.8% |
Percentage of single-mother households (among all households):
| South Campus: | 5.2% |
| San Jose: | 5.2% |
Percentage of never married males 15 years old and over:
Percentage of never married females 15 years old and over:
| South Campus: | 45.5% |
| San Jose: | 20.9% |
Percentage of never married females 15 years old and over:
| South Campus: | 26.1% |
| city: | 16.7% |
Percentage of people that speak English not well or not at all:
| South Campus: | 13.3% |
| San Jose: | 11.4% |
Percentage of people born in this state:
Percentage of people born in another U.S. state:
Percentage of native residents but born outside the U.S.:
Percentage of foreign born residents:
| Here: | 58.8% |
| San Jose: | 46.1% |
Percentage of people born in another U.S. state:
| South Campus: | 8.6% |
| San Jose: | 10.4% |
Percentage of native residents but born outside the U.S.:
| Here: | 3.5% |
| city: | 1.7% |
Percentage of foreign born residents:
| Here: | 29.1% |
| San Jose: | 41.8% |
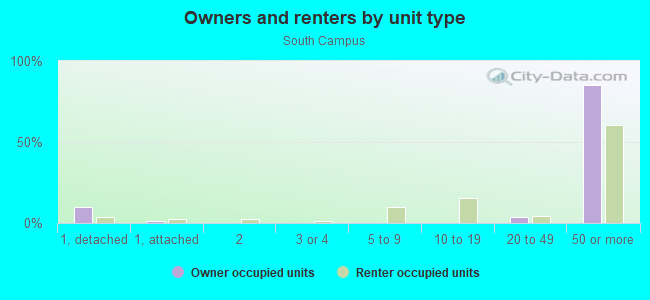
Owner-occupied
Renter-occupied

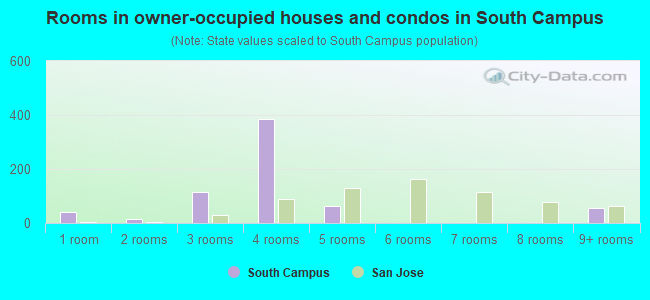
- Rooms in owner-occupied houses and condos in South Campus
- 401 room
- 152 rooms
- 1143 rooms
- 3854 rooms
- 625 rooms
- 06 rooms
- 07 rooms
- 08 rooms
- 579+ rooms
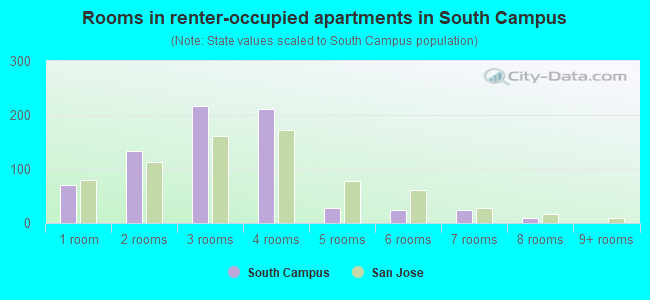
- Rooms in renter-occupied apartments in South Campus
- 711 room
- 1342 rooms
- 2163 rooms
- 2114 rooms
- 275 rooms
- 256 rooms
- 247 rooms
- 98 rooms
- 09+ rooms
Owner-occupied
Renter-occupied
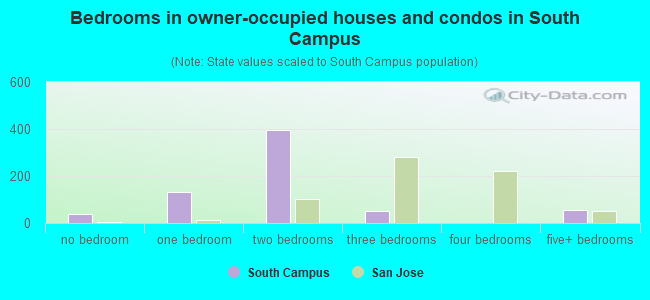
- Bedrooms in owner-occupied houses and condos in South Campus
- 40no bedroom
- 1331 bedroom
- 3942 bedrooms
- 503 bedrooms
- 04 bedrooms
- 575+ bedrooms
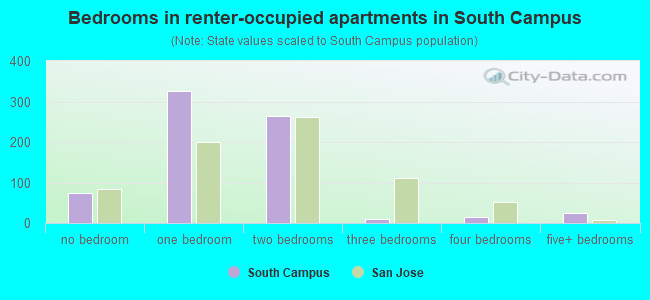
- Bedrooms in renter-occupied apartments in South Campus
- 75no bedroom
- 3251 bedroom
- 2642 bedrooms
- 113 bedrooms
- 164 bedrooms
- 245+ bedrooms
Average number of cars or other vehicles available in houses/condos:
Average number of cars or other vehicles available in apartments:
| This neighborhood: | |
| San Jose: |
Average number of cars or other vehicles available in apartments:
| Here: | 1.3 |
| city: | 1.6 |
Percentage of units with a mortgage:
| South Campus: | 73.4% |
| San Jose: | 66.9% |
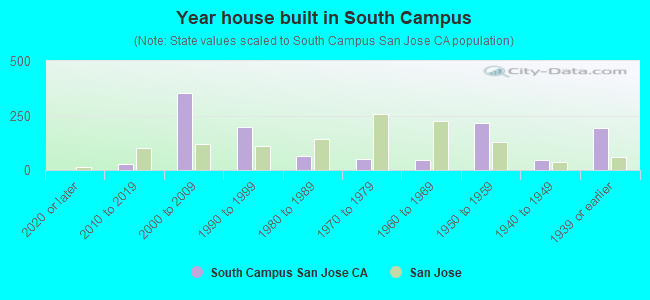
- Year house built in South Campus
- 02020 or later
- 272010 to 2019
- 3532000 to 2009
- 1971990 to 1999
- 621980 to 1989
- 521970 to 1979
- 481960 to 1969
- 2141950 to 1959
- 461940 to 1949
- 1921939 or earlier
City-data.com crime index for city in 2020 (higher means more crime):
| City: | 268.4 |
| U.S. average: | 219.5 |
Travel time to work (commute)
![Travel time to work (commute)]()
- 14Less than 5 minutes
- 3395 to 9 minutes
- 35410 to 14 minutes
- 39015 to 19 minutes
- 28720 to 24 minutes
- 1825 to 29 minutes
- 13130 to 34 minutes
- 8235 to 39 minutes
- 1140 to 44 minutes
- 7145 to 59 minutes
- 9060 to 89 minutes
- 1990 or more minutes

Means of transportation to work
![Means of transportation to work]()
- 50.0%616Drove a car alone
- 8.4%103Carpooled
- 2.4%30Bus
- 3.5%43Subway or elevated rail
- 1.8%22Long-distance train or commuter rail
- 3.0%37Light rail, streetcar or trolley
- 3.7%45Taxi
- 0.6%8Motorcycle
- 1.8%22Bicycle
- 16.2%200Walked
- 2.0%25Other means
- 16.8%207Worked at home

Time leaving home to go to work
![Time leaving home to go to work]()
- 5712:00 a.m. to 4:59 a.m.
- 305:00 a.m. to 5:29 a.m.
- 95:30 a.m. to 5:59 a.m.
- 436:00 a.m. to 6:29 a.m.
- 806:30 a.m. to 6:59 a.m.
- 1237:00 a.m. to 7:29 a.m.
- 747:30 a.m. to 7:59 a.m.
- 2488:00 a.m. to 8:29 a.m.
- 778:30 a.m. to 8:59 a.m.
- 2599:00 a.m. to 9:59 a.m.
- 25710:00 a.m. to 10:59 a.m.
- 6511:00 a.m. to 11:59 a.m.
- 32312:00 p.m. to 3:59 p.m.
- 1774:00 p.m. to 11:59 p.m.

Occupations of males:
- Percentage of males in management occupations (except farmers):
Here: 17.7% city: 13.0%
- Percentage of males in business and financial operations occupations:
Here: 6.5% city: 4.6%
- Percentage of males in computer and mathematical occupations:
Here: 17.6% city: 13.6%
- Percentage of males in architecture and engineering occupations:
Here: 5.3% city: 10.2%
- Percentage of males in life, physical, and social science occupations:
Here: 1.8% city: 1.1%
- Percentage of males in education, training, and library occupations:
Here: 1.3% city: 2.8%
- Percentage of males in arts, design, entertainment, sports, and media occupations:
Here: 1.1% city: 1.8%
- Percentage of males in healthcare practitioners and technical occupations:
Here: 4.0% city: 2.0%
- Percentage of males in service occupations:
Here: 10.2% city: 12.7%
- Percentage of males in sales and office occupations:
Here: 14.4% city: 12.8%
- Percentage of males in construction, extraction, and maintenance occupations:
Here: 2.5% city: 7.8%
- Percentage of males in production occupations:
Here: 12.8% city: 5.5%
- Percentage of males in transportation occupations:
Here: 1.6% city: 3.6%
- Percentage of males in material moving occupations:
Here: 1.6% city: 3.1%
Occupations of females:
- Percentage of females in management occupations (except farmers):
Here: 5.1% city: 11.0%
- Percentage of females in business and financial operations occupations:
Here: 3.5% city: 8.6%
- Percentage of females in computer and mathematical occupations:
Here: 11.5% city: 5.4%
- Percentage of females in architecture and engineering occupations:
Here: 3.9% city: 2.8%
- Percentage of females in life, physical, and social science occupations:
Here: 1.1% city: 1.7%
- Percentage of females in education, training, and library occupations:
Here: 4.2% city: 8.1%
- Percentage of females in arts, design, entertainment, sports, and media occupations:
Here: 2.1% city: 2.0%
- Percentage of females in service occupations:
Here: 44.5% city: 21.7%
- Percentage of females in sales and office occupations:
Here: 23.1% city: 22.0%
- Percentage of females in material moving occupations:
Here: 2.6% city: 1.5%
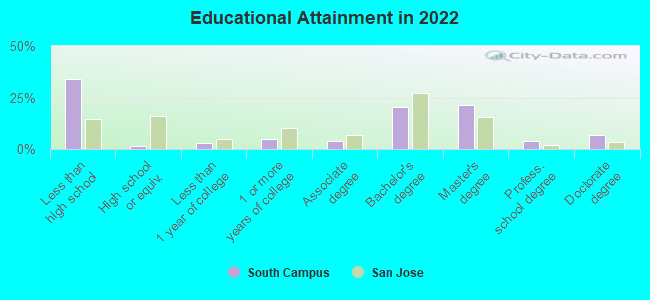
Education in this neighborhood (subdivision or community):
- Percentage of people 3 years and older in K-12 schools:
South Campus: 6.8% San Jose: 16.1%
- Percentage of people 3 years and older in undergraduate colleges:
South Campus: 24.1% San Jose: 6.5%
- Percentage of people 3 years and older in grad. or professional schools:
South Campus: 10.3% San Jose: 2.0%
- Percentage of students K-12 enrolled in private schools:
South Campus: 6.7% San Jose: 14.9%
Percentage of population below poverty level:
| South Campus: | 44.4% |
| San Jose: | 9.0% |
Median year renter moved in (as recorded in 2022):
| South Campus: | 2018 |
| San Jose: | 2020 |
Percentage of married-couple families with both working:
| South Campus: | 92.1% |
| San Jose: | 72.5% |
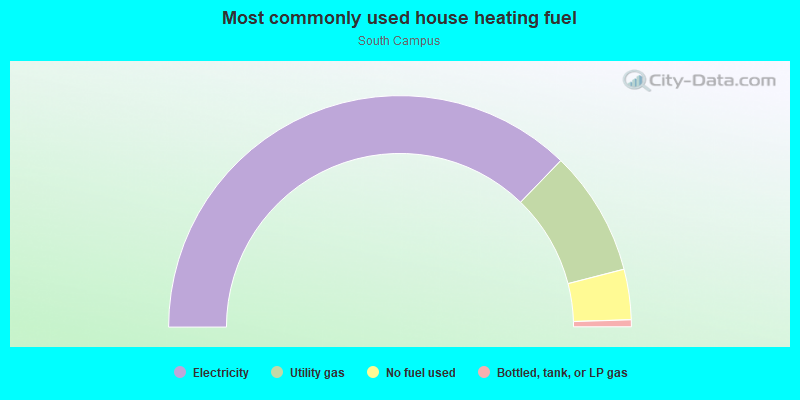
- 74.4%Electricity
- 17.5%Utility gas
- 7.0%No fuel used
- 1.0%Bottled, tank, or LP gas
Roads and streets:
E William St
Length: 0.49 miles
Direction: SW-NE
Address range: 100 to 399
Direction: SW-NE
Address range: 100 to 399
Margaret St
Length: 0.45 miles
Directions: E-W, SE-NW, SW-NE
Address range: 150 to 399
Directions: E-W, SE-NW, SW-NE
Address range: 150 to 399
E Reed St
Length: 0.40 miles
Direction: SW-NE
Address range: 150 to 399
Direction: SW-NE
Address range: 150 to 399
S 9th St
Length: 0.33 miles
Direction: SE-NW
Address range: 500 to 799
Direction: SE-NW
Address range: 500 to 799
S 8th St
Length: 0.29 miles
Direction: SE-NW
Address range: 500 to 799
Direction: SE-NW
Address range: 500 to 799
S 7th St
Length: 0.28 miles
Direction: SE-NW
Address range: 500 to 766
Direction: SE-NW
Address range: 500 to 766
S 6th St
Length: 0.26 miles
Direction: SE-NW
Address range: 500 to 699
Direction: SE-NW
Address range: 500 to 699
S 4th St
Length: 0.25 miles
Direction: SE-NW
Address range: 400 to 599
Direction: SE-NW
Address range: 400 to 599
S 5th St
Length: 0.19 miles
Direction: SE-NW
Address range: 500 to 699
Direction: SE-NW
Address range: 500 to 699
S 3rd St
Length: 0.12 miles
Direction: SE-NW
Address range: 400 to 499
Direction: SE-NW
Address range: 400 to 499
E San Salvador St
Length: 0.08 miles
Direction: SW-NE
Address range: 100 to 149
Direction: SW-NE
Address range: 100 to 149
Carrie St
Length: 0.07 miles
Direction: SW-NE
Address range: 100 to 272
Direction: SW-NE
Address range: 100 to 272