Sioux Falls Downtown Historic District neighborhood in Sioux Falls, South Dakota (SD), 57104 detailed profile
Settings
X

Business Search - 14 Million verified businesses
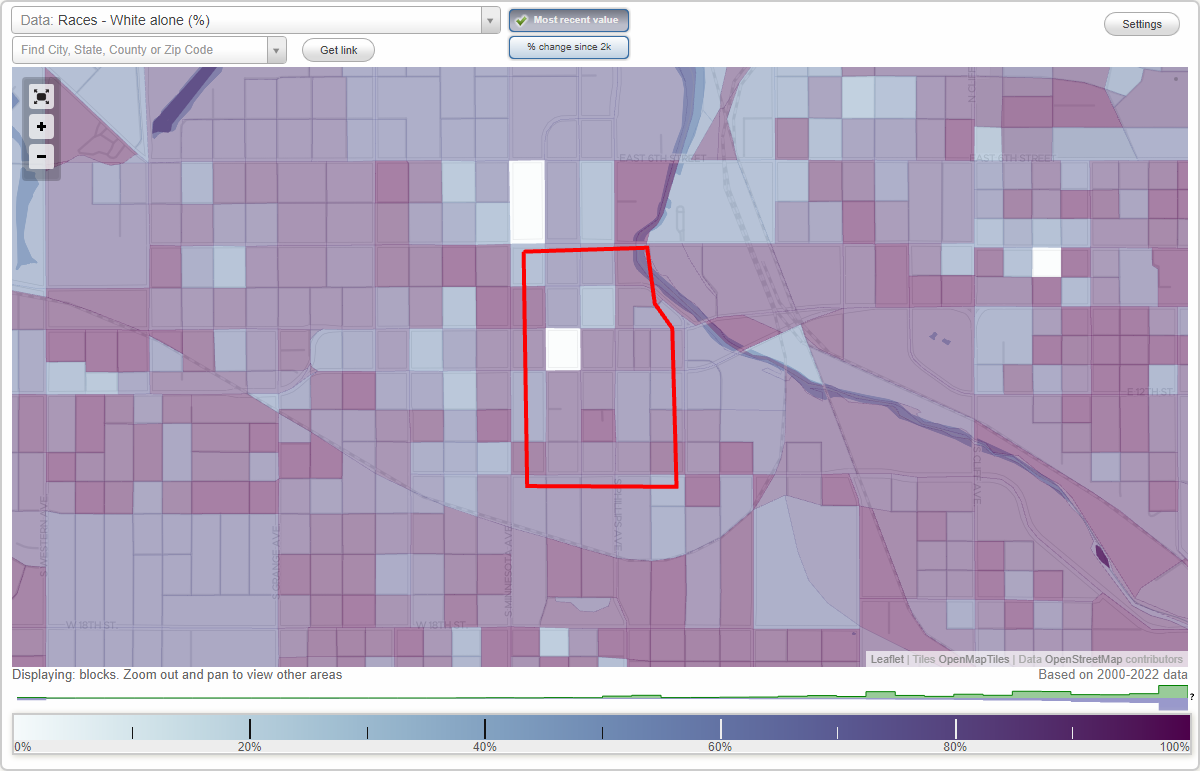
Area: 0.156 square miles
Population: 1,128
Population density:
| Sioux Falls Downtown Historic District: | 7,234 people per square mile |
| Sioux Falls: | 3,588 people per square mile |

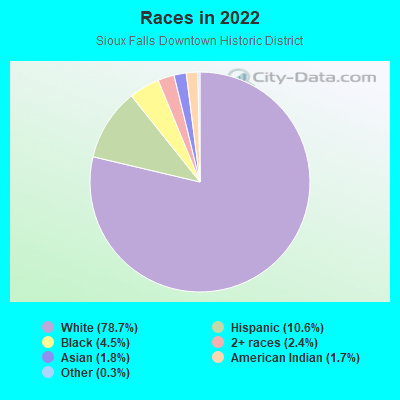
- 93778.7%White
- 12610.6%Hispanic or Latino
- 544.5%Black
- 292.4%Two or more races
- 211.8%Asian
- 201.7%American Indian
- 40.3%Some other race
Median household income in 2022:
| Sioux Falls Downtown Historic District: | $50,856 |
| Sioux Falls: | $71,246 |
Distribution of median household income
![Distribution of median household income]()
- 51Less than $10,000
- 36$10,000 to $19,999
- 63$20,000 to $29,999
- 58$30,000 to $39,999
- 75$40,000 to $49,999
- 51$50,000 to $59,999
- 94$60,000 to $74,999
- 106$75,000 to $99,999
- 21$100,000 to $124,999
- 53$125,000 to $149,999
- 32$150,000 to $199,999
- 38$200,000 or more

Distribution of owner-occupied house/condo value
![Distribution of owner-occupied house/condo value]()
- 2Less than $50,000
- 16$50,000 to $99,999
- 50$100,000 to $149,999
- 25$150,000 to $199,999
- 17$200,000 to $249,999
- 18$250,000 to $299,999
- 11$300,000 to $399,999
- 12$400,000 to $499,999

Distribution of rent paid by renters
![Distribution of rent paid by renters]()
- 1$100 to $199
- 4$200 to $299
- 14$300 to $399
- 15$400 to $499
- 111$500 to $599
- 150$600 to $699
- 101$700 to $799
- 22$800 to $899
- 25$900 to $999
- 44$1,000 to $1,249
- 4$1,250 to $1,499
- 38$1,500 to $1,999
- 27$2,000 or more

Median rent in 2022:
| Sioux Falls Downtown Historic District: | $688 |
| Sioux Falls: | $866 |
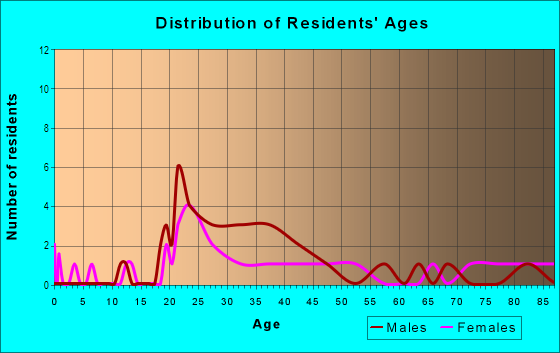
| Males: | 614 |
| Females: | 513 |
Males:
| This neighborhood: | 42.1 years |
| Whole city: | 35.1 years |
| This neighborhood: | 37.5 years |
| Whole city: | 38.0 years |
Average household size:
| Sioux Falls Downtown Historic District: | 1.6 people |
| Sioux Falls: | 2.3 people |
Percentage of family households:
| Sioux Falls Downtown Historic District: | 24.7% |
| Sioux Falls: | 42.9% |
| Here: | 18.9% |
| Sioux Falls: | 44.4% |
Percentage of married-couple families with children (among all households):
| Sioux Falls Downtown Historic District: | 14.1% |
| Sioux Falls: | 31.1% |
Percentage of single-mother households (among all households):
| Sioux Falls Downtown Historic District: | 36.5% |
| Sioux Falls: | 7.5% |
Percentage of never married males 15 years old and over:
Percentage of never married females 15 years old and over:
| Sioux Falls Downtown Historic District: | 24.0% |
| Sioux Falls: | 18.5% |
Percentage of never married females 15 years old and over:
| Sioux Falls Downtown Historic District: | 12.5% |
| city: | 13.9% |
Percentage of people that speak English not well or not at all:
| Sioux Falls Downtown Historic District: | 0.0% |
| Sioux Falls: | 1.6% |
Percentage of people born in this state:
Percentage of people born in another U.S. state:
Percentage of native residents but born outside the U.S.:
Percentage of foreign born residents:
| Here: | 60.7% |
| Sioux Falls: | 56.6% |
Percentage of people born in another U.S. state:
| Sioux Falls Downtown Historic District: | 33.5% |
| Sioux Falls: | 35.3% |
Percentage of native residents but born outside the U.S.:
| Here: | 0.7% |
| city: | 0.7% |
Percentage of foreign born residents:
| Here: | 5.1% |
| Sioux Falls: | 7.4% |
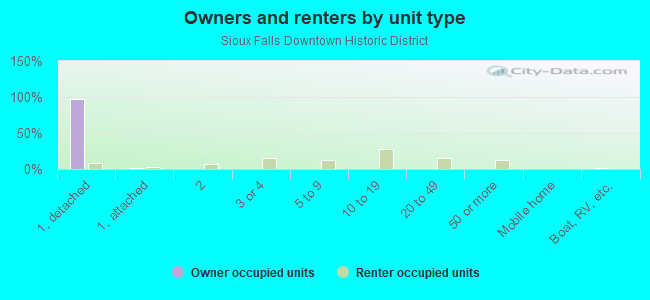
Owner-occupied
Renter-occupied

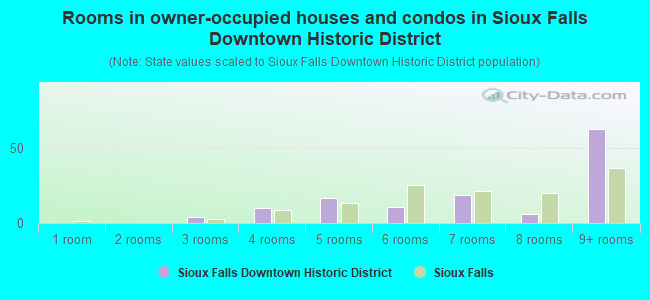
- Rooms in owner-occupied houses and condos in Sioux Falls Downtown Historic District
- 01 room
- 02 rooms
- 43 rooms
- 104 rooms
- 175 rooms
- 116 rooms
- 197 rooms
- 68 rooms
- 639+ rooms
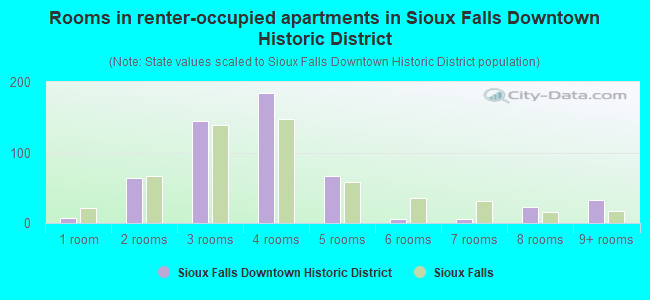
- Rooms in renter-occupied apartments in Sioux Falls Downtown Historic District
- 71 room
- 642 rooms
- 1443 rooms
- 1854 rooms
- 665 rooms
- 56 rooms
- 67 rooms
- 228 rooms
- 329+ rooms
Owner-occupied
Renter-occupied
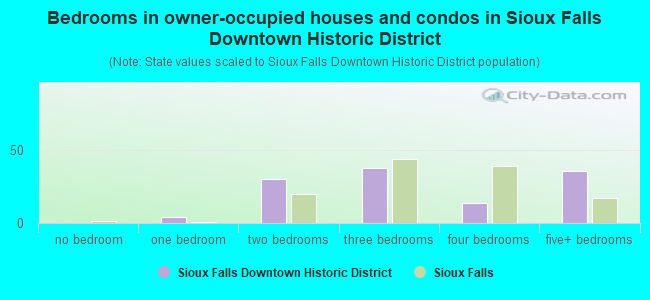
- Bedrooms in owner-occupied houses and condos in Sioux Falls Downtown Historic District
- 0no bedroom
- 41 bedroom
- 302 bedrooms
- 383 bedrooms
- 144 bedrooms
- 365+ bedrooms
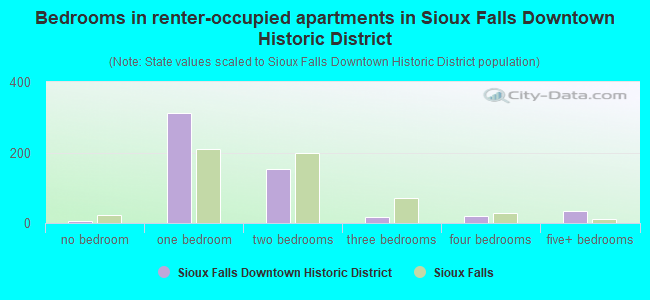
- Bedrooms in renter-occupied apartments in Sioux Falls Downtown Historic District
- 7no bedroom
- 3111 bedroom
- 1532 bedrooms
- 163 bedrooms
- 194 bedrooms
- 355+ bedrooms
Average number of cars or other vehicles available in houses/condos:
Average number of cars or other vehicles available in apartments:
| This neighborhood: | 1.7 |
| Sioux Falls: | 2.1 |
Average number of cars or other vehicles available in apartments:
| Here: | 1.2 |
| city: | 1.3 |
Percentage of units with a mortgage:
| Sioux Falls Downtown Historic District: | 93.1% |
| Sioux Falls: | 67.3% |
Average estimated value of detached houses in 2022 (22.3% of all units):
| Sioux Falls Downtown Historic District: | $196,975 |
| South Dakota: | $303,134 |
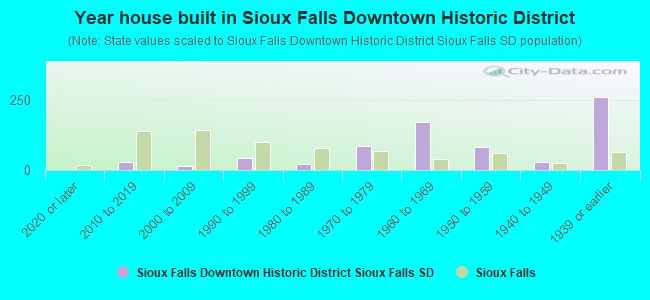
- Year house built in Sioux Falls Downtown Historic District
- 02020 or later
- 282010 to 2019
- 142000 to 2009
- 431990 to 1999
- 201980 to 1989
- 871970 to 1979
- 1711960 to 1969
- 821950 to 1959
- 301940 to 1949
- 2611939 or earlier
City-data.com crime index for city in 2020 (higher means more crime):
| City: | 324.5 |
| U.S. average: | 219.5 |
Travel time to work (commute)
![Travel time to work (commute)]()
- 24Less than 5 minutes
- 725 to 9 minutes
- 12110 to 14 minutes
- 7015 to 19 minutes
- 3820 to 24 minutes
- 525 to 29 minutes
- 530 to 34 minutes
- 1145 to 59 minutes
- 960 to 89 minutes

Means of transportation to work
![Means of transportation to work]()
- 73.4%503Drove a car alone
- 14.0%96Carpooled
- 2.3%16Bus
- 3.1%21Walked
- 1.8%12Other means
- 8.5%58Worked at home

Time leaving home to go to work
![Time leaving home to go to work]()
- 2212:00 a.m. to 4:59 a.m.
- 35:00 a.m. to 5:29 a.m.
- 75:30 a.m. to 5:59 a.m.
- 186:00 a.m. to 6:29 a.m.
- 376:30 a.m. to 6:59 a.m.
- 117:00 a.m. to 7:29 a.m.
- 747:30 a.m. to 7:59 a.m.
- 298:00 a.m. to 8:29 a.m.
- 138:30 a.m. to 8:59 a.m.
- 159:00 a.m. to 9:59 a.m.
- 910:00 a.m. to 10:59 a.m.
- 611:00 a.m. to 11:59 a.m.
- 5212:00 p.m. to 3:59 p.m.
- 494:00 p.m. to 11:59 p.m.

Occupations of males:
- Percentage of males in management occupations (except farmers):
Here: 9.0% city: 12.4%
- Percentage of males in business and financial operations occupations:
Here: 6.2% city: 4.8%
- Percentage of males in computer and mathematical occupations:
Here: 10.9% city: 4.9%
- Percentage of males in architecture and engineering occupations:
Here: 4.5% city: 2.5%
- Percentage of males in life, physical, and social science occupations:
Here: 3.5% city: 0.9%
- Percentage of males in education, training, and library occupations:
Here: 2.5% city: 2.0%
- Percentage of males in arts, design, entertainment, sports, and media occupations:
Here: 4.6% city: 1.6%
- Percentage of males in service occupations:
Here: 11.2% city: 12.3%
- Percentage of males in sales and office occupations:
Here: 8.0% city: 16.6%
- Percentage of males in farming, fishing, and forestry occupations:
Here: 2.5% city: 0.7%
- Percentage of males in construction, extraction, and maintenance occupations:
Here: 14.5% city: 7.8%
- Percentage of males in production occupations:
Here: 10.9% city: 9.0%
- Percentage of males in transportation occupations:
Here: 4.1% city: 6.2%
- Percentage of males in material moving occupations:
Here: 3.1% city: 6.3%
Occupations of females:
- Percentage of females in management occupations (except farmers):
Here: 7.7% city: 8.4%
- Percentage of females in business and financial operations occupations:
Here: 5.1% city: 6.2%
- Percentage of females in community and social services occupations:
Here: 10.7% city: 2.7%
- Percentage of females in education, training, and library occupations:
Here: 10.1% city: 7.4%
- Percentage of females in healthcare practitioners and technical occupations:
Here: 12.5% city: 14.9%
- Percentage of females in service occupations:
Here: 36.3% city: 20.9%
- Percentage of females in sales and office occupations:
Here: 16.0% city: 26.5%
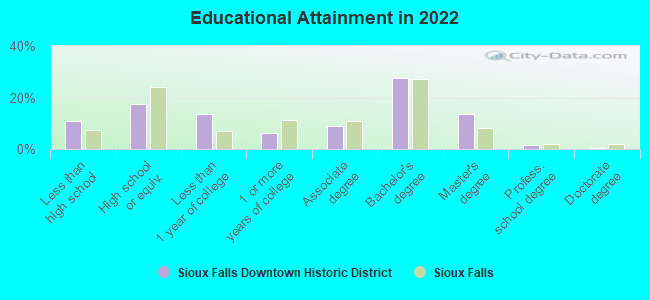
Education in this neighborhood (subdivision or community):
- Percentage of people 3 years and older in K-12 schools:
Sioux Falls Downtown Historic District: 10.7% Sioux Falls: 17.5%
- Percentage of people 3 years and older in undergraduate colleges:
Sioux Falls Downtown Historic District: 3.4% Sioux Falls: 4.1%
- Percentage of people 3 years and older in grad. or professional schools:
Sioux Falls Downtown Historic District: 2.5% Sioux Falls: 1.4%
- Percentage of students K-12 enrolled in private schools:
Sioux Falls Downtown Historic District: 15.5% Sioux Falls: 15.2%
Percentage of population below poverty level:
| Sioux Falls Downtown Historic District: | 10.9% |
| Sioux Falls: | 10.1% |
Median year owner moved in (as recorded in 2022):
Median year renter moved in (as recorded in 2022):
| Sioux Falls Downtown Historic District: | 2009 |
| Sioux Falls: | 2014 |
Median year renter moved in (as recorded in 2022):
| Sioux Falls Downtown Historic District: | 2018 |
| Sioux Falls: | 2021 |
Percentage of married-couple families with both working:
| Sioux Falls Downtown Historic District: | 95.0% |
| Sioux Falls: | 85.2% |
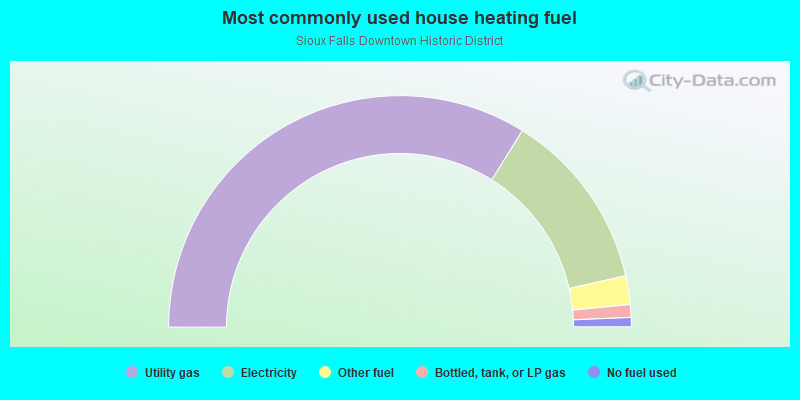
- 67.7%Utility gas
- 25.1%Electricity
- 4.0%Other fuel
- 1.8%Bottled, tank, or LP gas
- 1.3%No fuel used
Highways in this neighborhood:
W 11th St (State Hwy 42)
Length: 0.20 miles
Direction: E-W
Address range: 100 to 299
Direction: E-W
Address range: 100 to 299
State Hwy 42 (E 11th St)
Length: 0.10 miles
Direction: E-W
Address range: 2 to 199
Direction: E-W
Address range: 2 to 199
Roads and streets:
S Phillips Ave
Length: 0.41 miles
Direction: N-S
Address range: 100 to 599
Direction: N-S
Address range: 100 to 599
South Dakota Ave
Length: 0.41 miles
Direction: N-S
Address range: 100 to 599
Direction: N-S
Address range: 100 to 599
S Main Ave
Length: 0.40 miles
Direction: N-S
Address range: 100 to 599
Direction: N-S
Address range: 100 to 599
S 1st Ave
Length: 0.36 miles
Direction: N-S
Address range: 200 to 599
Direction: N-S
Address range: 200 to 599
W 9th St
Length: 0.21 miles
Direction: E-W
Address range: 100 to 299
Direction: E-W
Address range: 100 to 299
W 13th St
Length: 0.21 miles
Direction: E-W
Address range: 100 to 299
Direction: E-W
Address range: 100 to 299
W 10th St
Length: 0.20 miles
Direction: E-W
Address range: 100 to 299
Direction: E-W
Address range: 100 to 299
W 14th St
Length: 0.20 miles
Direction: E-W
Address range: 100 to 299
Direction: E-W
Address range: 100 to 299
W 12th St
Length: 0.20 miles
Direction: E-W
Address range: 100 to 299
Direction: E-W
Address range: 100 to 299
S Mall Ave
Length: 0.19 miles
Directions: E-W, N-S
Address range: 100 to 239
Directions: E-W, N-S
Address range: 100 to 239
E 14th St
Length: 0.11 miles
Direction: E-W
Address range: 100 to 199
Direction: E-W
Address range: 100 to 199
E 10th St
Length: 0.11 miles
Direction: E-W
Address range: 100 to 199
Direction: E-W
Address range: 100 to 199
E 13th St
Length: 0.10 miles
Direction: E-W
Address range: 100 to 199
Direction: E-W
Address range: 100 to 199
E 9th St
Length: 0.07 miles
Direction: E-W
Address range: 100 to 199
Direction: E-W
Address range: 100 to 199