Silver Pointe neighborhood in Las Vegas, Nevada (NV), 89123 detailed profile
Settings
X

Business Search - 14 Million verified businesses
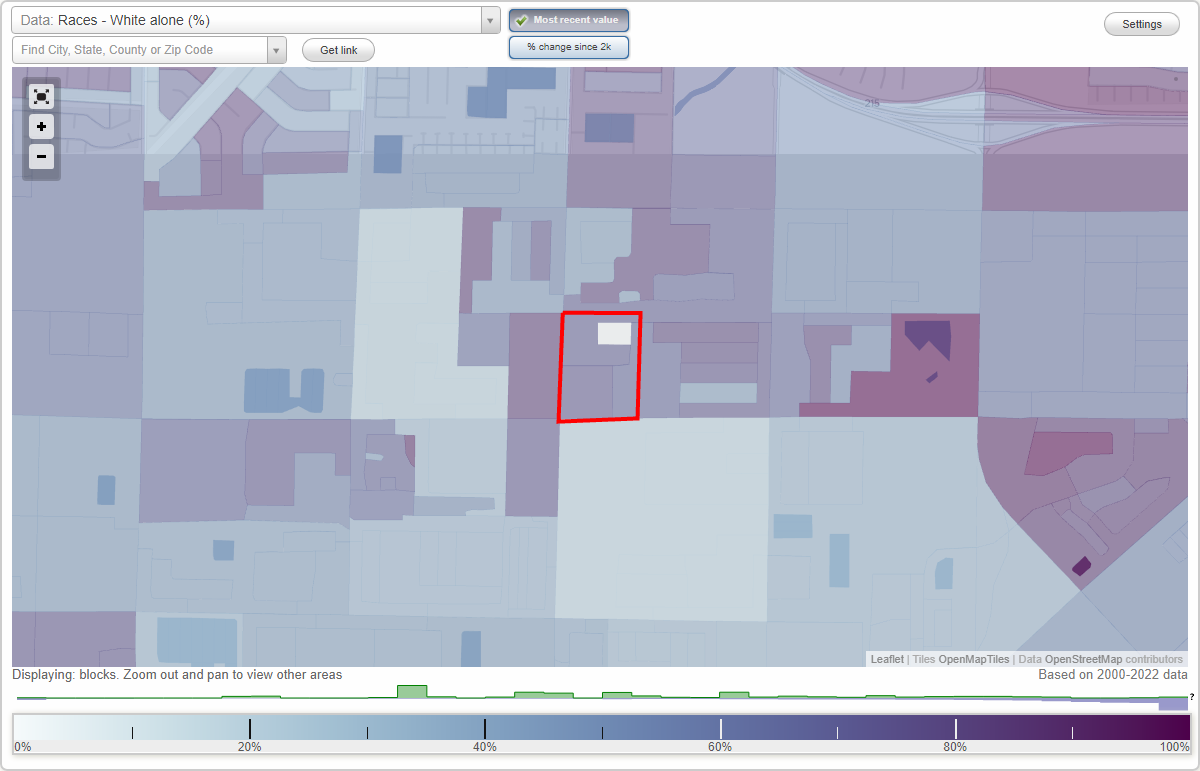
Area: 0.048 square miles
Population: 236
Population density:
| Silver Pointe: | 4,885 people per square mile |
| Las Vegas: | 5,792 people per square mile |

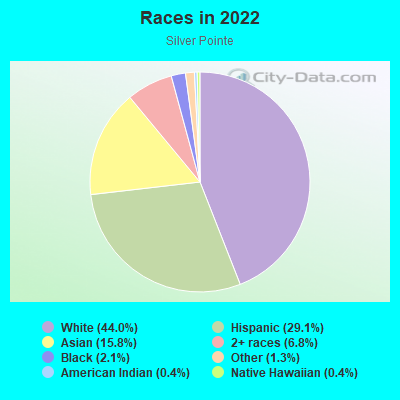
- 10344.0%White
- 6829.1%Hispanic or Latino
- 3715.8%Asian
- 166.8%Two or more races
- 52.1%Black
- 31.3%Some other race
- 10.4%American Indian
- 10.4%Native Hawaiian and Other
Pacific Islander
Median household income in 2022:
| Silver Pointe: | $106,233 |
| Las Vegas: | $68,905 |
Distribution of median household income
![Distribution of median household income]()
- 4Less than $10,000
- 9$10,000 to $19,999
- 3$20,000 to $29,999
- 3$30,000 to $39,999
- 9$40,000 to $49,999
- 4$50,000 to $59,999
- 16$60,000 to $74,999
- 11$75,000 to $99,999
- 8$100,000 to $124,999
- 12$125,000 to $149,999
- 10$150,000 to $199,999
- 14$200,000 or more

Distribution of owner-occupied house/condo value
![Distribution of owner-occupied house/condo value]()
- 1Less than $50,000
- 2$150,000 to $199,999
- 4$200,000 to $249,999
- 5$250,000 to $299,999
- 9$300,000 to $399,999
- 11$400,000 to $499,999
- 19$500,000 to $749,999
- 14$750,000 to $999,999
- 3$1,000,000 or more

Distribution of rent paid by renters
![Distribution of rent paid by renters]()
- 2$700 to $799
- 2$800 to $899
- 1$900 to $999
- 15$1,000 to $1,249
- 3$1,250 to $1,499
- 10$1,500 to $1,999
- 6$2,000 or more

Median rent in 2022:
| Silver Pointe: | $1,713 |
| Las Vegas: | $1,277 |
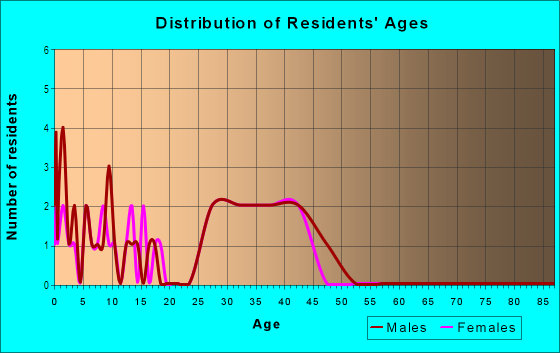
| Males: | 124 |
| Females: | 111 |
Males:
| This neighborhood: | 35.9 years |
| Whole city: | 38.4 years |
| This neighborhood: | 42.3 years |
| Whole city: | 38.9 years |
Average household size:
| Silver Pointe: | 2.8 people |
| Las Vegas: | 2.7 people |
Percentage of family households:
| Silver Pointe: | 37.8% |
| Las Vegas: | 45.8% |
| Here: | 65.6% |
| Las Vegas: | 40.9% |
Percentage of married-couple families with children (among all households):
| Silver Pointe: | 27.4% |
| Las Vegas: | 23.4% |
Percentage of single-mother households (among all households):
| Silver Pointe: | 2.7% |
| Las Vegas: | 10.1% |
Percentage of never married males 15 years old and over:
Percentage of never married females 15 years old and over:
| Silver Pointe: | 15.5% |
| Las Vegas: | 19.7% |
Percentage of never married females 15 years old and over:
| Silver Pointe: | 13.8% |
| city: | 17.0% |
Percentage of people that speak English not well or not at all:
| Silver Pointe: | 6.5% |
| Las Vegas: | 7.0% |
Percentage of people born in this state:
Percentage of people born in another U.S. state:
Percentage of native residents but born outside the U.S.:
Percentage of foreign born residents:
| Here: | 23.3% |
| Las Vegas: | 27.3% |
Percentage of people born in another U.S. state:
| Silver Pointe: | 57.0% |
| Las Vegas: | 49.8% |
Percentage of native residents but born outside the U.S.:
| Here: | 1.2% |
| city: | 1.9% |
Percentage of foreign born residents:
| Here: | 18.5% |
| Las Vegas: | 21.0% |
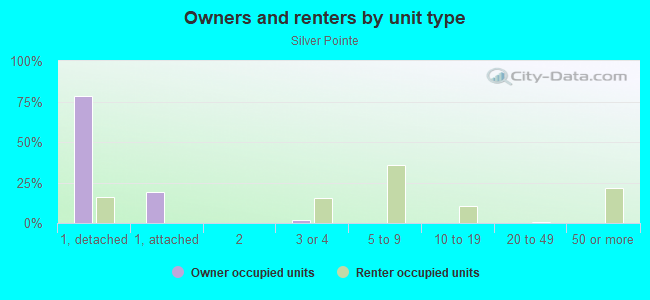
Owner-occupied
Renter-occupied

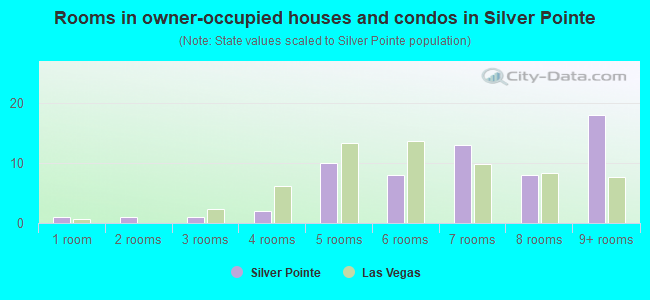
- Rooms in owner-occupied houses and condos in Silver Pointe
- 11 room
- 12 rooms
- 13 rooms
- 24 rooms
- 105 rooms
- 86 rooms
- 137 rooms
- 88 rooms
- 189+ rooms
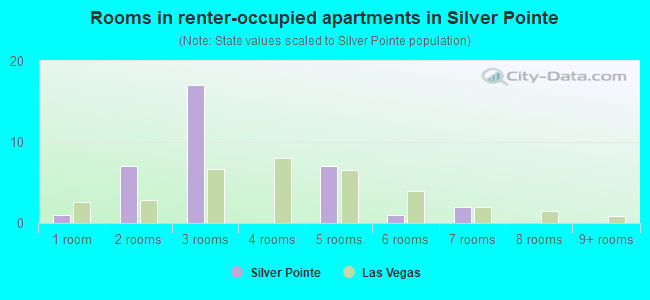
- Rooms in renter-occupied apartments in Silver Pointe
- 11 room
- 72 rooms
- 173 rooms
- 04 rooms
- 75 rooms
- 16 rooms
- 27 rooms
- 08 rooms
- 09+ rooms
Owner-occupied
Renter-occupied
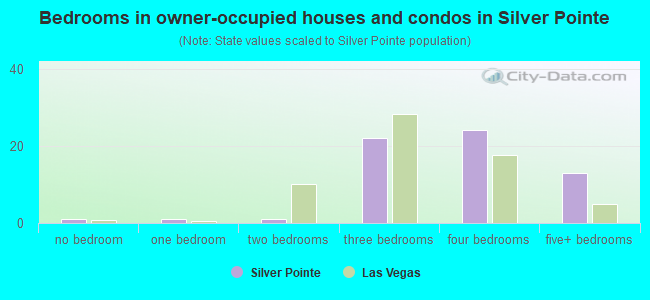
- Bedrooms in owner-occupied houses and condos in Silver Pointe
- 1no bedroom
- 11 bedroom
- 12 bedrooms
- 223 bedrooms
- 244 bedrooms
- 135+ bedrooms
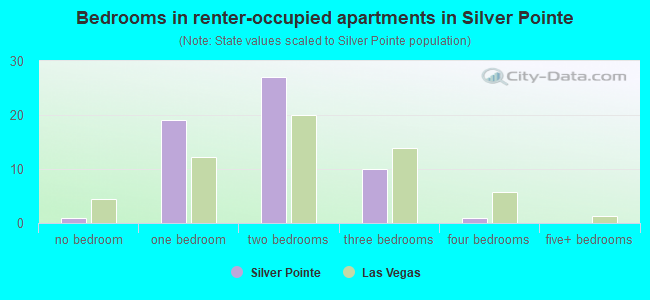
- Bedrooms in renter-occupied apartments in Silver Pointe
- 1no bedroom
- 191 bedroom
- 272 bedrooms
- 103 bedrooms
- 14 bedrooms
- 05+ bedrooms
Average number of cars or other vehicles available in houses/condos:
Average number of cars or other vehicles available in apartments:
| This neighborhood: | 2.1 |
| Las Vegas: | 2.0 |
Average number of cars or other vehicles available in apartments:
| Here: | 2.7 |
| city: | 1.3 |
Percentage of units with a mortgage:
| Silver Pointe: | 70.4% |
| Las Vegas: | 69.3% |
Average estimated value of detached houses in 2022 (100.0% of all units):
| Silver Pointe: | $565,388 |
| Nevada: | $549,327 |
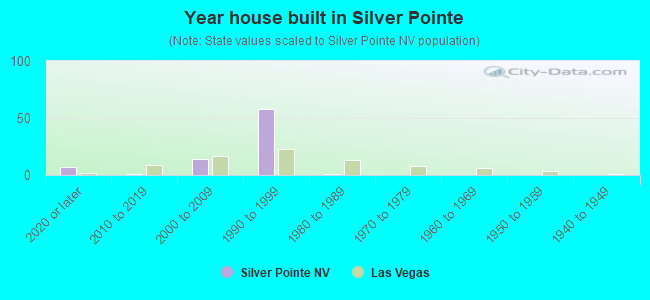
- Year house built in Silver Pointe
- 72020 or later
- 12010 to 2019
- 142000 to 2009
- 581990 to 1999
- 11980 to 1989
- 01970 to 1979
- 01960 to 1969
- 01950 to 1959
- 01940 to 1949
- 01939 or earlier
City-data.com crime index for city in 2020 (higher means more crime):
| City: | 280.7 |
| U.S. average: | 219.5 |
Travel time to work (commute)
![Travel time to work (commute)]()
- 2Less than 5 minutes
- 175 to 9 minutes
- 1510 to 14 minutes
- 1915 to 19 minutes
- 1820 to 24 minutes
- 425 to 29 minutes
- 930 to 34 minutes
- 140 to 44 minutes
- 345 to 59 minutes
- 390 or more minutes

Means of transportation to work
![Means of transportation to work]()
- 66.9%69Drove a car alone
- 17.5%18Carpooled
- 2.9%3Other means
- 14.6%15Worked at home

Time leaving home to go to work
![Time leaving home to go to work]()
- 112:00 a.m. to 4:59 a.m.
- 55:00 a.m. to 5:29 a.m.
- 35:30 a.m. to 5:59 a.m.
- 116:00 a.m. to 6:29 a.m.
- 26:30 a.m. to 6:59 a.m.
- 107:00 a.m. to 7:29 a.m.
- 97:30 a.m. to 7:59 a.m.
- 138:00 a.m. to 8:29 a.m.
- 48:30 a.m. to 8:59 a.m.
- 49:00 a.m. to 9:59 a.m.
- 610:00 a.m. to 10:59 a.m.
- 1412:00 p.m. to 3:59 p.m.
- 74:00 p.m. to 11:59 p.m.

Occupations of males:
- Percentage of males in management occupations (except farmers):
Here: 11.5% city: 9.6%
- Percentage of males in business and financial operations occupations:
Here: 14.4% city: 3.6%
- Percentage of males in community and social services occupations:
Here: 1.1% city: 0.7%
- Percentage of males in legal occupations:
Here: 4.9% city: 0.9%
- Percentage of males in education, training, and library occupations:
Here: 3.7% city: 2.5%
- Percentage of males in arts, design, entertainment, sports, and media occupations:
Here: 1.6% city: 2.5%
- Percentage of males in healthcare practitioners and technical occupations:
Here: 2.5% city: 3.3%
- Percentage of males in service occupations:
Here: 17.4% city: 23.3%
- Percentage of males in sales and office occupations:
Here: 27.9% city: 16.6%
- Percentage of males in construction, extraction, and maintenance occupations:
Here: 6.8% city: 10.6%
- Percentage of males in production occupations:
Here: 2.2% city: 3.3%
- Percentage of males in transportation occupations:
Here: 5.3% city: 6.6%
Occupations of females:
- Percentage of females in management occupations (except farmers):
Here: 13.8% city: 8.5%
- Percentage of females in computer and mathematical occupations:
Here: 4.6% city: 1.1%
- Percentage of females in architecture and engineering occupations:
Here: 2.5% city: 0.4%
- Percentage of females in life, physical, and social science occupations:
Here: 2.5% city: 0.4%
- Percentage of females in legal occupations:
Here: 1.6% city: 1.5%
- Percentage of females in education, training, and library occupations:
Here: 23.6% city: 8.0%
- Percentage of females in healthcare practitioners and technical occupations:
Here: 2.1% city: 7.4%
- Percentage of females in service occupations:
Here: 37.7% city: 26.5%
- Percentage of females in sales and office occupations:
Here: 15.5% city: 30.5%
- Percentage of females in construction, extraction, and maintenance occupations:
Here: 3.1% city: 0.4%
- Percentage of females in production occupations:
Here: 1.2% city: 1.8%
Percentage of people 16-64 in Armed Forces:
| Silver Pointe: | 0.0% |
| Las Vegas: | 1.0% |
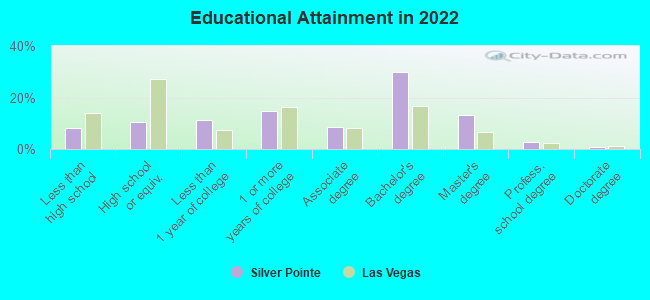
Education in this neighborhood (subdivision or community):
- Percentage of people 3 years and older in K-12 schools:
Silver Pointe: 21.2% Las Vegas: 17.4%
- Percentage of people 3 years and older in undergraduate colleges:
Silver Pointe: 4.2% Las Vegas: 4.2%
- Percentage of people 3 years and older in grad. or professional schools:
Silver Pointe: 3.0% Las Vegas: 1.0%
- Percentage of students K-12 enrolled in private schools:
Silver Pointe: 16.0% Las Vegas: 12.9%
Percentage of population below poverty level:
| Silver Pointe: | 8.1% |
| Las Vegas: | 14.1% |
Median year owner moved in (as recorded in 2022):
Median year renter moved in (as recorded in 2022):
| Silver Pointe: | 2012 |
| Las Vegas: | 2015 |
Median year renter moved in (as recorded in 2022):
| Silver Pointe: | 2015 |
| Las Vegas: | 2020 |
Percentage of married-couple families with both working:
| Silver Pointe: | 52.0% |
| Las Vegas: | 62.0% |
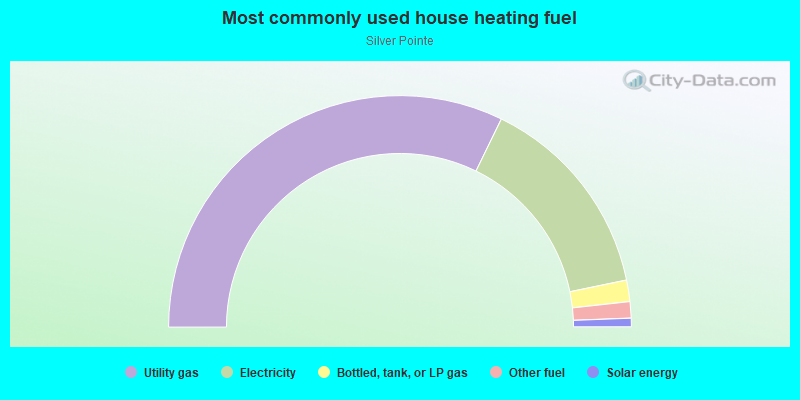
- 64.5%Utility gas
- 29.1%Electricity
- 3.0%Bottled, tank, or LP gas
- 2.3%Other fuel
- 1.2%Solar energy
Roads and streets:
Silver Perch Ave
Length: 0.17 miles
Direction: E-W
Address range: 1200 to 1399
Direction: E-W
Address range: 1200 to 1399
Silver Knoll Ave
Length: 0.17 miles
Direction: E-W
Address range: 1200 to 1369
Direction: E-W
Address range: 1200 to 1369
Escondido St
Length: 0.12 miles
Direction: N-S
Address range: 9500 to 9699
Direction: N-S
Address range: 9500 to 9699
Silver Frost St
Length: 0.10 miles
Directions: N-S, SW-NE
Address range: 9516 to 9598
Directions: N-S, SW-NE
Address range: 9516 to 9598
Silver Fox Way
Length: 0.05 miles
Direction: N-S
Direction: N-S