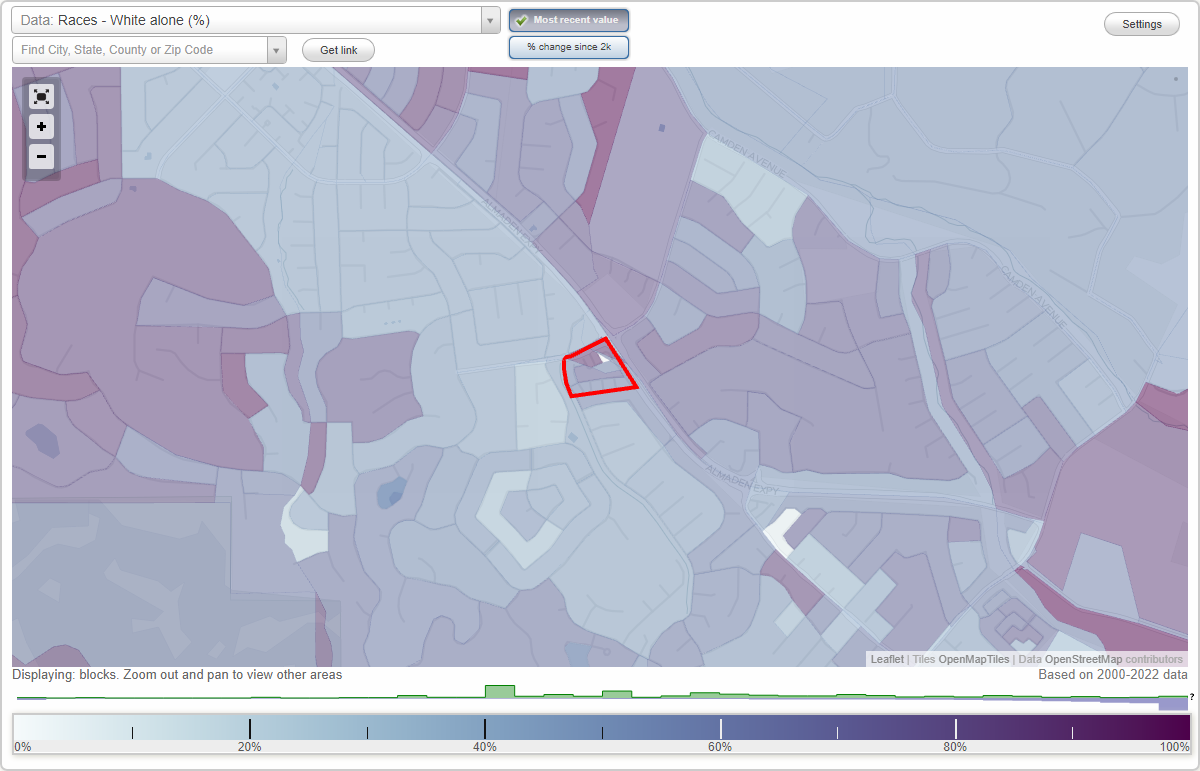
Silver Crest neighborhood in San Jose, California (CA), 95120 detailed profile
Settings
X

Business Search - 14 Million verified businesses
Area: 0.015 square miles
Population: 86
Population density:
| Silver Crest: | 5,891 people per square mile |
| San Jose: | 5,554 people per square mile |

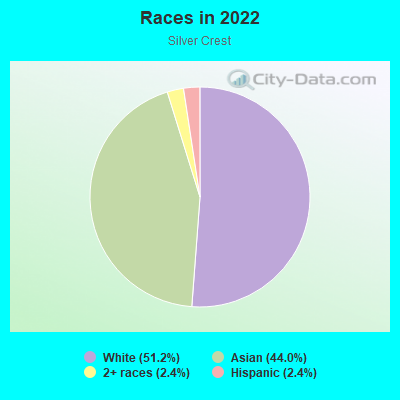
- 4351.2%White
- 3744.0%Asian
- 22.4%Two or more races
- 22.4%Hispanic or Latino
Median household income in 2022:
| Silver Crest: | $241,440 |
| San Jose: | $133,835 |
Distribution of median household income
![Distribution of median household income]()
- 1Less than $10,000
- 1$10,000 to $19,999
- 2$30,000 to $39,999
- 1$40,000 to $49,999
- 1$50,000 to $59,999
- 3$60,000 to $74,999
- 2$75,000 to $99,999
- 2$100,000 to $124,999
- 1$125,000 to $149,999
- 3$150,000 to $199,999
- 19$200,000 or more

Distribution of owner-occupied house/condo value
![Distribution of owner-occupied house/condo value]()
- 1Less than $50,000
- 1$500,000 to $749,999
- 3$750,000 to $999,999
- 22$1,000,000 or more

Distribution of rent paid by renters
![Distribution of rent paid by renters]()
- 1$1,500 to $1,999
- 4$2,000 or more

Median rent in 2022:
| Silver Crest: | $3,501 |
| San Jose: | $2,001 |
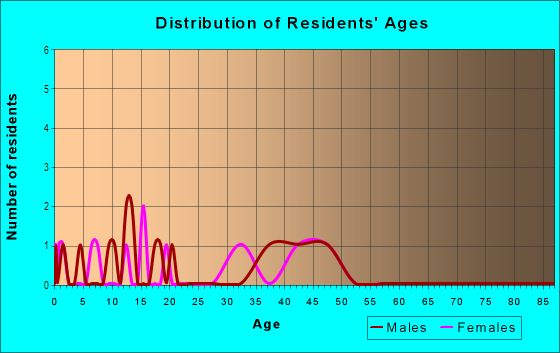
| Males: | 46 |
| Females: | 39 |
Males:
| This neighborhood: | 43.8 years |
| Whole city: | 37.6 years |
| This neighborhood: | 49.2 years |
| Whole city: | 39.1 years |
Average household size:
| Silver Crest: | 2.9 people |
| San Jose: | 2.9 people |
Percentage of family households:
| Silver Crest: | 56.6% |
| San Jose: | 49.9% |
| Here: | 77.2% |
| San Jose: | 53.0% |
Percentage of married-couple families with children (among all households):
| Silver Crest: | 30.8% |
| San Jose: | 25.8% |
Percentage of single-mother households (among all households):
| Silver Crest: | 2.1% |
| San Jose: | 5.2% |
Percentage of never married males 15 years old and over:
Percentage of never married females 15 years old and over:
| Silver Crest: | 11.8% |
| San Jose: | 20.9% |
Percentage of never married females 15 years old and over:
| Silver Crest: | 6.7% |
| city: | 16.7% |
Percentage of people that speak English not well or not at all:
| Silver Crest: | 0.0% |
| San Jose: | 11.4% |
Percentage of people born in this state:
Percentage of people born in another U.S. state:
Percentage of native residents but born outside the U.S.:
Percentage of foreign born residents:
| Here: | 47.4% |
| San Jose: | 46.1% |
Percentage of people born in another U.S. state:
| Silver Crest: | 19.3% |
| San Jose: | 10.4% |
Percentage of native residents but born outside the U.S.:
| Here: | 0.9% |
| city: | 1.7% |
Percentage of foreign born residents:
| Here: | 32.3% |
| San Jose: | 41.8% |
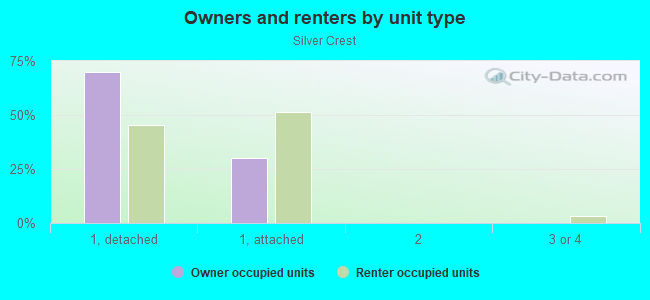
Owner-occupied
Renter-occupied

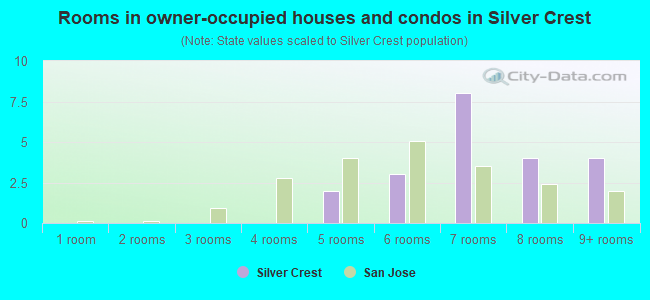
- Rooms in owner-occupied houses and condos in Silver Crest
- 01 room
- 02 rooms
- 03 rooms
- 04 rooms
- 25 rooms
- 36 rooms
- 87 rooms
- 48 rooms
- 49+ rooms
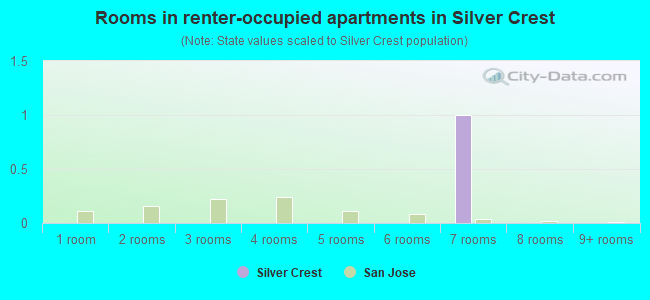
- Rooms in renter-occupied apartments in Silver Crest
- 01 room
- 02 rooms
- 03 rooms
- 04 rooms
- 05 rooms
- 06 rooms
- 17 rooms
- 08 rooms
- 09+ rooms
Owner-occupied
Renter-occupied
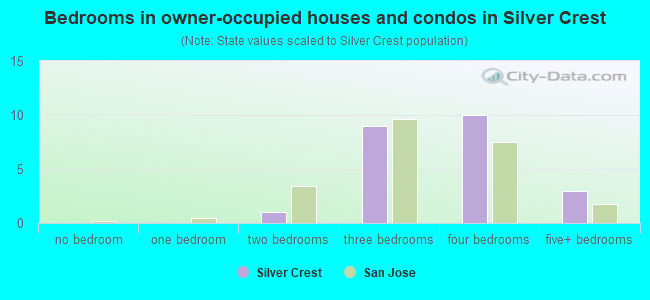
- Bedrooms in owner-occupied houses and condos in Silver Crest
- 0no bedroom
- 01 bedroom
- 12 bedrooms
- 93 bedrooms
- 104 bedrooms
- 35+ bedrooms
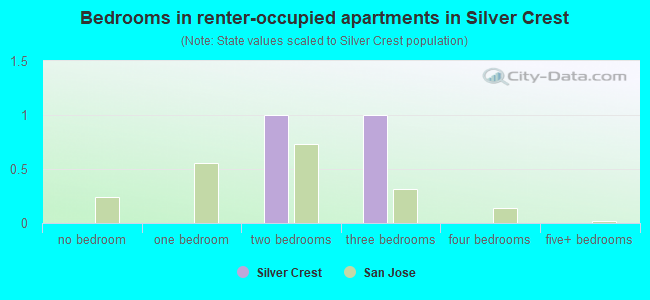
- Bedrooms in renter-occupied apartments in Silver Crest
- 0no bedroom
- 01 bedroom
- 12 bedrooms
- 13 bedrooms
- 04 bedrooms
- 05+ bedrooms
Average number of cars or other vehicles available in houses/condos:
Average number of cars or other vehicles available in apartments:
| This neighborhood: | 2.3 |
| San Jose: | 2.3 |
Average number of cars or other vehicles available in apartments:
| Here: | 2.0 |
| city: | 1.6 |
Percentage of units with a mortgage:
| Silver Crest: | 66.5% |
| San Jose: | 66.9% |
Housing prices:
- Average estimated value of detached houses in 2022 (67.7% of all units):
Silver Crest: $1,770,657 San Jose: $1,532,815
- Average estimated value of townhouses or other attached units in 2022 (29.0% of all units):
This neighborhood: $1,048,132 city: $1,024,857
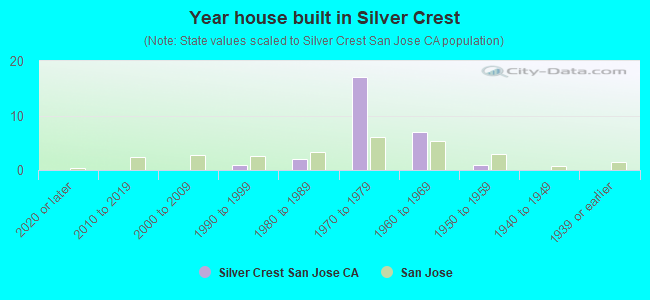
- Year house built in Silver Crest
- 02020 or later
- 02010 to 2019
- 02000 to 2009
- 11990 to 1999
- 21980 to 1989
- 171970 to 1979
- 71960 to 1969
- 11950 to 1959
- 01940 to 1949
- 01939 or earlier
City-data.com crime index for city in 2020 (higher means more crime):
| City: | 268.4 |
| U.S. average: | 219.5 |
Travel time to work (commute)
![Travel time to work (commute)]()
- 415 to 19 minutes
- 220 to 24 minutes
- 125 to 29 minutes
- 230 to 34 minutes
- 235 to 39 minutes
- 240 to 44 minutes
- 645 to 59 minutes
- 360 to 89 minutes

Means of transportation to work
![Means of transportation to work]()
- 56.3%22Drove a car alone
- 7.7%3Carpooled
- 28.1%11Worked at home

Time leaving home to go to work
![Time leaving home to go to work]()
- 16:00 a.m. to 6:29 a.m.
- 46:30 a.m. to 6:59 a.m.
- 27:00 a.m. to 7:29 a.m.
- 27:30 a.m. to 7:59 a.m.
- 58:00 a.m. to 8:29 a.m.
- 38:30 a.m. to 8:59 a.m.
- 29:00 a.m. to 9:59 a.m.
- 210:00 a.m. to 10:59 a.m.
- 111:00 a.m. to 11:59 a.m.
- 112:00 p.m. to 3:59 p.m.

Occupations of males:
- Percentage of males in management occupations (except farmers):
Here: 29.6% city: 13.0%
- Percentage of males in business and financial operations occupations:
Here: 6.0% city: 4.6%
- Percentage of males in computer and mathematical occupations:
Here: 33.0% city: 13.6%
- Percentage of males in architecture and engineering occupations:
Here: 7.1% city: 10.2%
- Percentage of males in legal occupations:
Here: 2.1% city: 0.8%
- Percentage of males in arts, design, entertainment, sports, and media occupations:
Here: 2.0% city: 1.8%
- Percentage of males in healthcare practitioners and technical occupations:
Here: 1.9% city: 2.0%
- Percentage of males in service occupations:
Here: 1.1% city: 12.7%
- Percentage of males in sales and office occupations:
Here: 12.8% city: 12.8%
- Percentage of males in construction, extraction, and maintenance occupations:
Here: 1.1% city: 7.8%
- Percentage of males in transportation occupations:
Here: 1.2% city: 3.6%
Occupations of females:
- Percentage of females in management occupations (except farmers):
Here: 12.4% city: 11.0%
- Percentage of females in business and financial operations occupations:
Here: 19.2% city: 8.6%
- Percentage of females in computer and mathematical occupations:
Here: 7.2% city: 5.4%
- Percentage of females in architecture and engineering occupations:
Here: 6.7% city: 2.8%
- Percentage of females in legal occupations:
Here: 2.3% city: 1.3%
- Percentage of females in education, training, and library occupations:
Here: 20.4% city: 8.1%
- Percentage of females in healthcare practitioners and technical occupations:
Here: 9.7% city: 6.8%
- Percentage of females in service occupations:
Here: 9.0% city: 21.7%
- Percentage of females in sales and office occupations:
Here: 12.4% city: 22.0%
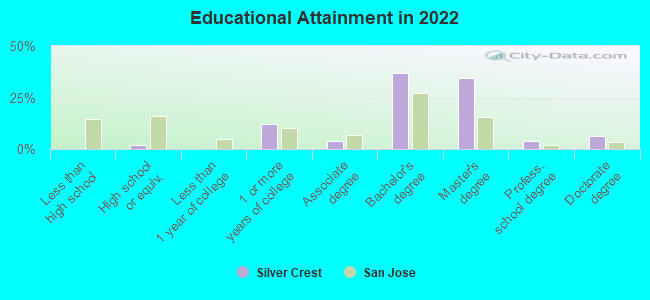
Education in this neighborhood (subdivision or community):
- Percentage of people 3 years and older in K-12 schools:
Silver Crest: 17.9% San Jose: 16.1%
- Percentage of people 3 years and older in undergraduate colleges:
Silver Crest: 4.8% San Jose: 6.5%
- Percentage of people 3 years and older in grad. or professional schools:
Silver Crest: 0.0% San Jose: 2.0%
- Percentage of students K-12 enrolled in private schools:
Silver Crest: 0.0% San Jose: 14.9%
Percentage of population below poverty level:
| Silver Crest: | 0.7% |
| San Jose: | 9.0% |
Median year owner moved in (as recorded in 2022):
Median year renter moved in (as recorded in 2022):
| Silver Crest: | 2004 |
| San Jose: | 2008 |
Median year renter moved in (as recorded in 2022):
| Silver Crest: | 2018 |
| San Jose: | 2020 |
Percentage of married-couple families with both working:
| Silver Crest: | 66.0% |
| San Jose: | 72.5% |
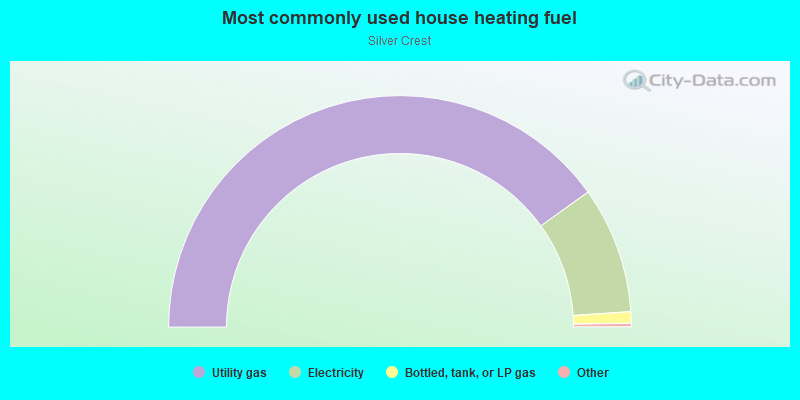
- 80.2%Utility gas
- 17.7%Electricity
- 1.6%Bottled, tank, or LP gas
Roads and streets:
Silver Shadow Dr
Length: 0.10 miles
Directions: E-W, SE-NW
Address range: 1100 to 1199
Directions: E-W, SE-NW
Address range: 1100 to 1199
Silver Canyon Dr
Length: 0.09 miles
Directions: E-W, N-S
Address range: 1100 to 1199
Directions: E-W, N-S
Address range: 1100 to 1199
Silver Bell Dr
Length: 0.07 miles
Directions: N-S, SE-NW
Address range: 6900 to 7099
Directions: N-S, SE-NW
Address range: 6900 to 7099
Silver Hill Dr
Length: 0.06 miles
Directions: E-W, SW-NE
Directions: E-W, SW-NE
Rajkovich Way
Length: 0.06 miles
Direction: E-W
Direction: E-W
Silver Moon Ct
Length: 0.03 miles
Direction: N-S
Address range: 7000 to 7099
Direction: N-S
Address range: 7000 to 7099
Silver Peak Dr
Length: 0.02 miles
Direction: N-S
Direction: N-S