Sierramont neighborhood in San Jose, California (CA), 95132 detailed profile
Settings
X

Business Search - 14 Million verified businesses
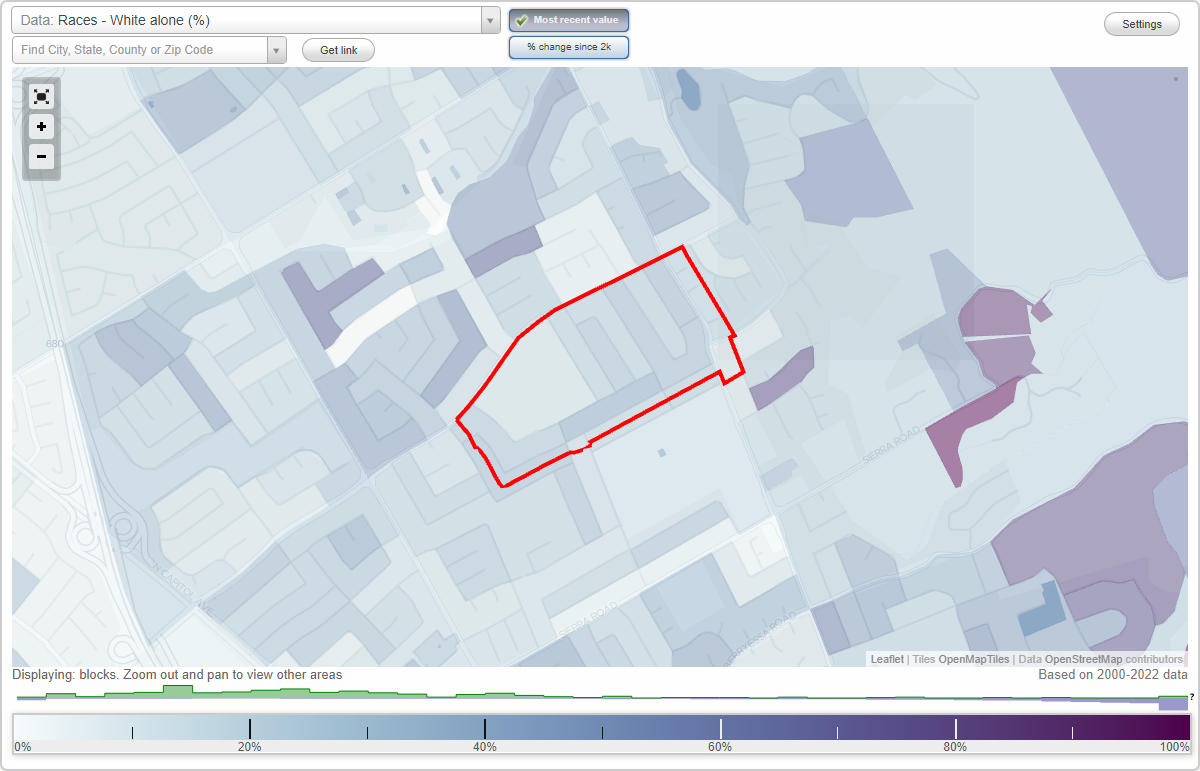
Area: 0.188 square miles
Population: 2,229
Population density:
| Sierramont: | 11,853 people per square mile |
| San Jose: | 5,554 people per square mile |

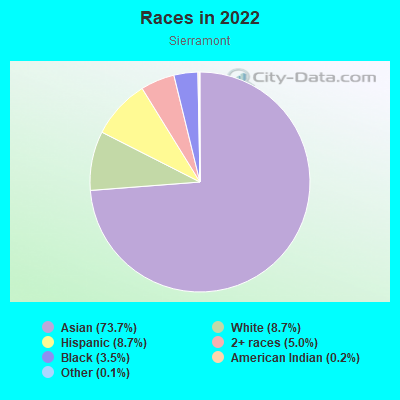
- 1,72173.7%Asian
- 2048.7%White
- 2038.7%Hispanic or Latino
- 1165.0%Two or more races
- 823.5%Black
- 50.2%American Indian
- 30.1%Some other race
Median household income in 2022:
| Sierramont: | $178,593 |
| San Jose: | $133,835 |
Distribution of median household income
![Distribution of median household income]()
- 8Less than $10,000
- 32$10,000 to $19,999
- 27$20,000 to $29,999
- 10$30,000 to $39,999
- 97$40,000 to $49,999
- 44$50,000 to $59,999
- 1$60,000 to $74,999
- 48$75,000 to $99,999
- 64$100,000 to $124,999
- 56$125,000 to $149,999
- 79$150,000 to $199,999
- 269$200,000 or more

Distribution of owner-occupied house/condo value
![Distribution of owner-occupied house/condo value]()
- 9Less than $50,000
- 42$100,000 to $149,999
- 4$400,000 to $499,999
- 7$500,000 to $749,999
- 32$750,000 to $999,999
- 447$1,000,000 or more

Distribution of rent paid by renters
![Distribution of rent paid by renters]()
- 1$200 to $299
- 1$300 to $399
- 4$400 to $499
- 1$500 to $599
- 1$800 to $899
- 1$1,000 to $1,249
- 17$1,250 to $1,499
- 43$1,500 to $1,999
- 120$2,000 or more

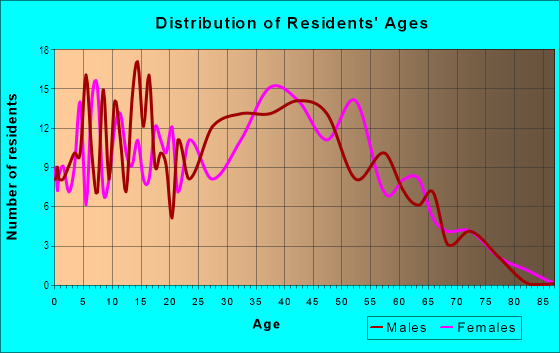
| Males: | 1,165 |
| Females: | 1,064 |
Males:
| This neighborhood: | 41.2 years |
| Whole city: | 37.6 years |
| This neighborhood: | 47.1 years |
| Whole city: | 39.1 years |
Average household size:
| Sierramont: | 3.5 people |
| San Jose: | 2.9 people |
Percentage of family households:
| Sierramont: | 60.5% |
| San Jose: | 49.9% |
| Here: | 81.1% |
| San Jose: | 53.0% |
Percentage of married-couple families with children (among all households):
| Sierramont: | 24.6% |
| San Jose: | 25.8% |
Percentage of single-mother households (among all households):
| Sierramont: | 3.6% |
| San Jose: | 5.2% |
Percentage of never married males 15 years old and over:
Percentage of never married females 15 years old and over:
| Sierramont: | 21.1% |
| San Jose: | 20.9% |
Percentage of never married females 15 years old and over:
| Sierramont: | 12.9% |
| city: | 16.7% |
Percentage of people that speak English not well or not at all:
| Sierramont: | 7.5% |
| San Jose: | 11.4% |
Percentage of people born in this state:
Percentage of people born in another U.S. state:
Percentage of native residents but born outside the U.S.:
Percentage of foreign born residents:
| Here: | 36.7% |
| San Jose: | 46.1% |
Percentage of people born in another U.S. state:
| Sierramont: | 10.3% |
| San Jose: | 10.4% |
Percentage of native residents but born outside the U.S.:
| Here: | 1.1% |
| city: | 1.7% |
Percentage of foreign born residents:
| Here: | 51.9% |
| San Jose: | 41.8% |
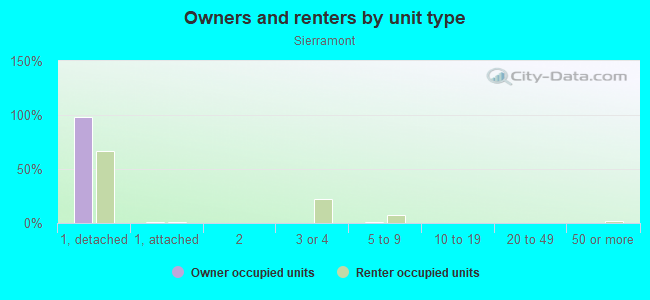
Owner-occupied
Renter-occupied

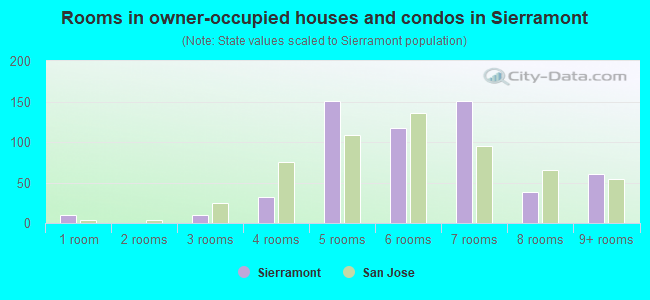
- Rooms in owner-occupied houses and condos in Sierramont
- 101 room
- 02 rooms
- 103 rooms
- 324 rooms
- 1505 rooms
- 1176 rooms
- 1507 rooms
- 388 rooms
- 619+ rooms
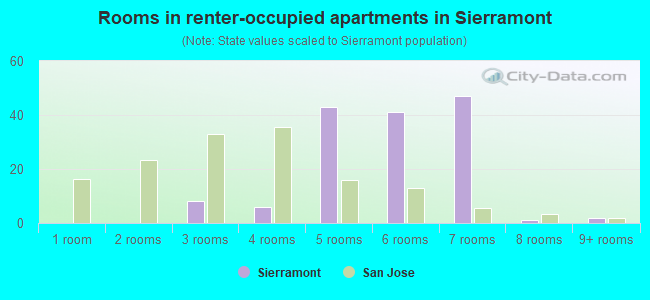
- Rooms in renter-occupied apartments in Sierramont
- 01 room
- 02 rooms
- 83 rooms
- 64 rooms
- 435 rooms
- 416 rooms
- 477 rooms
- 18 rooms
- 29+ rooms
Owner-occupied
Renter-occupied
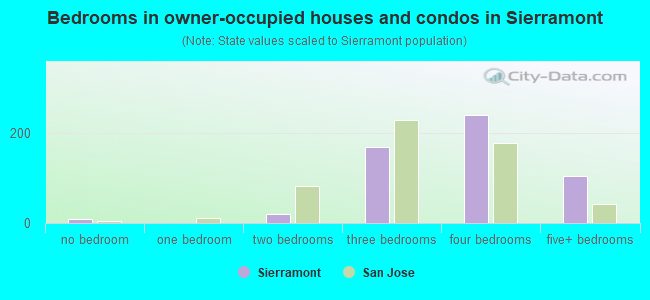
- Bedrooms in owner-occupied houses and condos in Sierramont
- 10no bedroom
- 11 bedroom
- 202 bedrooms
- 1703 bedrooms
- 2414 bedrooms
- 1055+ bedrooms
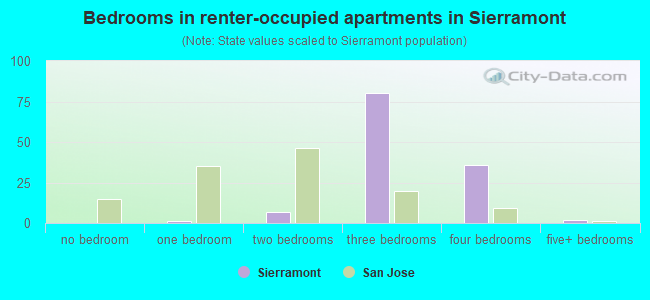
- Bedrooms in renter-occupied apartments in Sierramont
- 0no bedroom
- 11 bedroom
- 72 bedrooms
- 803 bedrooms
- 364 bedrooms
- 25+ bedrooms
Average number of cars or other vehicles available in houses/condos:
Average number of cars or other vehicles available in apartments:
| This neighborhood: | 2.8 |
| San Jose: | 2.3 |
Average number of cars or other vehicles available in apartments:
| Here: | 3.7 |
| city: | 1.6 |
Percentage of units with a mortgage:
| Sierramont: | 65.4% |
| San Jose: | 66.9% |
Average estimated value of detached houses in 2022 (100.0% of all units):
| Sierramont: | $1,229,783 |
| San Jose: | $1,532,815 |
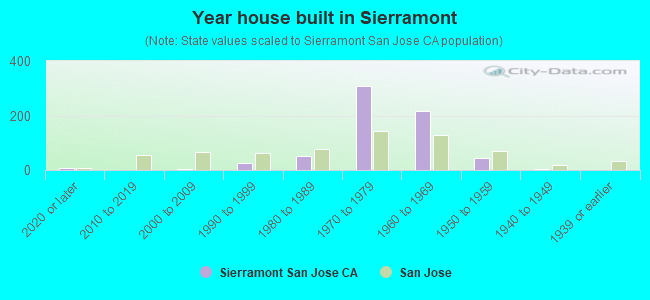
- Year house built in Sierramont
- 82020 or later
- 02010 to 2019
- 52000 to 2009
- 271990 to 1999
- 511980 to 1989
- 3101970 to 1979
- 2151960 to 1969
- 441950 to 1959
- 51940 to 1949
- 01939 or earlier
City-data.com crime index for city in 2020 (higher means more crime):
| City: | 268.4 |
| U.S. average: | 219.5 |
Travel time to work (commute)
![Travel time to work (commute)]()
- 72Less than 5 minutes
- 225 to 9 minutes
- 2510 to 14 minutes
- 11815 to 19 minutes
- 16320 to 24 minutes
- 7825 to 29 minutes
- 16730 to 34 minutes
- 3035 to 39 minutes
- 5840 to 44 minutes
- 6845 to 59 minutes
- 6660 to 89 minutes
- 2990 or more minutes

Means of transportation to work
![Means of transportation to work]()
- 75.8%958Drove a car alone
- 15.7%199Carpooled
- 3.2%41Bus
- 2.7%34Subway or elevated rail
- 0.5%6Long-distance train or commuter rail
- 0.5%6Walked
- 0.9%12Other means
- 9.8%124Worked at home

Time leaving home to go to work
![Time leaving home to go to work]()
- 1412:00 a.m. to 4:59 a.m.
- 225:00 a.m. to 5:29 a.m.
- 235:30 a.m. to 5:59 a.m.
- 276:00 a.m. to 6:29 a.m.
- 206:30 a.m. to 6:59 a.m.
- 1457:00 a.m. to 7:29 a.m.
- 677:30 a.m. to 7:59 a.m.
- 1418:00 a.m. to 8:29 a.m.
- 1088:30 a.m. to 8:59 a.m.
- 1629:00 a.m. to 9:59 a.m.
- 2210:00 a.m. to 10:59 a.m.
- 1011:00 a.m. to 11:59 a.m.
- 6612:00 p.m. to 3:59 p.m.
- 404:00 p.m. to 11:59 p.m.

Occupations of males:
- Percentage of males in management occupations (except farmers):
Here: 3.8% city: 13.0%
- Percentage of males in business and financial operations occupations:
Here: 4.1% city: 4.6%
- Percentage of males in computer and mathematical occupations:
Here: 21.2% city: 13.6%
- Percentage of males in architecture and engineering occupations:
Here: 17.5% city: 10.2%
- Percentage of males in education, training, and library occupations:
Here: 1.3% city: 2.8%
- Percentage of males in arts, design, entertainment, sports, and media occupations:
Here: 2.3% city: 1.8%
- Percentage of males in healthcare practitioners and technical occupations:
Here: 2.1% city: 2.0%
- Percentage of males in service occupations:
Here: 14.2% city: 12.7%
- Percentage of males in sales and office occupations:
Here: 14.6% city: 12.8%
- Percentage of males in construction, extraction, and maintenance occupations:
Here: 2.9% city: 7.8%
- Percentage of males in production occupations:
Here: 9.2% city: 5.5%
- Percentage of males in material moving occupations:
Here: 6.0% city: 3.1%
Occupations of females:
- Percentage of females in management occupations (except farmers):
Here: 14.8% city: 11.0%
- Percentage of females in business and financial operations occupations:
Here: 5.1% city: 8.6%
- Percentage of females in computer and mathematical occupations:
Here: 6.3% city: 5.4%
- Percentage of females in architecture and engineering occupations:
Here: 6.8% city: 2.8%
- Percentage of females in life, physical, and social science occupations:
Here: 1.2% city: 1.7%
- Percentage of females in legal occupations:
Here: 2.0% city: 1.3%
- Percentage of females in education, training, and library occupations:
Here: 8.2% city: 8.1%
- Percentage of females in arts, design, entertainment, sports, and media occupations:
Here: 2.9% city: 2.0%
- Percentage of females in healthcare practitioners and technical occupations:
Here: 4.9% city: 6.8%
- Percentage of females in service occupations:
Here: 11.3% city: 21.7%
- Percentage of females in sales and office occupations:
Here: 34.8% city: 22.0%
- Percentage of females in production occupations:
Here: 1.6% city: 4.0%
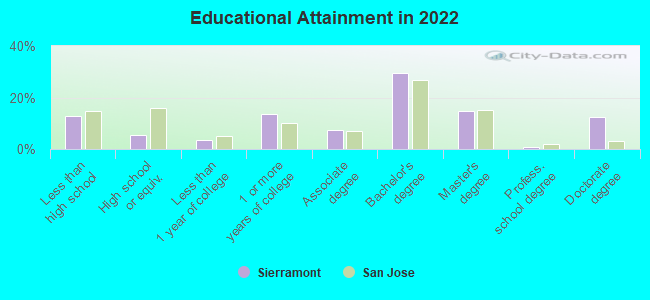
Education in this neighborhood (subdivision or community):
- Percentage of people 3 years and older in K-12 schools:
Sierramont: 17.5% San Jose: 16.1%
- Percentage of people 3 years and older in undergraduate colleges:
Sierramont: 11.5% San Jose: 6.5%
- Percentage of people 3 years and older in grad. or professional schools:
Sierramont: 1.0% San Jose: 2.0%
- Percentage of students K-12 enrolled in private schools:
Sierramont: 50.4% San Jose: 14.9%
Percentage of population below poverty level:
| Sierramont: | 5.3% |
| San Jose: | 9.0% |
Median year owner moved in (as recorded in 2022):
| Sierramont: | 2003 |
| San Jose: | 2008 |
Percentage of married-couple families with both working:
| Sierramont: | 88.8% |
| San Jose: | 72.5% |
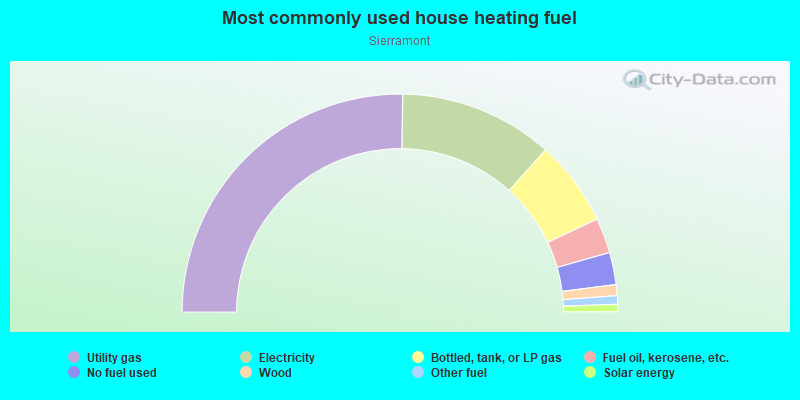
- 50.4%Utility gas
- 22.9%Electricity
- 12.7%Bottled, tank, or LP gas
- 5.2%Fuel oil, kerosene, etc.
- 4.8%No fuel used
- 1.6%Wood
- 1.3%Other fuel
- 1.1%Solar energy
Roads and streets:
Mattos Ave
Length: 0.67 miles
Directions: E-W, SW-NE
Address range: 3000 to 3299
Directions: E-W, SW-NE
Address range: 3000 to 3299
Kimlee Dr
Length: 0.45 miles
Directions: E-W, SW-NE
Address range: 3100 to 3299
Directions: E-W, SW-NE
Address range: 3100 to 3299
Mardan Dr
Length: 0.25 miles
Directions: E-W, SE-NW
Address range: 1400 to 1499
Directions: E-W, SE-NW
Address range: 1400 to 1499
Piedmont Rd
Length: 0.24 miles
Directions: N-S, SE-NW
Address range: 1401 to 1479
Directions: N-S, SE-NW
Address range: 1401 to 1479
Japaul Ln
Length: 0.20 miles
Direction: SE-NW
Address range: 1400 to 1486
Direction: SE-NW
Address range: 1400 to 1486
Proud Dr
Length: 0.07 miles
Direction: SE-NW
Address range: 1447 to 1499
Direction: SE-NW
Address range: 1447 to 1499
Inspiration Dr
Length: 0.07 miles
Direction: SW-NE
Direction: SW-NE
Stone Creek Dr
Length: 0.07 miles
Directions: N-S, SE-NW, SW-NE
Address range: 1400 to 1431
Directions: N-S, SE-NW, SW-NE
Address range: 1400 to 1431
Old Piedmont Rd
Length: 0.06 miles
Direction: E-W
Direction: E-W
Danby Ave
Length: 0.05 miles
Directions: N-S, SE-NW
Address range: 1451 to 1499
Directions: N-S, SE-NW
Address range: 1451 to 1499
Shaffer Dr
Length: 0.05 miles
Directions: N-S, SE-NW
Directions: N-S, SE-NW
Crosley Ct
Length: 0.04 miles
Direction: SW-NE
Direction: SW-NE
Salinas Ct
Length: 0.04 miles
Direction: SW-NE
Address range: 3300 to 3399
Direction: SW-NE
Address range: 3300 to 3399
Inspiration Ct
Length: 0.04 miles
Directions: E-W, SW-NE
Address range: 3300 to 3399
Directions: E-W, SW-NE
Address range: 3300 to 3399