Sierra neighborhood in San Jose, California (CA), 95116 detailed profile
Settings
X

Business Search - 14 Million verified businesses
Area: 0.110 square miles
Population: 1,684
Population density:
| Sierra: | 15,372 people per square mile |
| San Jose: | 5,554 people per square mile |

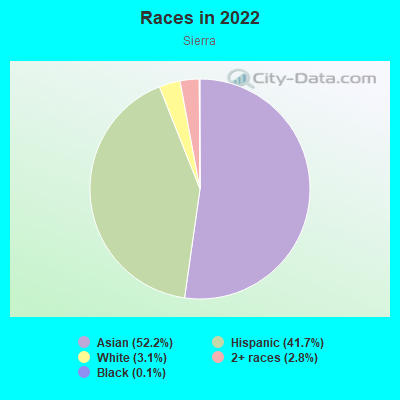
- 88052.2%Asian
- 70341.7%Hispanic or Latino
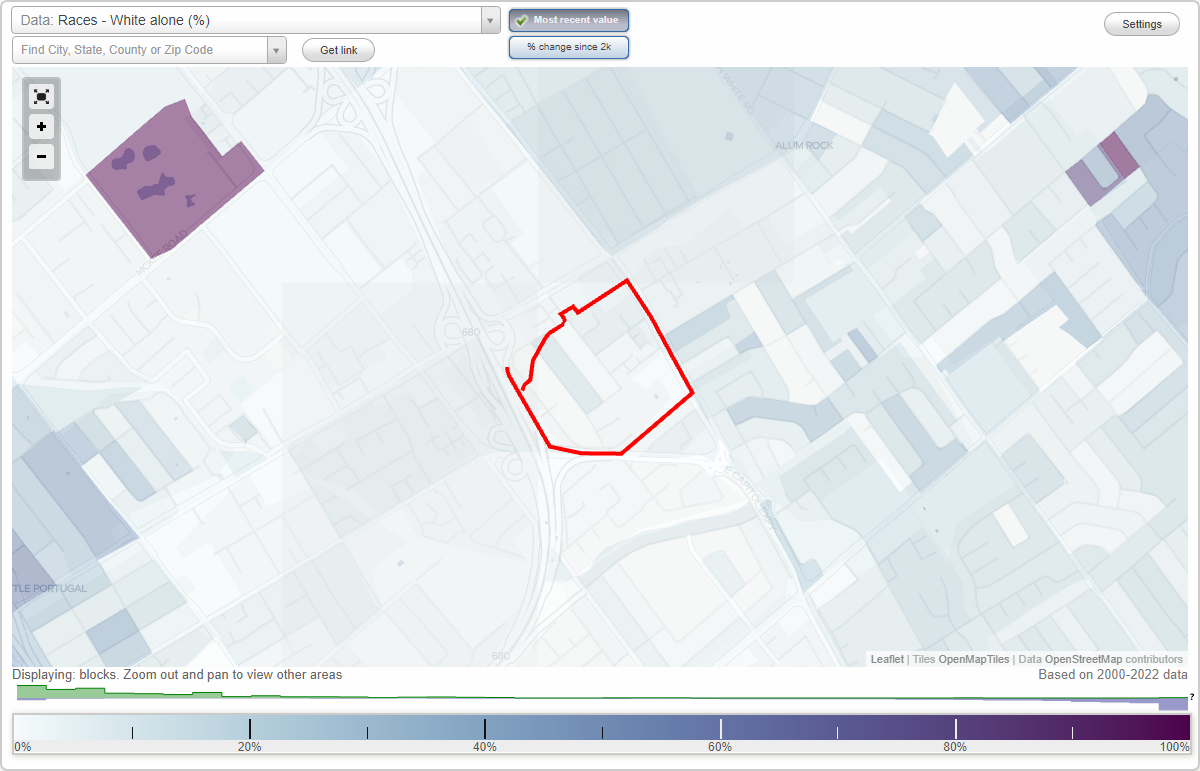
- 523.1%White
- 482.8%Two or more races
- 20.1%Black
Median household income in 2022:
| Sierra: | $87,360 |
| San Jose: | $133,835 |
Distribution of median household income
![Distribution of median household income]()
- 12Less than $10,000
- 58$10,000 to $19,999
- 20$20,000 to $29,999
- 16$30,000 to $39,999
- 27$40,000 to $49,999
- 28$50,000 to $59,999
- 46$60,000 to $74,999
- 76$75,000 to $99,999
- 27$100,000 to $124,999
- 59$125,000 to $149,999
- 14$150,000 to $199,999
- 65$200,000 or more

Distribution of owner-occupied house/condo value
![Distribution of owner-occupied house/condo value]()
- 20Less than $50,000
- 7$50,000 to $99,999
- 4$300,000 to $399,999
- 15$400,000 to $499,999
- 24$500,000 to $749,999
- 58$750,000 to $999,999
- 58$1,000,000 or more

Distribution of rent paid by renters
![Distribution of rent paid by renters]()
- 8Less than $100
- 9$200 to $299
- 13$300 to $399
- 8$400 to $499
- 9$800 to $899
- 35$900 to $999
- 11$1,000 to $1,249
- 40$1,250 to $1,499
- 82$1,500 to $1,999
- 110$2,000 or more

Median rent in 2022:
| Sierra: | $1,821 |
| San Jose: | $2,001 |
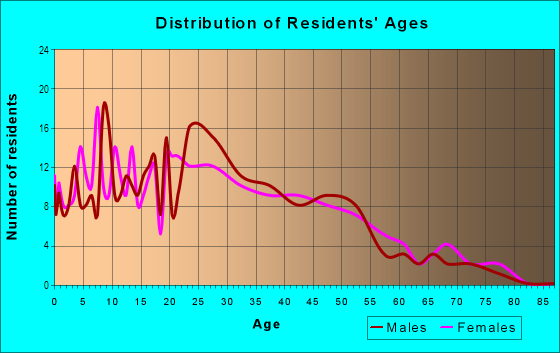
| Males: | 813 |
| Females: | 871 |
Males:
| This neighborhood: | 38.8 years |
| Whole city: | 37.6 years |
| This neighborhood: | 40.7 years |
| Whole city: | 39.1 years |
Average household size:
| Sierra: | 3.7 people |
| San Jose: | 2.9 people |
Percentage of family households:
| Sierra: | 47.2% |
| San Jose: | 49.9% |
| Here: | 52.4% |
| San Jose: | 53.0% |
Percentage of married-couple families with children (among all households):
| Sierra: | 19.2% |
| San Jose: | 25.8% |
Percentage of single-mother households (among all households):
| Sierra: | 3.1% |
| San Jose: | 5.2% |
Percentage of never married males 15 years old and over:
Percentage of never married females 15 years old and over:
| Sierra: | 26.7% |
| San Jose: | 20.9% |
Percentage of never married females 15 years old and over:
| Sierra: | 21.6% |
| city: | 16.7% |
Percentage of people that speak English not well or not at all:
| Sierra: | 26.8% |
| San Jose: | 11.4% |
Percentage of people born in this state:
Percentage of people born in another U.S. state:
Percentage of native residents but born outside the U.S.:
Percentage of foreign born residents:
| Here: | 46.5% |
| San Jose: | 46.1% |
Percentage of people born in another U.S. state:
| Sierra: | 1.5% |
| San Jose: | 10.4% |
Percentage of native residents but born outside the U.S.:
| Here: | 1.6% |
| city: | 1.7% |
Percentage of foreign born residents:
| Here: | 50.5% |
| San Jose: | 41.8% |
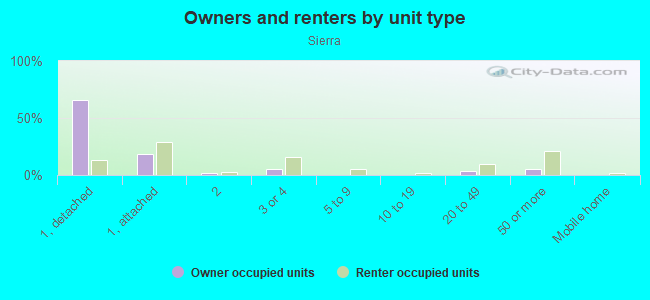
Owner-occupied
Renter-occupied

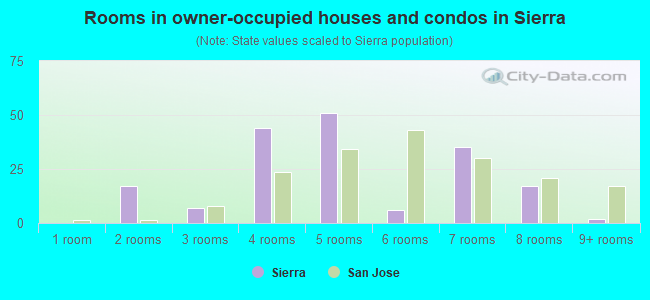
- Rooms in owner-occupied houses and condos in Sierra
- 01 room
- 172 rooms
- 73 rooms
- 444 rooms
- 515 rooms
- 66 rooms
- 357 rooms
- 178 rooms
- 29+ rooms
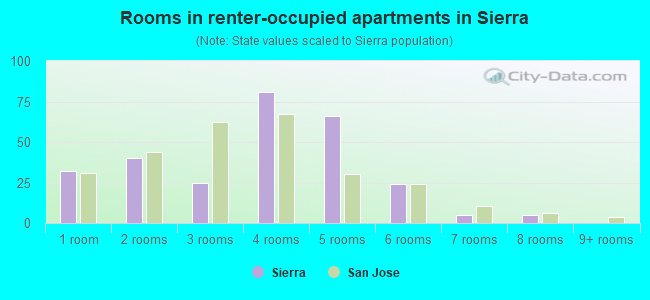
- Rooms in renter-occupied apartments in Sierra
- 321 room
- 402 rooms
- 253 rooms
- 814 rooms
- 665 rooms
- 246 rooms
- 57 rooms
- 58 rooms
- 09+ rooms
Owner-occupied
Renter-occupied
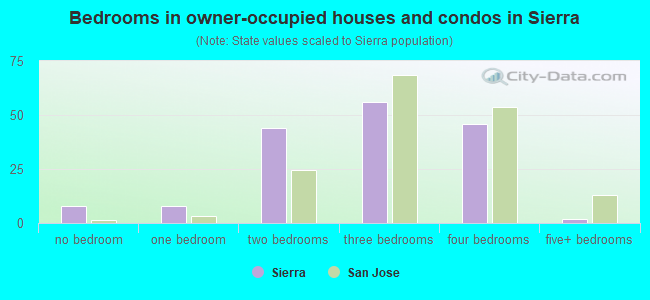
- Bedrooms in owner-occupied houses and condos in Sierra
- 8no bedroom
- 81 bedroom
- 442 bedrooms
- 563 bedrooms
- 464 bedrooms
- 25+ bedrooms
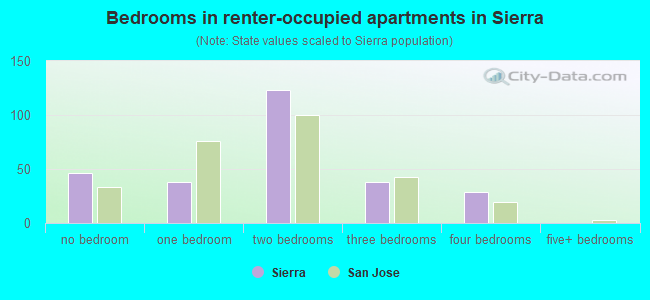
- Bedrooms in renter-occupied apartments in Sierra
- 46no bedroom
- 381 bedroom
- 1232 bedrooms
- 383 bedrooms
- 294 bedrooms
- 05+ bedrooms
Average number of cars or other vehicles available in houses/condos:
Average number of cars or other vehicles available in apartments:
| This neighborhood: | 3.3 |
| San Jose: | 2.3 |
Average number of cars or other vehicles available in apartments:
| Here: | 2.2 |
| city: | 1.6 |
Percentage of units with a mortgage:
| Sierra: | 64.0% |
| San Jose: | 66.9% |
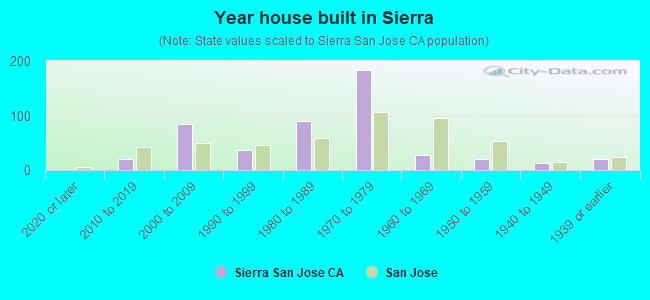
- Year house built in Sierra
- 02020 or later
- 212010 to 2019
- 852000 to 2009
- 371990 to 1999
- 891980 to 1989
- 1841970 to 1979
- 281960 to 1969
- 201950 to 1959
- 121940 to 1949
- 201939 or earlier
City-data.com crime index for city in 2020 (higher means more crime):
| City: | 268.4 |
| U.S. average: | 219.5 |
Travel time to work (commute)
![Travel time to work (commute)]()
- 42Less than 5 minutes
- 215 to 9 minutes
- 9610 to 14 minutes
- 12415 to 19 minutes
- 23920 to 24 minutes
- 4425 to 29 minutes
- 10930 to 34 minutes
- 1135 to 39 minutes
- 4140 to 44 minutes
- 2945 to 59 minutes
- 4960 to 89 minutes
- 1390 or more minutes

Means of transportation to work
![Means of transportation to work]()
- 59.4%444Drove a car alone
- 31.0%232Carpooled
- 1.3%10Bus
- 1.7%13Long-distance train or commuter rail
- 2.1%16Other means
- 7.9%59Worked at home

Time leaving home to go to work
![Time leaving home to go to work]()
- 10412:00 a.m. to 4:59 a.m.
- 615:00 a.m. to 5:29 a.m.
- 315:30 a.m. to 5:59 a.m.
- 1036:00 a.m. to 6:29 a.m.
- 566:30 a.m. to 6:59 a.m.
- 487:00 a.m. to 7:29 a.m.
- 1007:30 a.m. to 7:59 a.m.
- 1358:00 a.m. to 8:29 a.m.
- 328:30 a.m. to 8:59 a.m.
- 769:00 a.m. to 9:59 a.m.
- 510:00 a.m. to 10:59 a.m.
- 811:00 a.m. to 11:59 a.m.
- 6612:00 p.m. to 3:59 p.m.
- 704:00 p.m. to 11:59 p.m.

Occupations of males:
- Percentage of males in management occupations (except farmers):
Here: 2.8% city: 13.0%
- Percentage of males in business and financial operations occupations:
Here: 2.0% city: 4.6%
- Percentage of males in computer and mathematical occupations:
Here: 16.2% city: 13.6%
- Percentage of males in architecture and engineering occupations:
Here: 9.2% city: 10.2%
- Percentage of males in education, training, and library occupations:
Here: 2.0% city: 2.8%
- Percentage of males in service occupations:
Here: 10.6% city: 12.7%
- Percentage of males in sales and office occupations:
Here: 19.3% city: 12.8%
- Percentage of males in construction, extraction, and maintenance occupations:
Here: 22.3% city: 7.8%
- Percentage of males in production occupations:
Here: 8.5% city: 5.5%
- Percentage of males in transportation occupations:
Here: 3.5% city: 3.6%
- Percentage of males in material moving occupations:
Here: 5.6% city: 3.1%
Occupations of females:
- Percentage of females in business and financial operations occupations:
Here: 7.8% city: 8.6%
- Percentage of females in computer and mathematical occupations:
Here: 1.1% city: 5.4%
- Percentage of females in architecture and engineering occupations:
Here: 9.2% city: 2.8%
- Percentage of females in education, training, and library occupations:
Here: 6.8% city: 8.1%
- Percentage of females in service occupations:
Here: 36.7% city: 21.7%
- Percentage of females in sales and office occupations:
Here: 16.4% city: 22.0%
- Percentage of females in construction, extraction, and maintenance occupations:
Here: 1.8% city: 0.2%
- Percentage of females in production occupations:
Here: 15.0% city: 4.0%
- Percentage of females in transportation occupations:
Here: 4.5% city: 0.7%
- Percentage of females in material moving occupations:
Here: 3.7% city: 1.5%
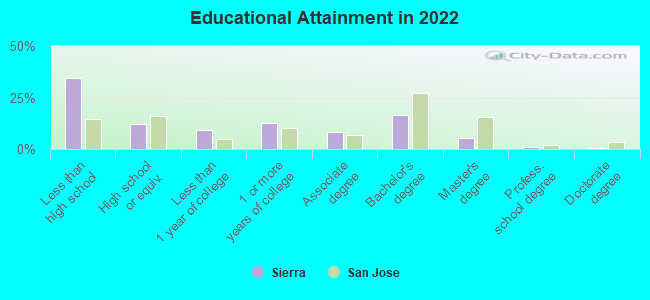
Education in this neighborhood (subdivision or community):
- Percentage of people 3 years and older in K-12 schools:
Sierra: 12.2% San Jose: 16.1%
- Percentage of people 3 years and older in undergraduate colleges:
Sierra: 13.3% San Jose: 6.5%
- Percentage of people 3 years and older in grad. or professional schools:
Sierra: 1.7% San Jose: 2.0%
- Percentage of students K-12 enrolled in private schools:
Sierra: 3.0% San Jose: 14.9%
Percentage of population below poverty level:
| Sierra: | 9.6% |
| San Jose: | 9.0% |
Median year owner moved in (as recorded in 2022):
Median year renter moved in (as recorded in 2022):
| Sierra: | 2002 |
| San Jose: | 2008 |
Median year renter moved in (as recorded in 2022):
| Sierra: | 2012 |
| San Jose: | 2020 |
Percentage of married-couple families with both working:
| Sierra: | 32.0% |
| San Jose: | 72.5% |
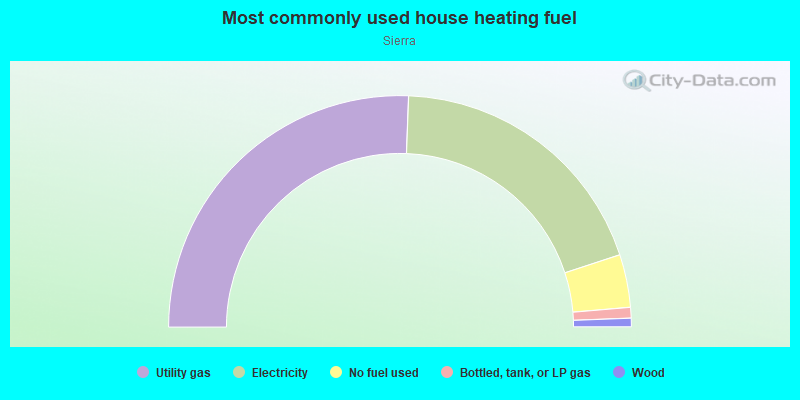
- 51.2%Utility gas
- 38.7%Electricity
- 7.4%No fuel used
- 1.5%Bottled, tank, or LP gas
- 1.2%Wood
Roads and streets:
Sierra Vista Pl
Length: 0.22 miles
Directions: N-S, SE-NW
Address range: 1 to 199
Directions: N-S, SE-NW
Address range: 1 to 199
S Capitol Ave
Length: 0.22 miles
Direction: SE-NW
Address range: 182 to 435
Direction: SE-NW
Address range: 182 to 435
Muirfield Dr
Length: 0.20 miles
Directions: E-W, SE-NW
Address range: 200 to 299
Directions: E-W, SE-NW
Address range: 200 to 299
Sierra Grande Way
Length: 0.17 miles
Direction: SW-NE
Address range: 2500 to 2698
Direction: SW-NE
Address range: 2500 to 2698
Sierra Monte Way
Length: 0.12 miles
Directions: N-S, SW-NE
Address range: 2500 to 2599
Directions: N-S, SW-NE
Address range: 2500 to 2599
Sierra Meadow Dr
Length: 0.11 miles
Directions: E-W, SE-NW
Directions: E-W, SE-NW
Declaration Dr
Length: 0.11 miles
Direction: SW-NE
Address range: 2501 to 2699
Direction: SW-NE
Address range: 2501 to 2699
Sierra Vista Ct
Length: 0.09 miles
Directions: N-S, SE-NW, SW-NE
Address range: 2500 to 2699
Directions: N-S, SE-NW, SW-NE
Address range: 2500 to 2699
Sierra Serena Ct
Length: 0.08 miles
Directions: E-W, SW-NE
Address range: 2500 to 2599
Directions: E-W, SW-NE
Address range: 2500 to 2599
Vis del Sol
Length: 0.08 miles
Direction: SW-NE
Address range: 2500 to 2699
Direction: SW-NE
Address range: 2500 to 2699
Sierra Meadow Ct
Length: 0.08 miles
Direction: SW-NE
Address range: 2500 to 2599
Direction: SW-NE
Address range: 2500 to 2599
Republic Ave
Length: 0.07 miles
Direction: SE-NW
Address range: 101 to 199
Direction: SE-NW
Address range: 101 to 199
Lendrum Ave
Length: 0.06 miles
Direction: SW-NE
Address range: 2300 to 2399
Direction: SW-NE
Address range: 2300 to 2399
Sierra Grande Ct
Length: 0.04 miles
Direction: SE-NW
Address range: 1 to 99
Direction: SE-NW
Address range: 1 to 99
Declaration Way
Length: 0.03 miles
Direction: SE-NW
Address range: 100 to 199
Direction: SE-NW
Address range: 100 to 199
Republic Ct
Length: 0.02 miles
Direction: SW-NE
Address range: 2500 to 2699
Direction: SW-NE
Address range: 2500 to 2699
Republic Pl
Length: 0.02 miles
Direction: SW-NE
Address range: 2500 to 2698
Direction: SW-NE
Address range: 2500 to 2698
Declaration Ct
Length: 0.02 miles
Direction: SE-NW
Address range: 100 to 199
Direction: SE-NW
Address range: 100 to 199