Sherwood Park neighborhood in Fort Meade, Florida (FL), 33841 detailed profile
Settings
X


Business Search - 14 Million verified businesses
Area: 0.113 square miles
Population: 260
Population density:
| Sherwood Park: | 2,297 people per square mile |
| Fort Meade: | 1,032 people per square mile |

- 9336.0%Hispanic or Latino
- 8633.3%White
- 7830.2%Black
- 10.4%Some other race

Median household income in 2022:
| Sherwood Park: | $43,250 |
| Fort Meade: | $34,474 |
Distribution of median household income
![Distribution of median household income]()
- 7Less than $10,000
- 18$10,000 to $19,999
- 15$20,000 to $29,999
- 9$30,000 to $39,999
- 6$40,000 to $49,999
- 1$50,000 to $59,999
- 6$60,000 to $74,999
- 9$75,000 to $99,999
- 14$100,000 to $124,999
- 10$125,000 to $149,999
- 10$150,000 to $199,999

Distribution of owner-occupied house/condo value
![Distribution of owner-occupied house/condo value]()
- 14Less than $50,000
- 20$50,000 to $99,999
- 14$100,000 to $149,999
- 2$150,000 to $199,999
- 21$200,000 to $249,999
- 4$250,000 to $299,999
- 8$300,000 to $399,999
- 1$400,000 to $499,999
- 4$500,000 to $749,999

Distribution of rent paid by renters
![Distribution of rent paid by renters]()
- 1$100 to $199
- 2$200 to $299
- 2$500 to $599
- 6$600 to $699
- 2$1,000 to $1,249
- 2$1,250 to $1,499

Median rent in 2022:
| Sherwood Park: | $674 |
| Fort Meade: | $670 |
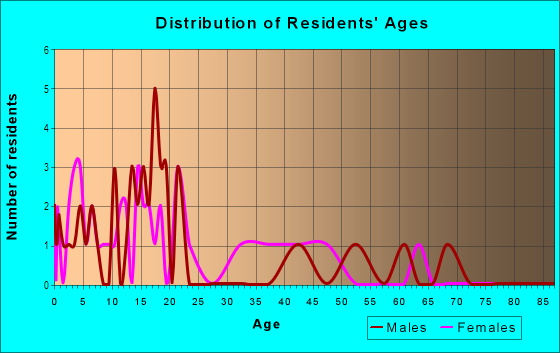
| Males: | 139 |
| Females: | 121 |
Males:
| This neighborhood: | 39.1 years |
| Whole city: | 43.4 years |
| This neighborhood: | 53.2 years |
| Whole city: | 51.9 years |
Average household size:
| Sherwood Park: | 2.6 people |
| Fort Meade: | 2.3 people |
Percentage of family households:
| Sherwood Park: | 31.3% |
| Fort Meade: | 24.7% |
| Here: | 52.2% |
| Fort Meade: | 38.9% |
Percentage of married-couple families with children (among all households):
| Sherwood Park: | 36.2% |
| Fort Meade: | 34.9% |
Percentage of single-mother households (among all households):
| Sherwood Park: | 0.0% |
| Fort Meade: | 7.5% |
Percentage of never married males 15 years old and over:
Percentage of never married females 15 years old and over:
| Sherwood Park: | 17.3% |
| Fort Meade: | 14.9% |
Percentage of never married females 15 years old and over:
| Sherwood Park: | 10.7% |
| city: | 12.3% |
Percentage of people that speak English not well or not at all:
| Sherwood Park: | 3.1% |
| Fort Meade: | 1.8% |
Percentage of people born in this state:
Percentage of people born in another U.S. state:
Percentage of native residents but born outside the U.S.:
Percentage of foreign born residents:
| Here: | 56.7% |
| Fort Meade: | 58.0% |
Percentage of people born in another U.S. state:
| Sherwood Park: | 30.0% |
| Fort Meade: | 35.8% |
Percentage of native residents but born outside the U.S.:
| Here: | 2.1% |
| city: | 1.3% |
Percentage of foreign born residents:
| Here: | 11.2% |
| Fort Meade: | 4.9% |

Owner-occupied
Renter-occupied


- Rooms in owner-occupied houses and condos in Sherwood Park
- 01 room
- 02 rooms
- 03 rooms
- 24 rooms
- 205 rooms
- 326 rooms
- 77 rooms
- 68 rooms
- 149+ rooms

- Rooms in renter-occupied apartments in Sherwood Park
- 01 room
- 02 rooms
- 03 rooms
- 34 rooms
- 95 rooms
- 26 rooms
- 07 rooms
- 08 rooms
- 09+ rooms
Owner-occupied
Renter-occupied

- Bedrooms in owner-occupied houses and condos in Sherwood Park
- 0no bedroom
- 01 bedroom
- 72 bedrooms
- 643 bedrooms
- 114 bedrooms
- 05+ bedrooms

- Bedrooms in renter-occupied apartments in Sherwood Park
- 0no bedroom
- 01 bedroom
- 92 bedrooms
- 63 bedrooms
- 04 bedrooms
- 05+ bedrooms
Average number of cars or other vehicles available in houses/condos:
Average number of cars or other vehicles available in apartments:
| This neighborhood: | 2.3 |
| Fort Meade: | 1.8 |
Average number of cars or other vehicles available in apartments:
| Here: | 0.8 |
| city: | 1.1 |
Percentage of units with a mortgage:
| Sherwood Park: | 42.3% |
| Fort Meade: | 36.1% |
Average estimated value of detached houses in 2022 (95.6% of all units):
| Sherwood Park: | $156,412 |
| Florida: | $500,941 |

- Year house built in Sherwood Park
- 02020 or later
- 22010 to 2019
- 162000 to 2009
- 171990 to 1999
- 71980 to 1989
- 101970 to 1979
- 101960 to 1969
- 91950 to 1959
- 111940 to 1949
- 271939 or earlier

Travel time to work (commute)
![Travel time to work (commute)]()
- 2Less than 5 minutes
- 155 to 9 minutes
- 510 to 14 minutes
- 1315 to 19 minutes
- 1020 to 24 minutes
- 525 to 29 minutes
- 830 to 34 minutes
- 1335 to 39 minutes
- 440 to 44 minutes
- 745 to 59 minutes
- 160 to 89 minutes
- 1390 or more minutes

Means of transportation to work
![Means of transportation to work]()
- 83.4%91Drove a car alone
- 7.3%8Carpooled
- 0.9%1Bicycle
- 0.9%1Walked
- 4.6%5Worked at home

Time leaving home to go to work
![Time leaving home to go to work]()
- 55:00 a.m. to 5:29 a.m.
- 105:30 a.m. to 5:59 a.m.
- 186:00 a.m. to 6:29 a.m.
- 96:30 a.m. to 6:59 a.m.
- 207:00 a.m. to 7:29 a.m.
- 77:30 a.m. to 7:59 a.m.
- 118:00 a.m. to 8:29 a.m.
- 119:00 a.m. to 9:59 a.m.
- 210:00 a.m. to 10:59 a.m.
- 112:00 p.m. to 3:59 p.m.
- 34:00 p.m. to 11:59 p.m.

Occupations of males:
- Percentage of males in management occupations (except farmers):
Here: 16.8% city: 9.8%
- Percentage of males in healthcare practitioners and technical occupations:
Here: 7.4% city: 3.3%
- Percentage of males in service occupations:
Here: 17.7% city: 17.0%
- Percentage of males in sales and office occupations:
Here: 5.3% city: 8.0%
- Percentage of males in construction, extraction, and maintenance occupations:
Here: 25.3% city: 18.0%
- Percentage of males in production occupations:
Here: 10.8% city: 6.9%
- Percentage of males in transportation occupations:
Here: 11.1% city: 10.1%
- Percentage of males in material moving occupations:
Here: 2.8% city: 8.5%
Occupations of females:
- Percentage of females in management occupations (except farmers):
Here: 7.0% city: 5.0%
- Percentage of females in business and financial operations occupations:
Here: 5.2% city: 3.6%
- Percentage of females in community and social services occupations:
Here: 3.5% city: 2.7%
- Percentage of females in healthcare practitioners and technical occupations:
Here: 4.5% city: 3.9%
- Percentage of females in service occupations:
Here: 21.3% city: 29.6%
- Percentage of females in sales and office occupations:
Here: 53.5% city: 37.8%
- Percentage of females in material moving occupations:
Here: 4.9% city: 2.9%
Education in this neighborhood (subdivision or community):
- Percentage of people 3 years and older in K-12 schools:
Sherwood Park: 15.2% Fort Meade: 15.2%
- Percentage of people 3 years and older in undergraduate colleges:
Sherwood Park: 4.7% Fort Meade: 3.2%
- Percentage of people 3 years and older in grad. or professional schools:
Sherwood Park: 0.0% Fort Meade: 0.3%
- Percentage of students K-12 enrolled in private schools:
Sherwood Park: 17.9% Fort Meade: 17.2%
Percentage of population below poverty level:
| Sherwood Park: | 10.4% |
| Fort Meade: | 23.0% |
Median year owner moved in (as recorded in 2022):
Median year renter moved in (as recorded in 2022):
| Sherwood Park: | 1997 |
| Fort Meade: | 2001 |
Median year renter moved in (as recorded in 2022):
| Sherwood Park: | 2017 |
| Fort Meade: | 2018 |
Percentage of married-couple families with both working:
| Sherwood Park: | 100.0% |
| Fort Meade: | 65.3% |

- 98.4%Electricity
- 1.6%Utility gas
Roads and streets:
2nd St SE
Length: 0.38 miles
Direction: E-W
Address range: 100 to 499
Direction: E-W
Address range: 100 to 499
1st St SE
Length: 0.38 miles
Direction: E-W
Address range: 100 to 499
Direction: E-W
Address range: 100 to 499
3rd St SE
Length: 0.33 miles
Direction: E-W
Address range: 100 to 499
Direction: E-W
Address range: 100 to 499
S Perry Ave
Length: 0.23 miles
Direction: N-S
Address range: 15 to 299
Direction: N-S
Address range: 15 to 299
S Pine Ave
Length: 0.23 miles
Direction: N-S
Address range: 56 to 320
Direction: N-S
Address range: 56 to 320
S Lanier Ave
Length: 0.23 miles
Direction: N-S
Address range: 100 to 299
Direction: N-S
Address range: 100 to 299
S Cleveland St
Length: 0.23 miles
Direction: N-S
Address range: 15 to 299
Direction: N-S
Address range: 15 to 299
S Oak Ave
Length: 0.23 miles
Direction: N-S
Address range: 44 to 299
Direction: N-S
Address range: 44 to 299
Magnolia St SE
Length: 0.09 miles
Direction: E-W
Address range: 100 to 199
Direction: E-W
Address range: 100 to 199
Lime St SE
Length: 0.09 miles
Direction: E-W
Address range: 400 to 499
Direction: E-W
Address range: 400 to 499