Rogers neighborhood in San Jose, California (CA), 95129 detailed profile
Settings
X

Business Search - 14 Million verified businesses
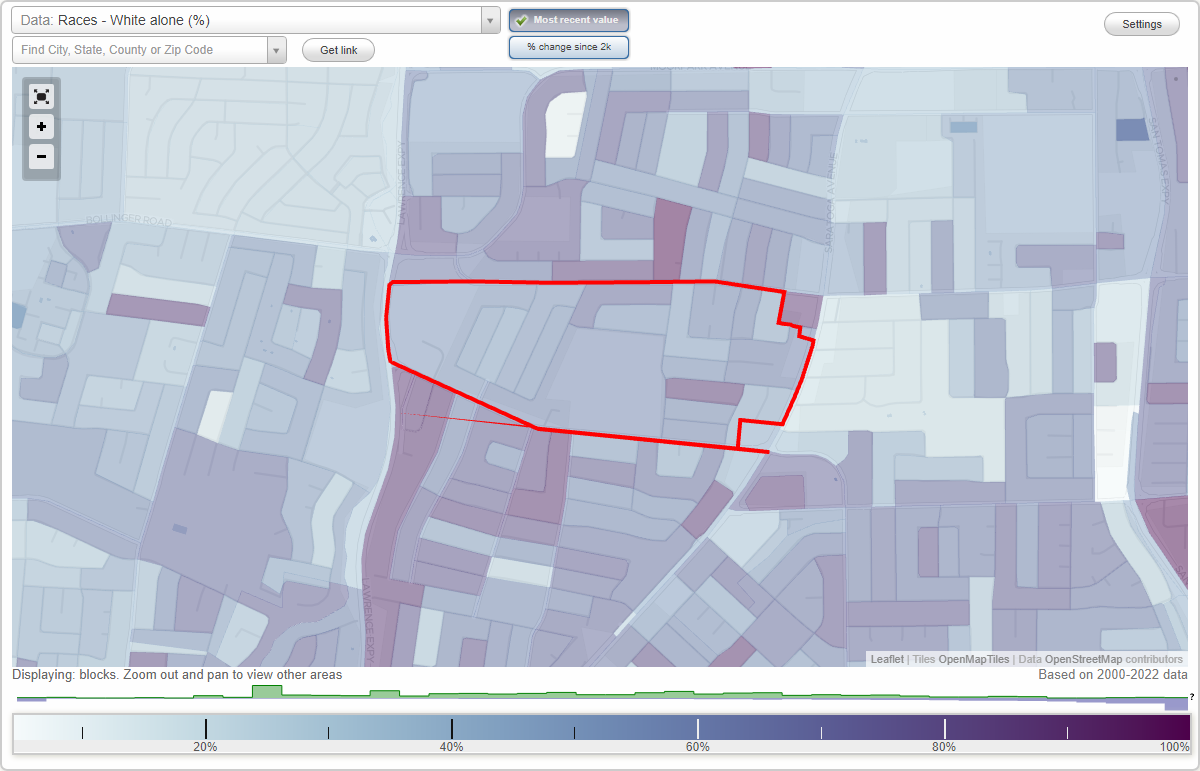
Area: 0.311 square miles
Population: 2,009
Population density:
| Rogers: | 6,462 people per square mile |
| San Jose: | 5,554 people per square mile |

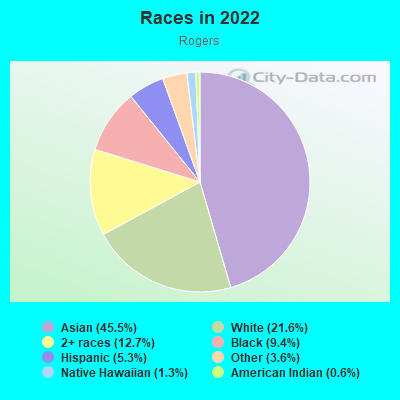
- 1,07245.5%Asian
- 50921.6%White
- 30012.7%Two or more races
- 2219.4%Black
- 1265.3%Hispanic or Latino
- 843.6%Some other race
- 301.3%Native Hawaiian and Other
Pacific Islander - 150.6%American Indian
Median household income in 2022:
| Rogers: | $141,826 |
| San Jose: | $133,835 |
Distribution of median household income
![Distribution of median household income]()
- 20Less than $10,000
- 104$10,000 to $19,999
- 35$20,000 to $29,999
- 74$30,000 to $39,999
- 28$40,000 to $49,999
- 39$50,000 to $59,999
- 12$60,000 to $74,999
- 18$75,000 to $99,999
- 168$100,000 to $124,999
- 28$125,000 to $149,999
- 114$150,000 to $199,999
- 298$200,000 or more

Distribution of owner-occupied house/condo value
![Distribution of owner-occupied house/condo value]()
- 27Less than $50,000
- 15$100,000 to $149,999
- 14$150,000 to $199,999
- 24$200,000 to $249,999
- 17$500,000 to $749,999
- 20$750,000 to $999,999
- 468$1,000,000 or more

Distribution of rent paid by renters
![Distribution of rent paid by renters]()
- 39$200 to $299
- 41$400 to $499
- 84$1,000 to $1,249
- 63$1,250 to $1,499
- 18$1,500 to $1,999
- 344$2,000 or more

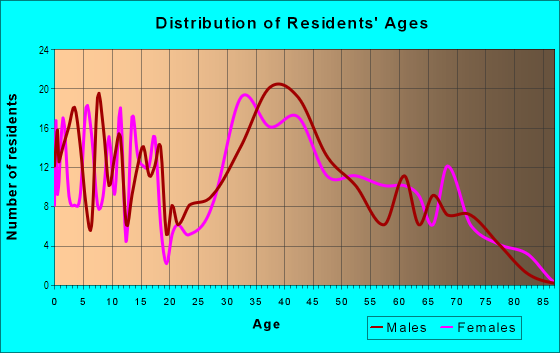
| Males: | 1,160 |
| Females: | 849 |
Males:
| This neighborhood: | 44.5 years |
| Whole city: | 37.6 years |
| This neighborhood: | 46.6 years |
| Whole city: | 39.1 years |
Average household size:
| Rogers: | 2.8 people |
| San Jose: | 2.9 people |
Percentage of family households:
| Rogers: | 44.7% |
| San Jose: | 49.9% |
| Here: | 54.7% |
| San Jose: | 53.0% |
Percentage of married-couple families with children (among all households):
| Rogers: | 36.4% |
| San Jose: | 25.8% |
Percentage of single-mother households (among all households):
| Rogers: | 2.7% |
| San Jose: | 5.2% |
Percentage of never married males 15 years old and over:
Percentage of never married females 15 years old and over:
| Rogers: | 8.1% |
| San Jose: | 20.9% |
Percentage of never married females 15 years old and over:
| Rogers: | 6.8% |
| city: | 16.7% |
Percentage of people that speak English not well or not at all:
| Rogers: | 10.7% |
| San Jose: | 11.4% |
Percentage of people born in this state:
Percentage of people born in another U.S. state:
Percentage of native residents but born outside the U.S.:
Percentage of foreign born residents:
| Here: | 34.8% |
| San Jose: | 46.1% |
Percentage of people born in another U.S. state:
| Rogers: | 15.3% |
| San Jose: | 10.4% |
Percentage of native residents but born outside the U.S.:
| Here: | 1.1% |
| city: | 1.7% |
Percentage of foreign born residents:
| Here: | 48.8% |
| San Jose: | 41.8% |
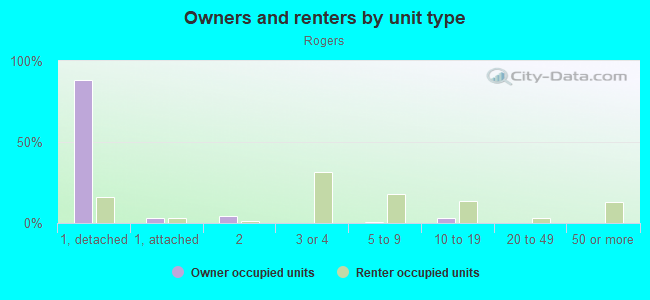
Owner-occupied
Renter-occupied

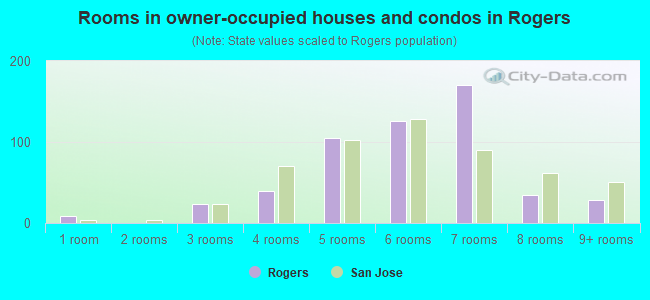
- Rooms in owner-occupied houses and condos in Rogers
- 91 room
- 02 rooms
- 243 rooms
- 404 rooms
- 1055 rooms
- 1266 rooms
- 1707 rooms
- 358 rooms
- 289+ rooms
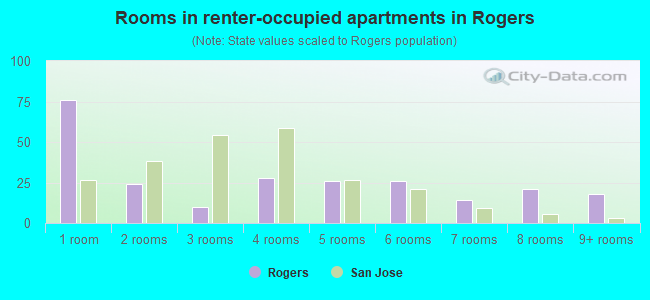
- Rooms in renter-occupied apartments in Rogers
- 761 room
- 242 rooms
- 103 rooms
- 284 rooms
- 265 rooms
- 266 rooms
- 147 rooms
- 218 rooms
- 189+ rooms
Owner-occupied
Renter-occupied
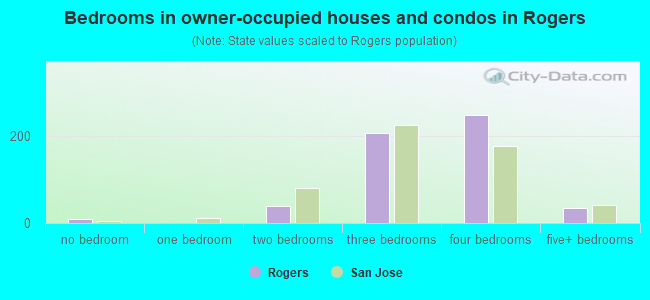
- Bedrooms in owner-occupied houses and condos in Rogers
- 9no bedroom
- 01 bedroom
- 402 bedrooms
- 2063 bedrooms
- 2474 bedrooms
- 355+ bedrooms
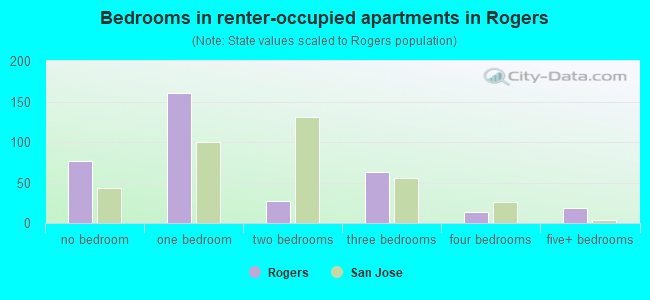
- Bedrooms in renter-occupied apartments in Rogers
- 76no bedroom
- 1611 bedroom
- 272 bedrooms
- 633 bedrooms
- 144 bedrooms
- 185+ bedrooms
Average number of cars or other vehicles available in houses/condos:
Average number of cars or other vehicles available in apartments:
| This neighborhood: | 2.0 |
| San Jose: | 2.3 |
Average number of cars or other vehicles available in apartments:
| Here: | 1.7 |
| city: | 1.6 |
Percentage of units with a mortgage:
| Rogers: | 60.1% |
| San Jose: | 66.9% |
Average estimated value of detached houses in 2022 (79.2% of all units):
| Rogers: | $1,883,091 |
| San Jose: | $1,532,815 |
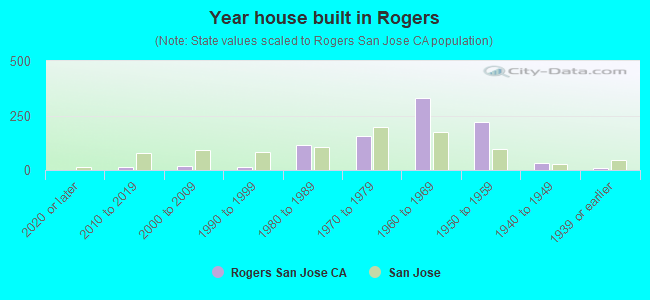
- Year house built in Rogers
- 02020 or later
- 162010 to 2019
- 172000 to 2009
- 131990 to 1999
- 1151980 to 1989
- 1571970 to 1979
- 3281960 to 1969
- 2211950 to 1959
- 311940 to 1949
- 91939 or earlier
City-data.com crime index for city in 2020 (higher means more crime):
| City: | 268.4 |
| U.S. average: | 219.5 |
Travel time to work (commute)
![Travel time to work (commute)]()
- 53Less than 5 minutes
- 255 to 9 minutes
- 9510 to 14 minutes
- 14415 to 19 minutes
- 21420 to 24 minutes
- 5825 to 29 minutes
- 15530 to 34 minutes
- 1835 to 39 minutes
- 3840 to 44 minutes
- 4745 to 59 minutes
- 1060 to 89 minutes
- 6790 or more minutes

Means of transportation to work
![Means of transportation to work]()
- 66.4%592Drove a car alone
- 1.7%15Carpooled
- 1.1%10Bus
- 1.8%16Subway or elevated rail
- 7.1%63Long-distance train or commuter rail
- 1.8%16Motorcycle
- 0.4%4Bicycle
- 1.0%9Walked
- 19.2%171Other means
- 21.6%193Worked at home

Time leaving home to go to work
![Time leaving home to go to work]()
- 3612:00 a.m. to 4:59 a.m.
- 85:00 a.m. to 5:29 a.m.
- 225:30 a.m. to 5:59 a.m.
- 126:00 a.m. to 6:29 a.m.
- 436:30 a.m. to 6:59 a.m.
- 1377:00 a.m. to 7:29 a.m.
- 737:30 a.m. to 7:59 a.m.
- 1138:00 a.m. to 8:29 a.m.
- 1298:30 a.m. to 8:59 a.m.
- 1519:00 a.m. to 9:59 a.m.
- 9810:00 a.m. to 10:59 a.m.
- 1711:00 a.m. to 11:59 a.m.
- 4212:00 p.m. to 3:59 p.m.
- 264:00 p.m. to 11:59 p.m.

Occupations of males:
- Percentage of males in management occupations (except farmers):
Here: 11.8% city: 13.0%
- Percentage of males in business and financial operations occupations:
Here: 3.4% city: 4.6%
- Percentage of males in computer and mathematical occupations:
Here: 17.3% city: 13.6%
- Percentage of males in architecture and engineering occupations:
Here: 25.4% city: 10.2%
- Percentage of males in education, training, and library occupations:
Here: 6.5% city: 2.8%
- Percentage of males in arts, design, entertainment, sports, and media occupations:
Here: 15.2% city: 1.8%
- Percentage of males in sales and office occupations:
Here: 12.9% city: 12.8%
- Percentage of males in production occupations:
Here: 7.2% city: 5.5%
Occupations of females:
- Percentage of females in management occupations (except farmers):
Here: 22.0% city: 11.0%
- Percentage of females in business and financial operations occupations:
Here: 19.6% city: 8.6%
- Percentage of females in architecture and engineering occupations:
Here: 3.3% city: 2.8%
- Percentage of females in life, physical, and social science occupations:
Here: 2.8% city: 1.7%
- Percentage of females in education, training, and library occupations:
Here: 18.0% city: 8.1%
- Percentage of females in arts, design, entertainment, sports, and media occupations:
Here: 6.7% city: 2.0%
- Percentage of females in healthcare practitioners and technical occupations:
Here: 7.4% city: 6.8%
- Percentage of females in service occupations:
Here: 10.7% city: 21.7%
- Percentage of females in sales and office occupations:
Here: 9.4% city: 22.0%
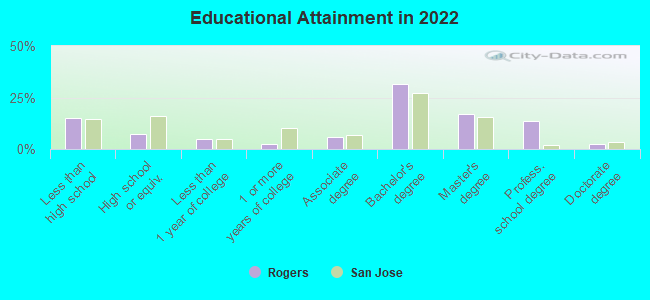
Education in this neighborhood (subdivision or community):
- Percentage of people 3 years and older in K-12 schools:
Rogers: 25.6% San Jose: 16.1%
- Percentage of people 3 years and older in undergraduate colleges:
Rogers: 2.5% San Jose: 6.5%
- Percentage of people 3 years and older in grad. or professional schools:
Rogers: 1.7% San Jose: 2.0%
- Percentage of students K-12 enrolled in private schools:
Rogers: 41.2% San Jose: 14.9%
Percentage of population below poverty level:
| Rogers: | 1.5% |
| San Jose: | 9.0% |
Median year owner moved in (as recorded in 2022):
| Rogers: | 1995 |
| San Jose: | 2008 |
Percentage of married-couple families with both working:
| Rogers: | 82.5% |
| San Jose: | 72.5% |
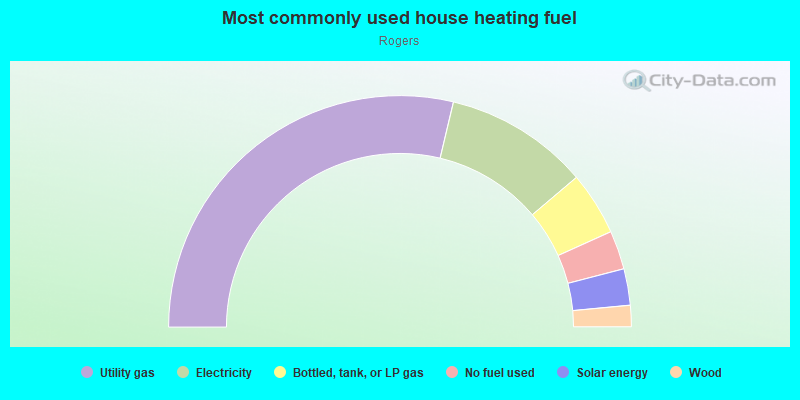
- 57.5%Utility gas
- 20.2%Electricity
- 8.9%Bottled, tank, or LP gas
- 5.4%No fuel used
- 5.1%Solar energy
- 3.0%Wood
Roads and streets:
Doyle Rd
Length: 0.54 miles
Direction: E-W
Address range: 4530 to 4962
Direction: E-W
Address range: 4530 to 4962
Venice Way
Length: 0.39 miles
Direction: E-W
Address range: 4300 to 4699
Direction: E-W
Address range: 4300 to 4699
Marilla Ave
Length: 0.33 miles
Directions: N-S, SE-NW, SW-NE
Address range: 1040 to 1199
Directions: N-S, SE-NW, SW-NE
Address range: 1040 to 1199
Piper Dr
Length: 0.33 miles
Direction: E-W
Address range: 4400 to 4699
Direction: E-W
Address range: 4400 to 4699
Beaumont Dr
Length: 0.30 miles
Directions: E-W, SW-NE
Address range: 1000 to 1199
Directions: E-W, SW-NE
Address range: 1000 to 1199
Blanco Dr
Length: 0.30 miles
Directions: E-W, N-S, SW-NE
Address range: 4600 to 4799
Directions: E-W, N-S, SW-NE
Address range: 4600 to 4799
Wilmington Ave
Length: 0.30 miles
Directions: E-W, N-S, SW-NE
Address range: 1000 to 1199
Directions: E-W, N-S, SW-NE
Address range: 1000 to 1199
Eastus Dr
Length: 0.29 miles
Direction: E-W
Address range: 4600 to 4799
Direction: E-W
Address range: 4600 to 4799
Happy Valley Ave
Length: 0.27 miles
Directions: N-S, SW-NE
Address range: 1000 to 1126
Directions: N-S, SW-NE
Address range: 1000 to 1126
del Cambre Dr
Length: 0.25 miles
Direction: SW-NE
Address range: 1050 to 1199
Direction: SW-NE
Address range: 1050 to 1199
Parkfield Ave
Length: 0.24 miles
Directions: E-W, SE-NW
Address range: 5000 to 5199
Directions: E-W, SE-NW
Address range: 5000 to 5199
Catalina Dr
Length: 0.21 miles
Direction: E-W
Address range: 4500 to 4699
Direction: E-W
Address range: 4500 to 4699
Corona Dr
Length: 0.19 miles
Direction: E-W
Address range: 4500 to 4699
Direction: E-W
Address range: 4500 to 4699
Moran Dr
Length: 0.19 miles
Directions: E-W, SE-NW
Address range: 4436 to 4642
Directions: E-W, SE-NW
Address range: 4436 to 4642
Kelly Dr
Length: 0.19 miles
Direction: SW-NE
Address range: 1000 to 1199
Direction: SW-NE
Address range: 1000 to 1199
Malibu Dr
Length: 0.16 miles
Directions: N-S, SW-NE
Address range: 1100 to 1199
Directions: N-S, SW-NE
Address range: 1100 to 1199
Saratoga Ave
Length: 0.14 miles
Directions: N-S, SW-NE
Address range: 1079 to 1135
Directions: N-S, SW-NE
Address range: 1079 to 1135
Leo Dr
Length: 0.10 miles
Direction: N-S
Address range: 1100 to 1199
Direction: N-S
Address range: 1100 to 1199
Osuna Pl
Length: 0.07 miles
Directions: E-W, SW-NE
Address range: 1100 to 1199
Directions: E-W, SW-NE
Address range: 1100 to 1199
Gruwell Pl
Length: 0.03 miles
Direction: N-S
Address range: 1000 to 1101
Direction: N-S
Address range: 1000 to 1101