Rodgers neighborhood in San Jose, California (CA), 95127, 95148 detailed profile
Settings
X

Business Search - 14 Million verified businesses
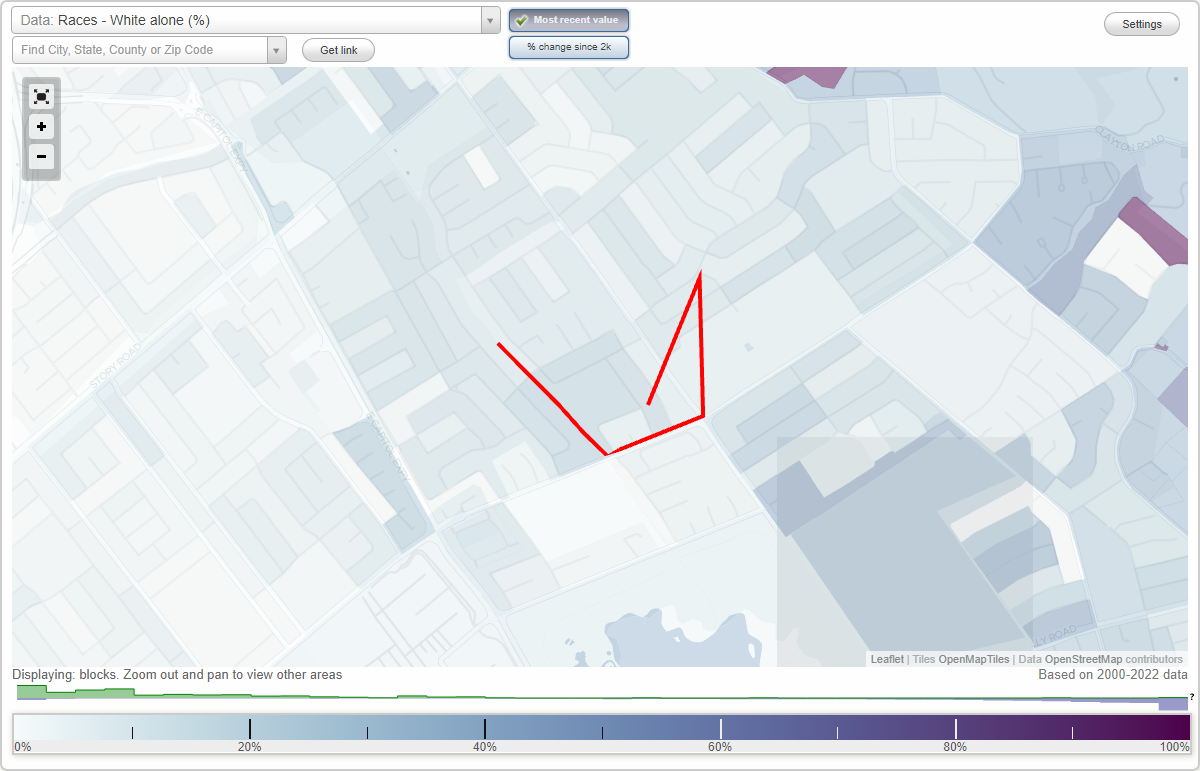
Area: 0.100 square miles
Population: 961
Population density:
| Rodgers: | 9,615 people per square mile |
| San Jose: | 5,554 people per square mile |

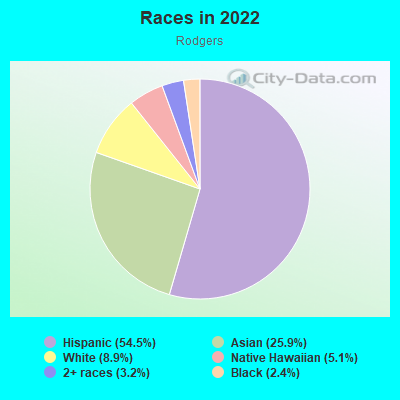
- 55654.5%Hispanic or Latino
- 26425.9%Asian
- 918.9%White
- 525.1%Native Hawaiian and Other
Pacific Islander - 333.2%Two or more races
- 242.4%Black
Median household income in 2022:
| Rodgers: | $123,860 |
| San Jose: | $133,835 |
Distribution of median household income
![Distribution of median household income]()
- 10Less than $10,000
- 14$10,000 to $19,999
- 8$20,000 to $29,999
- 32$30,000 to $39,999
- 19$40,000 to $49,999
- 35$50,000 to $59,999
- 41$60,000 to $74,999
- 30$75,000 to $99,999
- 30$100,000 to $124,999
- 15$125,000 to $149,999
- 37$150,000 to $199,999
- 57$200,000 or more

Distribution of owner-occupied house/condo value
![Distribution of owner-occupied house/condo value]()
- 10Less than $50,000
- 13$50,000 to $99,999
- 3$100,000 to $149,999
- 1$150,000 to $199,999
- 11$200,000 to $249,999
- 7$300,000 to $399,999
- 13$400,000 to $499,999
- 18$500,000 to $749,999
- 96$750,000 to $999,999
- 69$1,000,000 or more

Distribution of rent paid by renters
![Distribution of rent paid by renters]()
- 3$800 to $899
- 15$1,000 to $1,249
- 22$1,250 to $1,499
- 7$1,500 to $1,999
- 84$2,000 or more

Median rent in 2022:
| Rodgers: | $2,641 |
| San Jose: | $2,001 |
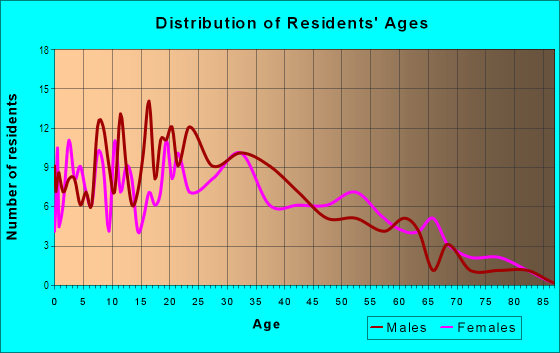
| Males: | 542 |
| Females: | 419 |
Males:
| This neighborhood: | 40.3 years |
| Whole city: | 37.6 years |
| This neighborhood: | 34.0 years |
| Whole city: | 39.1 years |
Average household size:
| Rodgers: | 4.4 people |
| San Jose: | 2.9 people |
Percentage of family households:
| Rodgers: | 56.9% |
| San Jose: | 49.9% |
| Here: | 65.1% |
| San Jose: | 53.0% |
Percentage of married-couple families with children (among all households):
| Rodgers: | 24.1% |
| San Jose: | 25.8% |
Percentage of single-mother households (among all households):
| Rodgers: | 1.8% |
| San Jose: | 5.2% |
Percentage of never married males 15 years old and over:
Percentage of never married females 15 years old and over:
| Rodgers: | 22.9% |
| San Jose: | 20.9% |
Percentage of never married females 15 years old and over:
| Rodgers: | 14.5% |
| city: | 16.7% |
Percentage of people that speak English not well or not at all:
| Rodgers: | 10.6% |
| San Jose: | 11.4% |
Percentage of people born in this state:
Percentage of people born in another U.S. state:
Percentage of native residents but born outside the U.S.:
Percentage of foreign born residents:
| Here: | 46.9% |
| San Jose: | 46.1% |
Percentage of people born in another U.S. state:
| Rodgers: | 5.0% |
| San Jose: | 10.4% |
Percentage of native residents but born outside the U.S.:
| Here: | 3.5% |
| city: | 1.7% |
Percentage of foreign born residents:
| Here: | 44.6% |
| San Jose: | 41.8% |
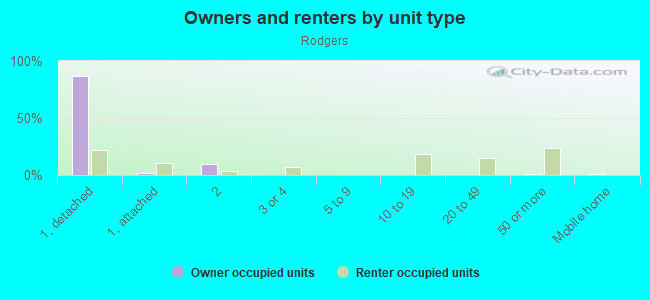
Owner-occupied
Renter-occupied

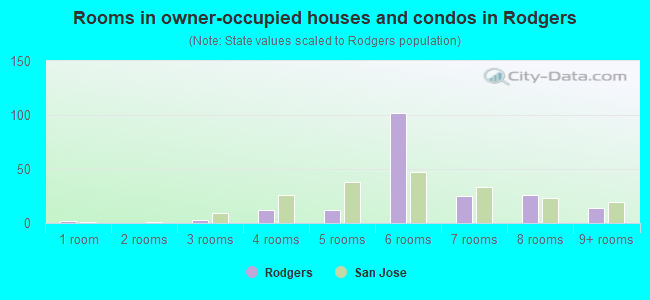
- Rooms in owner-occupied houses and condos in Rodgers
- 21 room
- 02 rooms
- 33 rooms
- 124 rooms
- 125 rooms
- 1026 rooms
- 257 rooms
- 268 rooms
- 149+ rooms
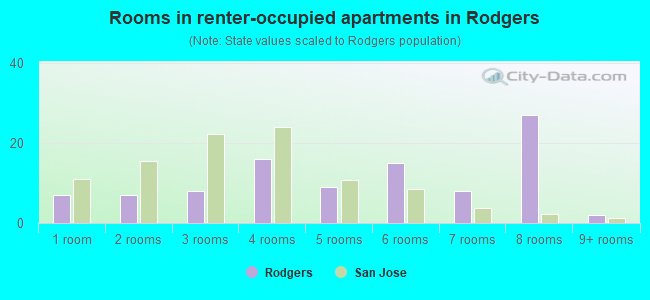
- Rooms in renter-occupied apartments in Rodgers
- 71 room
- 72 rooms
- 83 rooms
- 164 rooms
- 95 rooms
- 156 rooms
- 87 rooms
- 278 rooms
- 29+ rooms
Owner-occupied
Renter-occupied
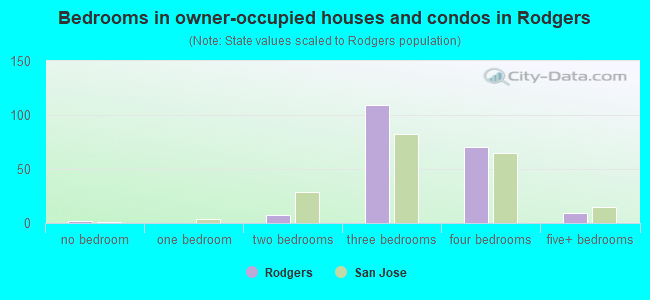
- Bedrooms in owner-occupied houses and condos in Rodgers
- 2no bedroom
- 01 bedroom
- 72 bedrooms
- 1093 bedrooms
- 704 bedrooms
- 95+ bedrooms
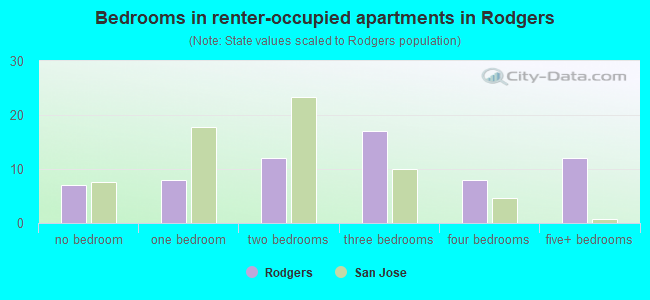
- Bedrooms in renter-occupied apartments in Rodgers
- 7no bedroom
- 81 bedroom
- 122 bedrooms
- 173 bedrooms
- 84 bedrooms
- 125+ bedrooms
Average number of cars or other vehicles available in houses/condos:
Average number of cars or other vehicles available in apartments:
| This neighborhood: | 3.1 |
| San Jose: | 2.3 |
Average number of cars or other vehicles available in apartments:
| Here: | 2.3 |
| city: | 1.6 |
Percentage of units with a mortgage:
| Rodgers: | 65.9% |
| San Jose: | 66.9% |
Average estimated value of detached houses in 2022 (93.9% of all units):
| Rodgers: | $821,976 |
| San Jose: | $1,532,815 |
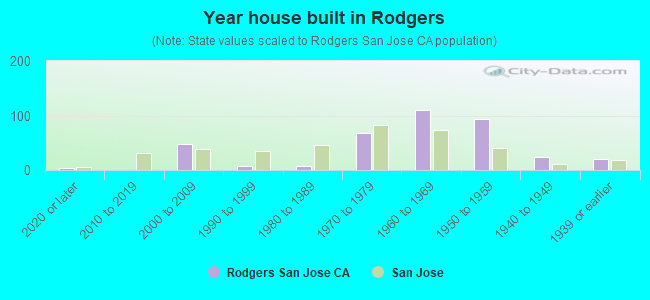
- Year house built in Rodgers
- 42020 or later
- 02010 to 2019
- 482000 to 2009
- 81990 to 1999
- 71980 to 1989
- 681970 to 1979
- 1101960 to 1969
- 931950 to 1959
- 231940 to 1949
- 211939 or earlier
City-data.com crime index for city in 2020 (higher means more crime):
| City: | 268.4 |
| U.S. average: | 219.5 |
Travel time to work (commute)
![Travel time to work (commute)]()
- 2Less than 5 minutes
- 195 to 9 minutes
- 6010 to 14 minutes
- 9315 to 19 minutes
- 7820 to 24 minutes
- 3725 to 29 minutes
- 8030 to 34 minutes
- 2135 to 39 minutes
- 1240 to 44 minutes
- 3845 to 59 minutes
- 4260 to 89 minutes
- 1490 or more minutes

Means of transportation to work
![Means of transportation to work]()
- 74.1%366Drove a car alone
- 14.6%72Carpooled
- 0.8%4Bus
- 1.6%8Long-distance train or commuter rail
- 1.0%5Light rail, streetcar or trolley
- 0.4%2Taxi
- 1.6%8Bicycle
- 1.2%6Walked
- 0.8%4Other means
- 8.3%41Worked at home

Time leaving home to go to work
![Time leaving home to go to work]()
- 1812:00 a.m. to 4:59 a.m.
- 225:00 a.m. to 5:29 a.m.
- 375:30 a.m. to 5:59 a.m.
- 336:00 a.m. to 6:29 a.m.
- 356:30 a.m. to 6:59 a.m.
- 807:00 a.m. to 7:29 a.m.
- 517:30 a.m. to 7:59 a.m.
- 488:00 a.m. to 8:29 a.m.
- 298:30 a.m. to 8:59 a.m.
- 339:00 a.m. to 9:59 a.m.
- 2010:00 a.m. to 10:59 a.m.
- 611:00 a.m. to 11:59 a.m.
- 3612:00 p.m. to 3:59 p.m.
- 464:00 p.m. to 11:59 p.m.

Occupations of males:
- Percentage of males in management occupations (except farmers):
Here: 2.1% city: 13.0%
- Percentage of males in business and financial operations occupations:
Here: 5.5% city: 4.6%
- Percentage of males in architecture and engineering occupations:
Here: 4.8% city: 10.2%
- Percentage of males in education, training, and library occupations:
Here: 6.0% city: 2.8%
- Percentage of males in healthcare practitioners and technical occupations:
Here: 1.6% city: 2.0%
- Percentage of males in service occupations:
Here: 16.4% city: 12.7%
- Percentage of males in sales and office occupations:
Here: 8.4% city: 12.8%
- Percentage of males in farming, fishing, and forestry occupations:
Here: 7.3% city: 0.4%
- Percentage of males in construction, extraction, and maintenance occupations:
Here: 17.0% city: 7.8%
- Percentage of males in production occupations:
Here: 9.1% city: 5.5%
- Percentage of males in transportation occupations:
Here: 6.4% city: 3.6%
- Percentage of males in material moving occupations:
Here: 9.1% city: 3.1%
Occupations of females:
- Percentage of females in management occupations (except farmers):
Here: 17.0% city: 11.0%
- Percentage of females in architecture and engineering occupations:
Here: 3.2% city: 2.8%
- Percentage of females in life, physical, and social science occupations:
Here: 1.4% city: 1.7%
- Percentage of females in education, training, and library occupations:
Here: 5.5% city: 8.1%
- Percentage of females in healthcare practitioners and technical occupations:
Here: 3.3% city: 6.8%
- Percentage of females in service occupations:
Here: 29.2% city: 21.7%
- Percentage of females in sales and office occupations:
Here: 15.9% city: 22.0%
- Percentage of females in farming, fishing, and forestry occupations:
Here: 4.5% city: 0.2%
- Percentage of females in production occupations:
Here: 18.0% city: 4.0%
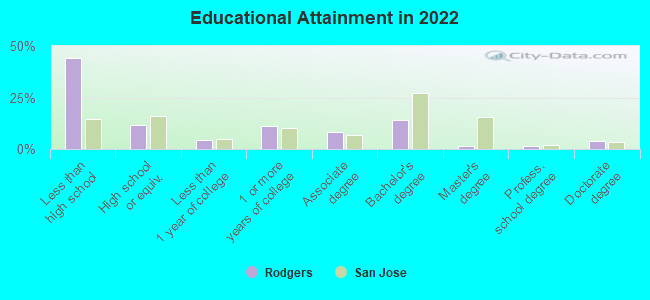
Education in this neighborhood (subdivision or community):
- Percentage of people 3 years and older in K-12 schools:
Rodgers: 14.1% San Jose: 16.1%
- Percentage of people 3 years and older in undergraduate colleges:
Rodgers: 7.9% San Jose: 6.5%
- Percentage of people 3 years and older in grad. or professional schools:
Rodgers: 0.8% San Jose: 2.0%
- Percentage of students K-12 enrolled in private schools:
Rodgers: 72.4% San Jose: 14.9%
Percentage of population below poverty level:
| Rodgers: | 9.1% |
| San Jose: | 9.0% |
Median year owner moved in (as recorded in 2022):
Median year renter moved in (as recorded in 2022):
| Rodgers: | 2004 |
| San Jose: | 2008 |
Median year renter moved in (as recorded in 2022):
| Rodgers: | 2013 |
| San Jose: | 2020 |
Percentage of married-couple families with both working:
| Rodgers: | 44.8% |
| San Jose: | 72.5% |
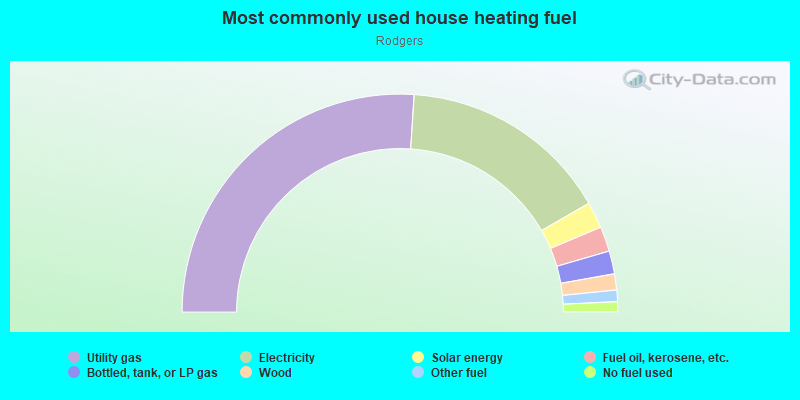
- 52.1%Utility gas
- 31.3%Electricity
- 3.9%Solar energy
- 3.7%Fuel oil, kerosene, etc.
- 3.4%Bottled, tank, or LP gas
- 2.4%Wood
- 1.7%Other fuel
- 1.5%No fuel used
Roads and streets:
Park Ln
Length: 0.34 miles
Directions: E-W, SE-NW, SW-NE
Address range: 2900 to 3099
Directions: E-W, SE-NW, SW-NE
Address range: 2900 to 3099
S White Rd
Length: 0.29 miles
Directions: SE-NW, SW-NE
Address range: 1501 to 1849
Directions: SE-NW, SW-NE
Address range: 1501 to 1849
Moss Point Dr
Length: 0.24 miles
Directions: E-W, SW-NE
Address range: 2900 to 2999
Directions: E-W, SW-NE
Address range: 2900 to 2999
Woodridge Way
Length: 0.16 miles
Direction: SE-NW
Address range: 1600 to 1799
Direction: SE-NW
Address range: 1600 to 1799
Estates Ct
Length: 0.09 miles
Direction: SE-NW
Address range: 1600 to 1699
Direction: SE-NW
Address range: 1600 to 1699
Farringdon Ct
Length: 0.08 miles
Directions: E-W, SE-NW, SW-NE
Address range: 1500 to 1699
Directions: E-W, SE-NW, SW-NE
Address range: 1500 to 1699
Nugget Ct
Length: 0.08 miles
Direction: SE-NW
Address range: 1600 to 1699
Direction: SE-NW
Address range: 1600 to 1699
Farringdon Dr
Length: 0.08 miles
Direction: SE-NW
Address range: 1605 to 1699
Direction: SE-NW
Address range: 1605 to 1699
Parkdale Way
Length: 0.05 miles
Direction: SE-NW
Address range: 1600 to 1649
Direction: SE-NW
Address range: 1600 to 1649