Riverview neighborhood in San Jose, California (CA), 95111 detailed profile
Settings
X

Business Search - 14 Million verified businesses
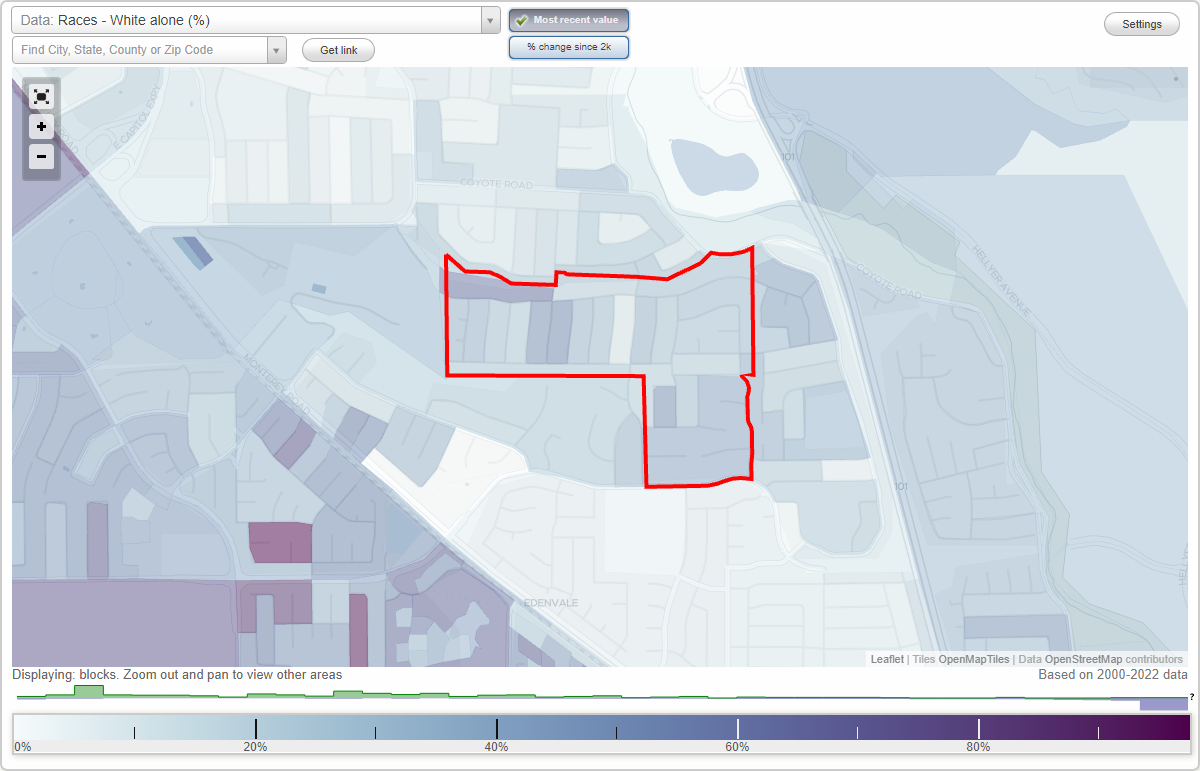
Area: 0.240 square miles
Population: 1,232
Population density:
| Riverview: | 5,131 people per square mile |
| San Jose: | 5,554 people per square mile |

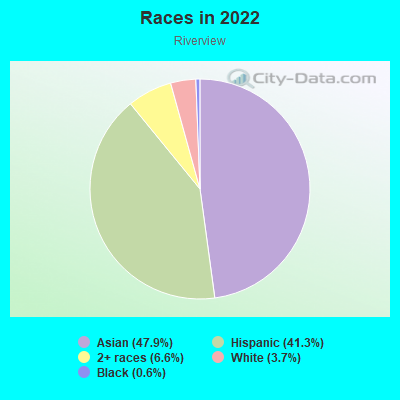
- 58947.9%Asian
- 50841.3%Hispanic or Latino
- 816.6%Two or more races
- 453.7%White
- 70.6%Black
Median household income in 2022:
| Riverview: | $155,625 |
| San Jose: | $133,835 |
Distribution of median household income
![Distribution of median household income]()
- 4Less than $10,000
- 10$10,000 to $19,999
- 23$20,000 to $29,999
- 17$30,000 to $39,999
- 21$40,000 to $49,999
- 4$50,000 to $59,999
- 21$60,000 to $74,999
- 12$75,000 to $99,999
- 14$100,000 to $124,999
- 29$125,000 to $149,999
- 43$150,000 to $199,999
- 117$200,000 or more

Distribution of owner-occupied house/condo value
![Distribution of owner-occupied house/condo value]()
- 4Less than $50,000
- 6$100,000 to $149,999
- 8$300,000 to $399,999
- 23$500,000 to $749,999
- 114$750,000 to $999,999
- 93$1,000,000 or more

Distribution of rent paid by renters
![Distribution of rent paid by renters]()
- 5$900 to $999
- 21$1,000 to $1,249
- 1$1,500 to $1,999
- 38$2,000 or more

Median rent in 2022:
| Riverview: | $2,286 |
| San Jose: | $2,001 |
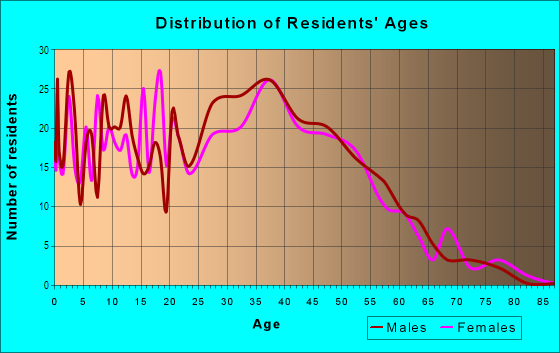
| Males: | 570 |
| Females: | 661 |
Males:
| This neighborhood: | 35.7 years |
| Whole city: | 37.6 years |
| This neighborhood: | 40.8 years |
| Whole city: | 39.1 years |
Average household size:
| Riverview: | 4.2 people |
| San Jose: | 2.9 people |
Percentage of family households:
| Riverview: | 59.2% |
| San Jose: | 49.9% |
| Here: | 68.5% |
| San Jose: | 53.0% |
Percentage of married-couple families with children (among all households):
| Riverview: | 20.1% |
| San Jose: | 25.8% |
Percentage of single-mother households (among all households):
| Riverview: | 3.5% |
| San Jose: | 5.2% |
Percentage of never married males 15 years old and over:
Percentage of never married females 15 years old and over:
| Riverview: | 21.1% |
| San Jose: | 20.9% |
Percentage of never married females 15 years old and over:
| Riverview: | 19.8% |
| city: | 16.7% |
Percentage of people that speak English not well or not at all:
| Riverview: | 0.0% |
| San Jose: | 11.4% |
Percentage of people born in this state:
Percentage of people born in another U.S. state:
Percentage of native residents but born outside the U.S.:
Percentage of foreign born residents:
| Here: | 50.0% |
| San Jose: | 46.1% |
Percentage of people born in another U.S. state:
| Riverview: | 6.1% |
| San Jose: | 10.4% |
Percentage of native residents but born outside the U.S.:
| Here: | 0.6% |
| city: | 1.7% |
Percentage of foreign born residents:
| Here: | 43.4% |
| San Jose: | 41.8% |
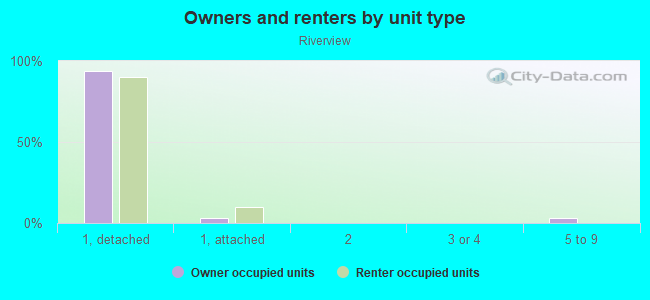
Owner-occupied
Renter-occupied

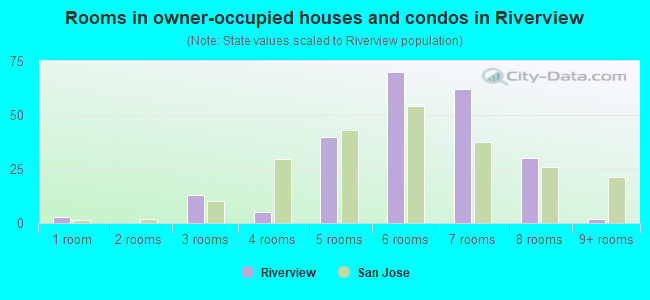
- Rooms in owner-occupied houses and condos in Riverview
- 31 room
- 02 rooms
- 133 rooms
- 54 rooms
- 405 rooms
- 706 rooms
- 627 rooms
- 308 rooms
- 29+ rooms
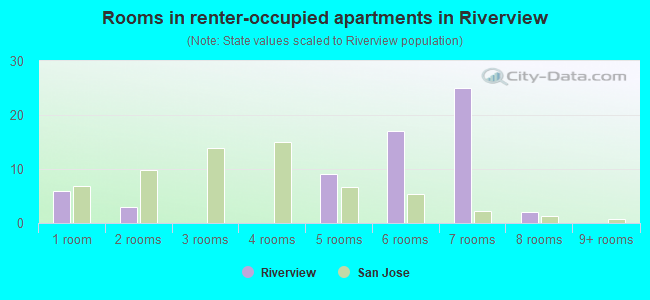
- Rooms in renter-occupied apartments in Riverview
- 61 room
- 32 rooms
- 03 rooms
- 04 rooms
- 95 rooms
- 176 rooms
- 257 rooms
- 28 rooms
- 09+ rooms
Owner-occupied
Renter-occupied
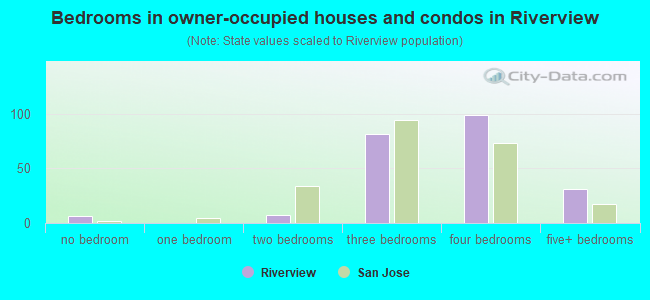
- Bedrooms in owner-occupied houses and condos in Riverview
- 6no bedroom
- 01 bedroom
- 72 bedrooms
- 823 bedrooms
- 994 bedrooms
- 315+ bedrooms
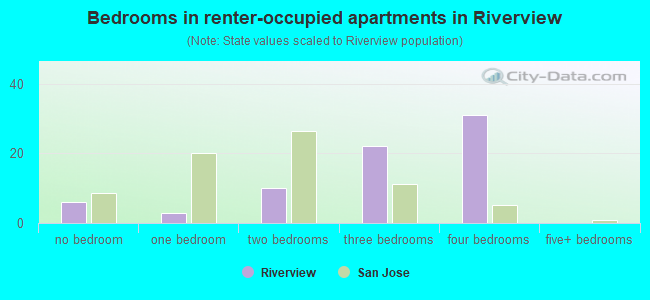
- Bedrooms in renter-occupied apartments in Riverview
- 6no bedroom
- 31 bedroom
- 102 bedrooms
- 223 bedrooms
- 314 bedrooms
- 05+ bedrooms
Average number of cars or other vehicles available in houses/condos:
Average number of cars or other vehicles available in apartments:
| This neighborhood: | 3.2 |
| San Jose: | 2.3 |
Average number of cars or other vehicles available in apartments:
| Here: | 2.1 |
| city: | 1.6 |
Percentage of units with a mortgage:
| Riverview: | 67.6% |
| San Jose: | 66.9% |
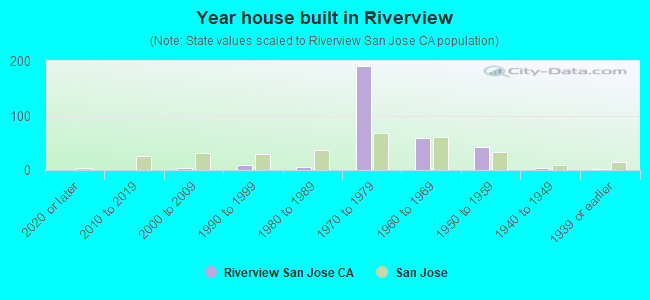
- Year house built in Riverview
- 02020 or later
- 02010 to 2019
- 32000 to 2009
- 91990 to 1999
- 51980 to 1989
- 1901970 to 1979
- 591960 to 1969
- 421950 to 1959
- 31940 to 1949
- 21939 or earlier
City-data.com crime index for city in 2020 (higher means more crime):
| City: | 268.4 |
| U.S. average: | 219.5 |
Travel time to work (commute)
![Travel time to work (commute)]()
- 225 to 9 minutes
- 8510 to 14 minutes
- 18515 to 19 minutes
- 20820 to 24 minutes
- 5925 to 29 minutes
- 20830 to 34 minutes
- 6735 to 39 minutes
- 7640 to 44 minutes
- 9445 to 59 minutes
- 5560 to 89 minutes
- 1590 or more minutes

Means of transportation to work
![Means of transportation to work]()
- 77.1%594Drove a car alone
- 12.7%98Carpooled
- 1.3%10Bus
- 1.7%13Long-distance train or commuter rail
- 2.3%18Light rail, streetcar or trolley
- 1.9%15Walked
- 4.0%31Other means
- 1.4%11Worked at home

Time leaving home to go to work
![Time leaving home to go to work]()
- 10212:00 a.m. to 4:59 a.m.
- 85:00 a.m. to 5:29 a.m.
- 135:30 a.m. to 5:59 a.m.
- 666:00 a.m. to 6:29 a.m.
- 1536:30 a.m. to 6:59 a.m.
- 1607:00 a.m. to 7:29 a.m.
- 1377:30 a.m. to 7:59 a.m.
- 1618:00 a.m. to 8:29 a.m.
- 688:30 a.m. to 8:59 a.m.
- 929:00 a.m. to 9:59 a.m.
- 1010:00 a.m. to 10:59 a.m.
- 111:00 a.m. to 11:59 a.m.
- 4012:00 p.m. to 3:59 p.m.
- 564:00 p.m. to 11:59 p.m.

Occupations of males:
- Percentage of males in management occupations (except farmers):
Here: 7.6% city: 13.0%
- Percentage of males in business and financial operations occupations:
Here: 7.6% city: 4.6%
- Percentage of males in computer and mathematical occupations:
Here: 8.4% city: 13.6%
- Percentage of males in architecture and engineering occupations:
Here: 7.7% city: 10.2%
- Percentage of males in life, physical, and social science occupations:
Here: 1.2% city: 1.1%
- Percentage of males in education, training, and library occupations:
Here: 5.2% city: 2.8%
- Percentage of males in service occupations:
Here: 22.0% city: 12.7%
- Percentage of males in sales and office occupations:
Here: 5.9% city: 12.8%
- Percentage of males in construction, extraction, and maintenance occupations:
Here: 4.5% city: 7.8%
- Percentage of males in production occupations:
Here: 12.7% city: 5.5%
- Percentage of males in transportation occupations:
Here: 4.1% city: 3.6%
- Percentage of males in material moving occupations:
Here: 3.3% city: 3.1%
Occupations of females:
- Percentage of females in management occupations (except farmers):
Here: 6.6% city: 11.0%
- Percentage of females in business and financial operations occupations:
Here: 12.6% city: 8.6%
- Percentage of females in architecture and engineering occupations:
Here: 3.3% city: 2.8%
- Percentage of females in life, physical, and social science occupations:
Here: 1.6% city: 1.7%
- Percentage of females in community and social services occupations:
Here: 1.0% city: 1.8%
- Percentage of females in education, training, and library occupations:
Here: 2.0% city: 8.1%
- Percentage of females in healthcare practitioners and technical occupations:
Here: 5.1% city: 6.8%
- Percentage of females in service occupations:
Here: 25.5% city: 21.7%
- Percentage of females in sales and office occupations:
Here: 30.4% city: 22.0%
- Percentage of females in production occupations:
Here: 4.8% city: 4.0%
- Percentage of females in transportation occupations:
Here: 3.7% city: 0.7%
- Percentage of females in material moving occupations:
Here: 3.3% city: 1.5%
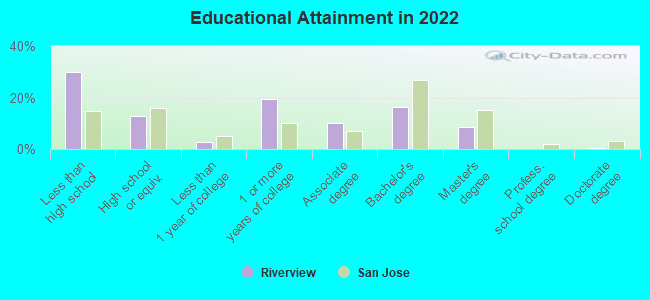
Education in this neighborhood (subdivision or community):
- Percentage of people 3 years and older in K-12 schools:
Riverview: 9.9% San Jose: 16.1%
- Percentage of people 3 years and older in undergraduate colleges:
Riverview: 10.7% San Jose: 6.5%
- Percentage of people 3 years and older in grad. or professional schools:
Riverview: 2.5% San Jose: 2.0%
- Percentage of students K-12 enrolled in private schools:
Riverview: 8.5% San Jose: 14.9%
Percentage of population below poverty level:
| Riverview: | 9.9% |
| San Jose: | 9.0% |
Median year owner moved in (as recorded in 2022):
Median year renter moved in (as recorded in 2022):
| Riverview: | 2007 |
| San Jose: | 2008 |
Median year renter moved in (as recorded in 2022):
| Riverview: | 2013 |
| San Jose: | 2020 |
Percentage of married-couple families with both working:
| Riverview: | 78.3% |
| San Jose: | 72.5% |
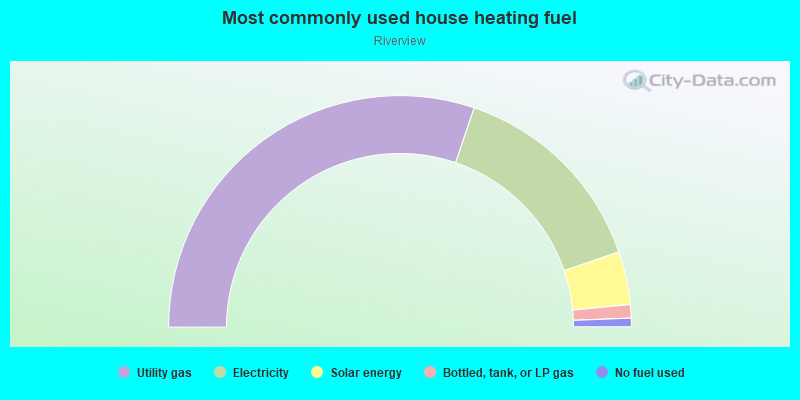
- 60.4%Utility gas
- 29.1%Electricity
- 7.4%Solar energy
- 1.9%Bottled, tank, or LP gas
- 1.2%No fuel used
Roads and streets:
River View Dr
Length: 0.84 miles
Direction: E-W
Address range: 373 to 699
Direction: E-W
Address range: 373 to 699
Skyway Dr
Length: 0.82 miles
Direction: E-W
Address range: 272 to 699
Direction: E-W
Address range: 272 to 699
Rahway Dr
Length: 0.42 miles
Directions: N-S, SE-NW, SW-NE
Address range: 4700 to 5099
Directions: N-S, SE-NW, SW-NE
Address range: 4700 to 5099
Plainfield Dr
Length: 0.32 miles
Directions: N-S, SE-NW
Address range: 4700 to 4899
Directions: N-S, SE-NW
Address range: 4700 to 4899
Via Primavera Dr
Length: 0.25 miles
Directions: E-W, N-S, SW-NE
Address range: 371 to 499
Directions: E-W, N-S, SW-NE
Address range: 371 to 499
Lyric Ln
Length: 0.20 miles
Directions: N-S, SW-NE
Address range: 4756 to 4799
Directions: N-S, SW-NE
Address range: 4756 to 4799
Giraudo Dr
Length: 0.20 miles
Direction: E-W
Address range: 500 to 648
Direction: E-W
Address range: 500 to 648
Bolero Dr
Length: 0.20 miles
Direction: N-S
Address range: 4615 to 4799
Direction: N-S
Address range: 4615 to 4799
Branham Ln E
Length: 0.19 miles
Direction: E-W
Address range: 347 to 444
Direction: E-W
Address range: 347 to 444
Braxton Dr
Length: 0.18 miles
Directions: E-W, SE-NW
Address range: 600 to 799
Directions: E-W, SE-NW
Address range: 600 to 799
Mendoza Ave
Length: 0.16 miles
Direction: N-S
Address range: 4700 to 4799
Direction: N-S
Address range: 4700 to 4799
Yamato Dr
Length: 0.16 miles
Directions: E-W, N-S, SW-NE
Address range: 1850 to 4899
Directions: E-W, N-S, SW-NE
Address range: 1850 to 4899
Allegro Ln
Length: 0.16 miles
Direction: N-S
Address range: 4700 to 4799
Direction: N-S
Address range: 4700 to 4799
Ventura Ave
Length: 0.16 miles
Direction: N-S
Address range: 4600 to 4699
Direction: N-S
Address range: 4600 to 4699
Paloma Ave
Length: 0.15 miles
Direction: N-S
Address range: 4600 to 4699
Direction: N-S
Address range: 4600 to 4699
Lobos Ave
Length: 0.15 miles
Direction: N-S
Address range: 4500 to 4599
Direction: N-S
Address range: 4500 to 4599
del Rey Ave
Length: 0.15 miles
Direction: N-S
Address range: 4400 to 4599
Direction: N-S
Address range: 4400 to 4599
Capitola Ave
Length: 0.15 miles
Direction: N-S
Address range: 4500 to 4699
Direction: N-S
Address range: 4500 to 4699
Aptos Ave
Length: 0.14 miles
Direction: N-S
Address range: 4500 to 4699
Direction: N-S
Address range: 4500 to 4699
Verano Ct
Length: 0.14 miles
Direction: E-W
Address range: 401 to 598
Direction: E-W
Address range: 401 to 598
Via Primavera Ct
Length: 0.08 miles
Direction: E-W
Address range: 500 to 699
Direction: E-W
Address range: 500 to 699
Plz Invierno
Length: 0.08 miles
Direction: E-W
Address range: 600 to 699
Direction: E-W
Address range: 600 to 699
Dotey Ct
Length: 0.06 miles
Direction: E-W
Address range: 600 to 699
Direction: E-W
Address range: 600 to 699
Renzo Ct
Length: 0.03 miles
Direction: N-S
Address range: 4700 to 4799
Direction: N-S
Address range: 4700 to 4799
Gordola Ct
Length: 0.02 miles
Direction: E-W
Address range: 300 to 399
Direction: E-W
Address range: 300 to 399
del Rey Ct
Length: 0.02 miles
Direction: E-W
Address range: 300 to 399
Direction: E-W
Address range: 300 to 399