Rim Area neighborhood in El Paso, Texas (TX), 79902 detailed profile
Settings
X


Business Search - 14 Million verified businesses
Area: 0.397 square miles
Population: 951
Population density:
| Rim Area: | 2,394 people per square mile |
| El Paso: | 2,720 people per square mile |

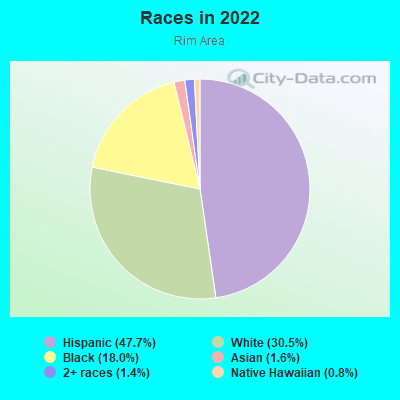
- 52947.7%Hispanic or Latino
- 33830.5%White
- 20018.0%Black
- 181.6%Asian
- 161.4%Two or more races
- 90.8%Native Hawaiian and Other
Pacific Islander
Distribution of median household income
![Distribution of median household income]()
- 28Less than $10,000
- 72$10,000 to $19,999
- 73$20,000 to $29,999
- 62$30,000 to $39,999
- 37$40,000 to $49,999
- 19$50,000 to $59,999
- 24$60,000 to $74,999
- 46$75,000 to $99,999
- 85$100,000 to $124,999
- 12$125,000 to $149,999
- 18$150,000 to $199,999
- 214$200,000 or more

Distribution of owner-occupied house/condo value
![Distribution of owner-occupied house/condo value]()
- 4Less than $50,000
- 77$50,000 to $99,999
- 61$100,000 to $149,999
- 25$150,000 to $199,999
- 46$200,000 to $249,999
- 29$250,000 to $299,999
- 74$300,000 to $399,999
- 11$400,000 to $499,999
- 37$500,000 to $749,999
- 8$750,000 to $999,999
- 136$1,000,000 or more

Distribution of rent paid by renters
![Distribution of rent paid by renters]()
- 37$300 to $399
- 22$400 to $499
- 110$500 to $599
- 60$600 to $699
- 29$700 to $799
- 48$800 to $899
- 17$900 to $999
- 104$1,000 to $1,249
- 6$1,250 to $1,499
- 45$1,500 to $1,999
- 15$2,000 or more

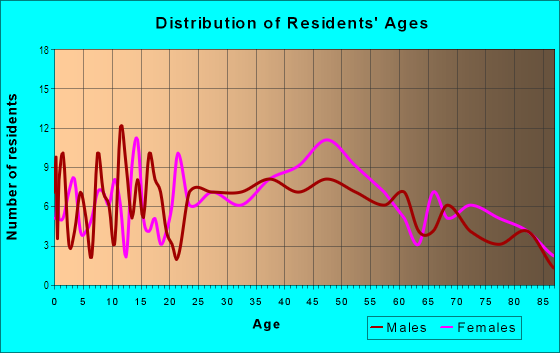
| Males: | 530 |
| Females: | 421 |
Males:
| This neighborhood: | 44.5 years |
| Whole city: | 32.5 years |
| This neighborhood: | 49.5 years |
| Whole city: | 35.9 years |
Percentage of family households:
| Rim Area: | 13.7% |
| El Paso: | 50.2% |
| Here: | 56.1% |
| El Paso: | 43.5% |
Percentage of married-couple families with children (among all households):
| Rim Area: | 25.0% |
| El Paso: | 23.1% |
Percentage of single-mother households (among all households):
| Rim Area: | 15.8% |
| El Paso: | 10.8% |
Percentage of never married males 15 years old and over:
Percentage of never married females 15 years old and over:
| Rim Area: | 24.6% |
| El Paso: | 18.8% |
Percentage of never married females 15 years old and over:
| Rim Area: | 17.7% |
| city: | 17.5% |
Percentage of people that speak English not well or not at all:
| Rim Area: | 4.8% |
| El Paso: | 12.0% |
Percentage of people born in this state:
Percentage of people born in another U.S. state:
Percentage of native residents but born outside the U.S.:
Percentage of foreign born residents:
| Here: | 57.2% |
| El Paso: | 59.0% |
Percentage of people born in another U.S. state:
| Rim Area: | 23.7% |
| El Paso: | 15.7% |
Percentage of native residents but born outside the U.S.:
| Here: | 2.9% |
| city: | 2.4% |
Percentage of foreign born residents:
| Here: | 16.2% |
| El Paso: | 22.9% |
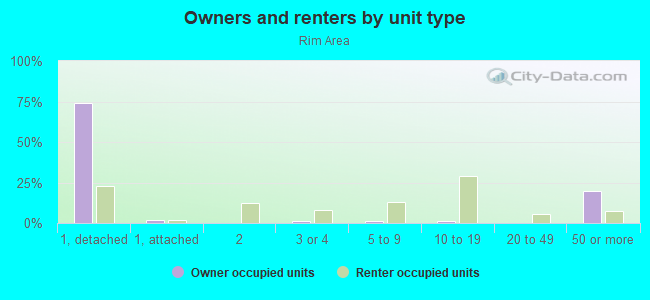
Owner-occupied
Renter-occupied

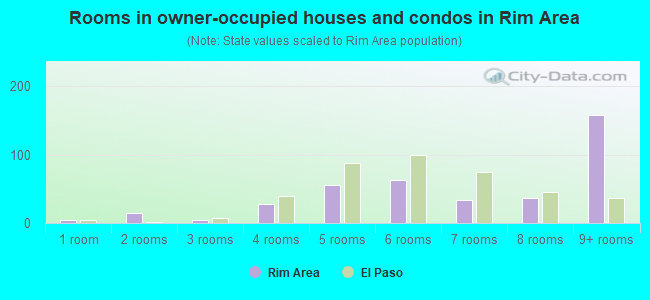
- Rooms in owner-occupied houses and condos in Rim Area
- 41 room
- 152 rooms
- 43 rooms
- 284 rooms
- 555 rooms
- 636 rooms
- 337 rooms
- 368 rooms
- 1589+ rooms
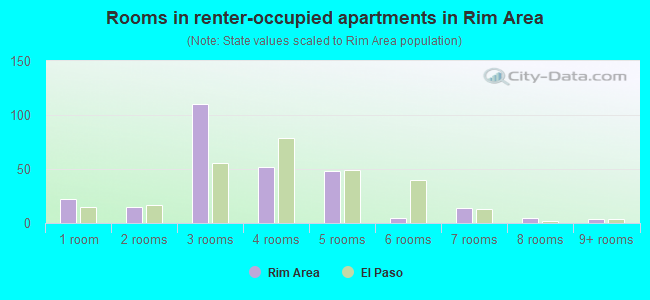
- Rooms in renter-occupied apartments in Rim Area
- 221 room
- 152 rooms
- 1103 rooms
- 524 rooms
- 485 rooms
- 56 rooms
- 147 rooms
- 58 rooms
- 49+ rooms
Owner-occupied
Renter-occupied
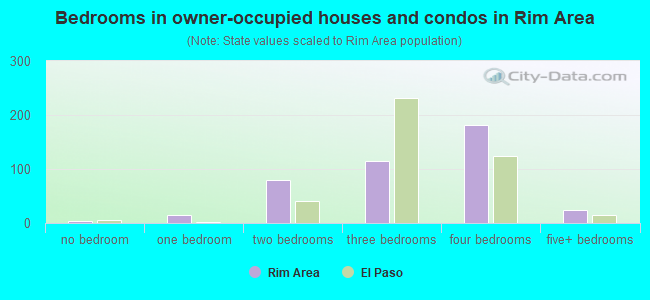
- Bedrooms in owner-occupied houses and condos in Rim Area
- 4no bedroom
- 151 bedroom
- 792 bedrooms
- 1153 bedrooms
- 1814 bedrooms
- 245+ bedrooms
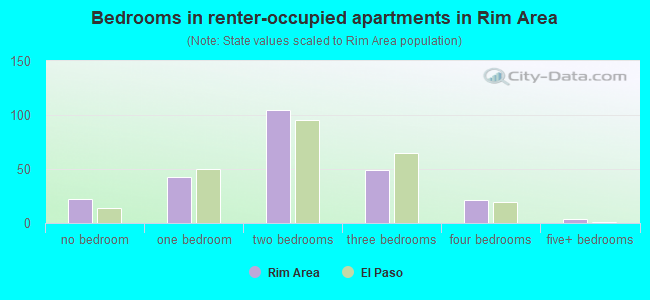
- Bedrooms in renter-occupied apartments in Rim Area
- 22no bedroom
- 431 bedroom
- 1052 bedrooms
- 493 bedrooms
- 214 bedrooms
- 45+ bedrooms
Average number of cars or other vehicles available in houses/condos:
Average number of cars or other vehicles available in apartments:
| This neighborhood: | 1.9 |
| El Paso: | 2.1 |
Average number of cars or other vehicles available in apartments:
| Here: | 0.9 |
| city: | 1.5 |
Percentage of units with a mortgage:
| Rim Area: | 61.2% |
| El Paso: | 52.3% |
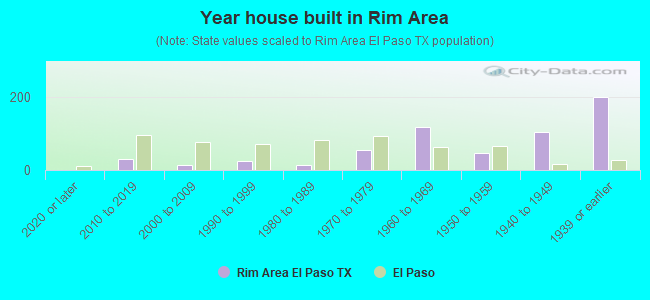
- Year house built in Rim Area
- 02020 or later
- 302010 to 2019
- 142000 to 2009
- 241990 to 1999
- 131980 to 1989
- 541970 to 1979
- 1181960 to 1969
- 461950 to 1959
- 1041940 to 1949
- 1991939 or earlier
City-data.com crime index for city in 2020 (higher means more crime):
| City: | 153.5 |
| U.S. average: | 219.5 |
Travel time to work (commute)
![Travel time to work (commute)]()
- 37Less than 5 minutes
- 825 to 9 minutes
- 13810 to 14 minutes
- 8315 to 19 minutes
- 18520 to 24 minutes
- 11225 to 29 minutes
- 7230 to 34 minutes
- 535 to 39 minutes
- 540 to 44 minutes
- 1345 to 59 minutes
- 960 to 89 minutes
- 1290 or more minutes

Means of transportation to work
![Means of transportation to work]()
- 81.2%364Drove a car alone
- 2.9%13Carpooled
- 4.2%19Bus
- 1.1%5Bicycle
- 12.9%58Walked
- 13.4%60Other means
- 8.7%39Worked at home

Time leaving home to go to work
![Time leaving home to go to work]()
- 912:00 a.m. to 4:59 a.m.
- 75:00 a.m. to 5:29 a.m.
- 45:30 a.m. to 5:59 a.m.
- 446:00 a.m. to 6:29 a.m.
- 526:30 a.m. to 6:59 a.m.
- 1117:00 a.m. to 7:29 a.m.
- 667:30 a.m. to 7:59 a.m.
- 1338:00 a.m. to 8:29 a.m.
- 398:30 a.m. to 8:59 a.m.
- 729:00 a.m. to 9:59 a.m.
- 1110:00 a.m. to 10:59 a.m.
- 2711:00 a.m. to 11:59 a.m.
- 9512:00 p.m. to 3:59 p.m.
- 144:00 p.m. to 11:59 p.m.

Occupations of males:
- Percentage of males in management occupations (except farmers):
Here: 23.8% city: 10.5%
- Percentage of males in business and financial operations occupations:
Here: 1.5% city: 3.1%
- Percentage of males in computer and mathematical occupations:
Here: 1.6% city: 2.8%
- Percentage of males in life, physical, and social science occupations:
Here: 1.8% city: 0.7%
- Percentage of males in education, training, and library occupations:
Here: 6.3% city: 5.1%
- Percentage of males in arts, design, entertainment, sports, and media occupations:
Here: 3.4% city: 1.1%
- Percentage of males in service occupations:
Here: 7.9% city: 17.7%
- Percentage of males in sales and office occupations:
Here: 6.8% city: 17.1%
- Percentage of males in construction, extraction, and maintenance occupations:
Here: 46.6% city: 9.5%
Occupations of females:
- Percentage of females in management occupations (except farmers):
Here: 3.0% city: 7.3%
- Percentage of females in business and financial operations occupations:
Here: 6.7% city: 5.1%
- Percentage of females in life, physical, and social science occupations:
Here: 4.7% city: 0.7%
- Percentage of females in legal occupations:
Here: 6.7% city: 0.8%
- Percentage of females in education, training, and library occupations:
Here: 6.7% city: 11.1%
- Percentage of females in healthcare practitioners and technical occupations:
Here: 13.4% city: 8.6%
- Percentage of females in service occupations:
Here: 4.8% city: 24.7%
- Percentage of females in sales and office occupations:
Here: 54.0% city: 30.7%
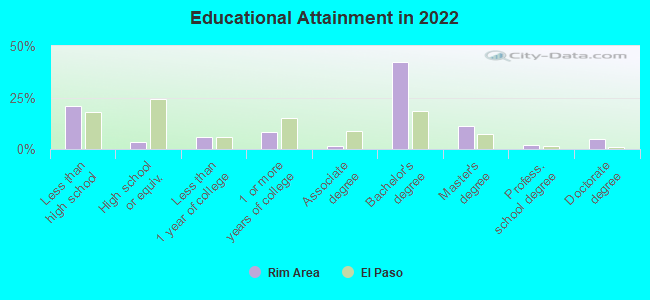
Education in this neighborhood (subdivision or community):
- Percentage of people 3 years and older in K-12 schools:
Rim Area: 17.9% El Paso: 19.6%
- Percentage of people 3 years and older in undergraduate colleges:
Rim Area: 71.1% El Paso: 6.7%
- Percentage of people 3 years and older in grad. or professional schools:
Rim Area: 3.0% El Paso: 1.5%
- Percentage of students K-12 enrolled in private schools:
Rim Area: 32.7% El Paso: 6.2%
Percentage of population below poverty level:
| Rim Area: | 8.1% |
| El Paso: | 21.7% |
Percentage of married-couple families with both working:
| Rim Area: | 76.4% |
| El Paso: | 58.6% |
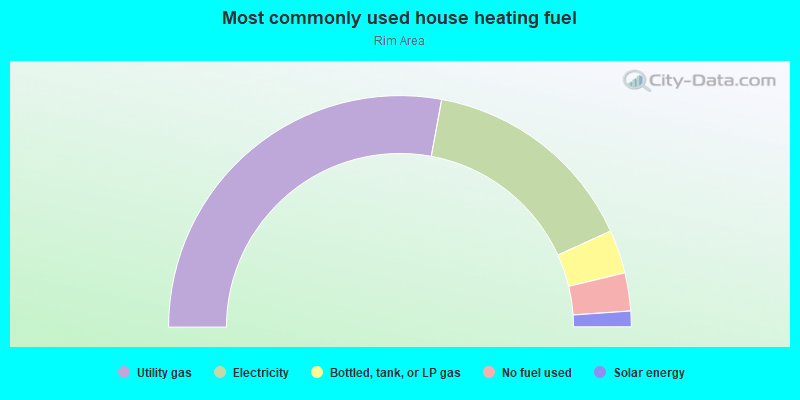
- 55.8%Utility gas
- 30.6%Electricity
- 6.1%Bottled, tank, or LP gas
- 5.3%No fuel used
- 2.2%Solar energy
Roads and streets:
Rim Rd
Length: 0.76 miles
Directions: E-W, N-S, SE-NW, SW-NE
Address range: 748 to 1699
Directions: E-W, N-S, SE-NW, SW-NE
Address range: 748 to 1699
Kerbey Ave
Length: 0.65 miles
Direction: SW-NE
Address range: 300 to 1199
Direction: SW-NE
Address range: 300 to 1199
Blanchard Ave
Length: 0.59 miles
Directions: N-S, SE-NW, SW-NE
Address range: 300 to 1099
Directions: N-S, SE-NW, SW-NE
Address range: 300 to 1099
N Campbell St
Length: 0.48 miles
Direction: SE-NW
Address range: 1800 to 2506
Direction: SE-NW
Address range: 1800 to 2506
E University Ave
Length: 0.48 miles
Direction: SW-NE
Address range: 300 to 999
Direction: SW-NE
Address range: 300 to 999
N Kansas St
Length: 0.47 miles
Direction: SE-NW
Address range: 1800 to 2499
Direction: SE-NW
Address range: 1800 to 2499
N Stanton St
Length: 0.47 miles
Direction: SE-NW
Address range: 1800 to 2499
Direction: SE-NW
Address range: 1800 to 2499
New York Ave
Length: 0.45 miles
Directions: E-W, SW-NE
Address range: 400 to 1099
Directions: E-W, SW-NE
Address range: 400 to 1099
Blacker Ave
Length: 0.42 miles
Direction: SW-NE
Address range: 300 to 899
Direction: SW-NE
Address range: 300 to 899
N St Vrain St (N Saint Vrain St)
Length: 0.39 miles
Direction: SE-NW
Address range: 1900 to 2499
Direction: SE-NW
Address range: 1900 to 2499
Ochoa St (N Ochoa St)
Length: 0.36 miles
Direction: SE-NW
Address range: 1800 to 2499
Direction: SE-NW
Address range: 1800 to 2499
North Virginia St
Length: 0.36 miles
Directions: N-S, SE-NW
Address range: 2000 to 2477
Directions: N-S, SE-NW
Address range: 2000 to 2477
E Hague Rd
Length: 0.29 miles
Directions: E-W, SW-NE
Address range: 300 to 799
Directions: E-W, SW-NE
Address range: 300 to 799
N Florence St
Length: 0.29 miles
Direction: SE-NW
Address range: 2000 to 2499
Direction: SE-NW
Address range: 2000 to 2499
Ange St
Length: 0.20 miles
Directions: E-W, SE-NW
Address range: 2100 to 2399
Directions: E-W, SE-NW
Address range: 2100 to 2399
Boston Ave
Length: 0.14 miles
Direction: SW-NE
Address range: 300 to 499
Direction: SW-NE
Address range: 300 to 499
Rim Road Pl
Length: 0.10 miles
Directions: E-W, SE-NW
Address range: 1200 to 1210
Directions: E-W, SE-NW
Address range: 1200 to 1210
N Octavia St
Length: 0.05 miles
Direction: SE-NW
Address range: 2300 to 2399
Direction: SE-NW
Address range: 2300 to 2399
E Robinson Ave
Length: 0.04 miles
Direction: SE-NW
Address range: 1807 to 2299
Direction: SE-NW
Address range: 1807 to 2299
Other features:
Crazy Cat Arroyo
Length: 0.52 miles
Direction: SW-NE
Direction: SW-NE