Richardson Heights neighborhood in Richardson, Texas (TX), 75080 detailed profile
Settings
X


Business Search - 14 Million verified businesses
Area: 0.363 square miles
Population: 4,179
Population density:
| Richardson Heights: | 11,524 people per square mile |
| Richardson: | 4,160 people per square mile |

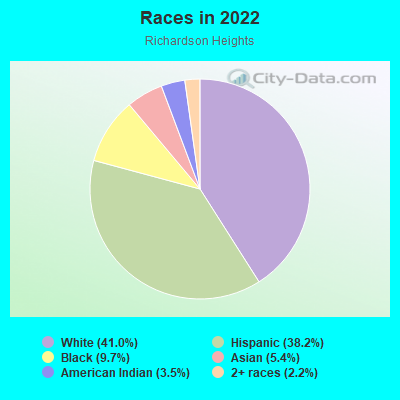
- 1,74841.0%White
- 1,62838.2%Hispanic or Latino
- 4119.7%Black
- 2325.4%Asian
- 1483.5%American Indian
- 922.2%Two or more races
Median household income in 2022:
| Richardson Heights: | $88,415 |
| Richardson: | $86,175 |
Distribution of median household income
![Distribution of median household income]()
- 101Less than $10,000
- 200$10,000 to $19,999
- 105$20,000 to $29,999
- 80$30,000 to $39,999
- 334$40,000 to $49,999
- 181$50,000 to $59,999
- 166$60,000 to $74,999
- 92$75,000 to $99,999
- 156$100,000 to $124,999
- 101$125,000 to $149,999
- 269$150,000 to $199,999
- 141$200,000 or more

Distribution of owner-occupied house/condo value
![Distribution of owner-occupied house/condo value]()
- 22Less than $50,000
- 107$100,000 to $149,999
- 58$150,000 to $199,999
- 52$200,000 to $249,999
- 114$250,000 to $299,999
- 290$300,000 to $399,999
- 247$400,000 to $499,999
- 149$500,000 to $749,999
- 23$750,000 to $999,999
- 39$1,000,000 or more

Distribution of rent paid by renters
![Distribution of rent paid by renters]()
- 61$600 to $699
- 299$800 to $899
- 269$900 to $999
- 424$1,000 to $1,249
- 93$1,250 to $1,499
- 104$1,500 to $1,999
- 89$2,000 or more

Median rent in 2022:
| Richardson Heights: | $1,305 |
| Richardson: | $1,560 |
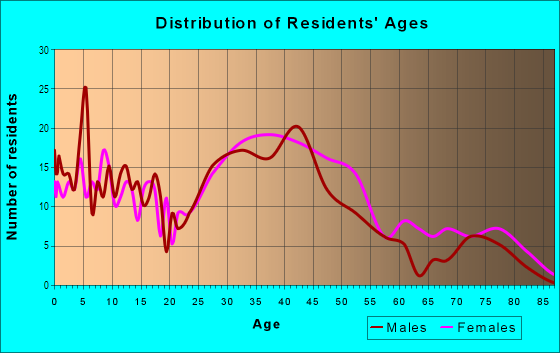
| Males: | 2,171 |
| Females: | 2,008 |
Males:
| This neighborhood: | 39.9 years |
| Whole city: | 34.6 years |
| This neighborhood: | 40.5 years |
| Whole city: | 36.0 years |
Average household size:
| Richardson Heights: | 2.6 people |
| Richardson: | 2.3 people |
Percentage of family households:
| Richardson Heights: | 53.2% |
| Richardson: | 41.4% |
| Here: | 45.5% |
| Richardson: | 44.1% |
Percentage of married-couple families with children (among all households):
| Richardson Heights: | 28.5% |
| Richardson: | 30.4% |
Percentage of single-mother households (among all households):
| Richardson Heights: | 6.2% |
| Richardson: | 8.7% |
Percentage of never married males 15 years old and over:
Percentage of never married females 15 years old and over:
| Richardson Heights: | 19.6% |
| Richardson: | 21.2% |
Percentage of never married females 15 years old and over:
| Richardson Heights: | 12.6% |
| city: | 18.3% |
Percentage of people that speak English not well or not at all:
| Richardson Heights: | 4.7% |
| Richardson: | 3.6% |
Percentage of people born in this state:
Percentage of people born in another U.S. state:
Percentage of native residents but born outside the U.S.:
Percentage of foreign born residents:
| Here: | 60.1% |
| Richardson: | 45.6% |
Percentage of people born in another U.S. state:
| Richardson Heights: | 24.5% |
| Richardson: | 30.8% |
Percentage of native residents but born outside the U.S.:
| Here: | 2.1% |
| city: | 1.5% |
Percentage of foreign born residents:
| Here: | 13.3% |
| Richardson: | 22.1% |
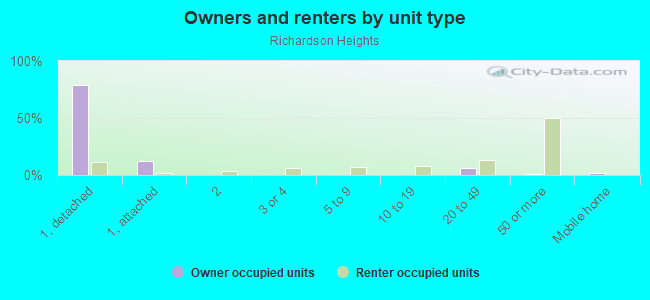
Owner-occupied
Renter-occupied

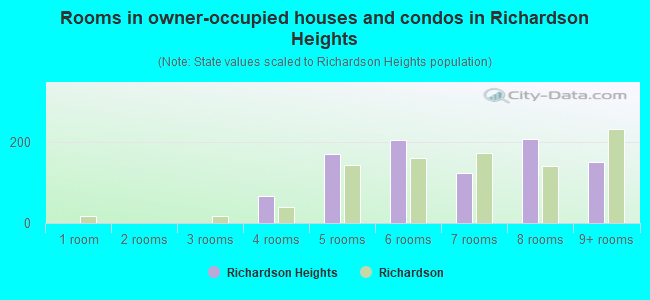
- Rooms in owner-occupied houses and condos in Richardson Heights
- 11 room
- 02 rooms
- 03 rooms
- 674 rooms
- 1695 rooms
- 2036 rooms
- 1227 rooms
- 2068 rooms
- 1509+ rooms
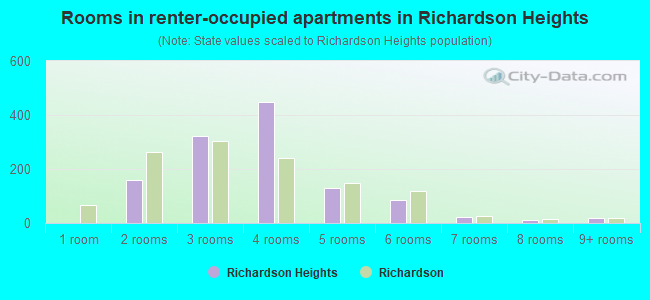
- Rooms in renter-occupied apartments in Richardson Heights
- 01 room
- 1592 rooms
- 3233 rooms
- 4494 rooms
- 1295 rooms
- 866 rooms
- 247 rooms
- 118 rooms
- 189+ rooms
Owner-occupied
Renter-occupied
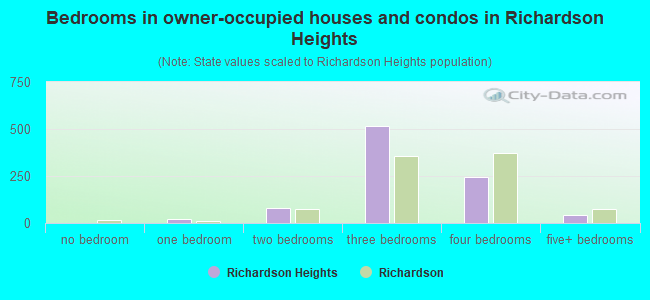
- Bedrooms in owner-occupied houses and condos in Richardson Heights
- 1no bedroom
- 191 bedroom
- 792 bedrooms
- 5163 bedrooms
- 2434 bedrooms
- 405+ bedrooms
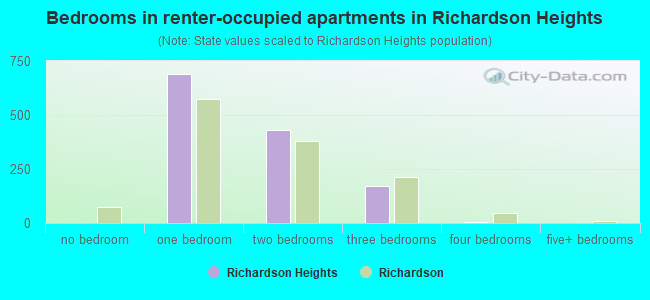
- Bedrooms in renter-occupied apartments in Richardson Heights
- 0no bedroom
- 6881 bedroom
- 4322 bedrooms
- 1693 bedrooms
- 64 bedrooms
- 05+ bedrooms
Average number of cars or other vehicles available in houses/condos:
Average number of cars or other vehicles available in apartments:
| This neighborhood: | 1.8 |
| Richardson: | 2.0 |
Average number of cars or other vehicles available in apartments:
| Here: | 1.5 |
| city: | 1.3 |
Percentage of units with a mortgage:
| Richardson Heights: | 60.7% |
| Richardson: | 57.8% |
Average estimated value of detached houses in 2022 (49.4% of all units):
| Richardson Heights: | $376,605 |
| Richardson: | $422,742 |
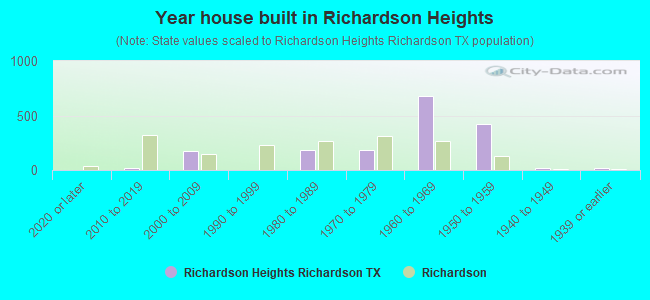
- Year house built in Richardson Heights
- 02020 or later
- 182010 to 2019
- 1742000 to 2009
- 31990 to 1999
- 1841980 to 1989
- 1881970 to 1979
- 6771960 to 1969
- 4221950 to 1959
- 211940 to 1949
- 221939 or earlier
City-data.com crime index for city in 2020 (higher means more crime):
| City: | 145.3 |
| U.S. average: | 219.5 |
Travel time to work (commute)
![Travel time to work (commute)]()
- 9Less than 5 minutes
- 785 to 9 minutes
- 18910 to 14 minutes
- 21615 to 19 minutes
- 16620 to 24 minutes
- 9725 to 29 minutes
- 11430 to 34 minutes
- 3535 to 39 minutes
- 4940 to 44 minutes
- 10145 to 59 minutes
- 4860 to 89 minutes
- 490 or more minutes

Means of transportation to work
![Means of transportation to work]()
- 70.3%1,627Drove a car alone
- 20.0%463Carpooled
- 2.2%50Bus
- 0.7%17Bicycle
- 0.9%20Walked
- 0.8%18Other means
- 15.8%365Worked at home

Time leaving home to go to work
![Time leaving home to go to work]()
- 1912:00 a.m. to 4:59 a.m.
- 335:00 a.m. to 5:29 a.m.
- 205:30 a.m. to 5:59 a.m.
- 1076:00 a.m. to 6:29 a.m.
- 696:30 a.m. to 6:59 a.m.
- 2177:00 a.m. to 7:29 a.m.
- 817:30 a.m. to 7:59 a.m.
- 1548:00 a.m. to 8:29 a.m.
- 648:30 a.m. to 8:59 a.m.
- 1119:00 a.m. to 9:59 a.m.
- 6810:00 a.m. to 10:59 a.m.
- 111:00 a.m. to 11:59 a.m.
- 4712:00 p.m. to 3:59 p.m.
- 634:00 p.m. to 11:59 p.m.

Occupations of males:
- Percentage of males in management occupations (except farmers):
Here: 19.5% city: 16.1%
- Percentage of males in business and financial operations occupations:
Here: 6.2% city: 9.6%
- Percentage of males in computer and mathematical occupations:
Here: 6.3% city: 10.4%
- Percentage of males in architecture and engineering occupations:
Here: 2.2% city: 5.6%
- Percentage of males in legal occupations:
Here: 1.8% city: 1.6%
- Percentage of males in arts, design, entertainment, sports, and media occupations:
Here: 2.9% city: 2.9%
- Percentage of males in service occupations:
Here: 17.1% city: 9.7%
- Percentage of males in sales and office occupations:
Here: 13.2% city: 15.4%
- Percentage of males in construction, extraction, and maintenance occupations:
Here: 5.3% city: 4.5%
- Percentage of males in production occupations:
Here: 5.0% city: 3.6%
- Percentage of males in transportation occupations:
Here: 4.4% city: 3.6%
- Percentage of males in material moving occupations:
Here: 4.0% city: 2.8%
Occupations of females:
- Percentage of females in management occupations (except farmers):
Here: 8.2% city: 10.7%
- Percentage of females in business and financial operations occupations:
Here: 6.4% city: 12.7%
- Percentage of females in computer and mathematical occupations:
Here: 4.6% city: 3.9%
- Percentage of females in life, physical, and social science occupations:
Here: 1.3% city: 0.4%
- Percentage of females in education, training, and library occupations:
Here: 9.6% city: 11.4%
- Percentage of females in arts, design, entertainment, sports, and media occupations:
Here: 1.5% city: 2.1%
- Percentage of females in healthcare practitioners and technical occupations:
Here: 13.7% city: 11.0%
- Percentage of females in service occupations:
Here: 16.9% city: 13.6%
- Percentage of females in sales and office occupations:
Here: 34.7% city: 24.3%
- Percentage of females in production occupations:
Here: 1.0% city: 1.9%
- Percentage of females in material moving occupations:
Here: 1.7% city: 2.0%
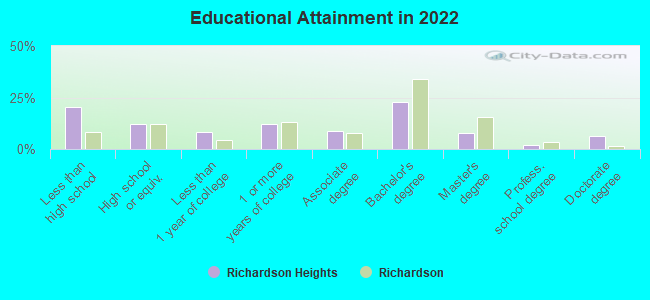
Education in this neighborhood (subdivision or community):
- Percentage of people 3 years and older in K-12 schools:
Richardson Heights: 20.9% Richardson: 15.3%
- Percentage of people 3 years and older in undergraduate colleges:
Richardson Heights: 4.9% Richardson: 9.6%
- Percentage of people 3 years and older in grad. or professional schools:
Richardson Heights: 1.0% Richardson: 2.4%
- Percentage of students K-12 enrolled in private schools:
Richardson Heights: 40.6% Richardson: 18.8%
Percentage of population below poverty level:
| Richardson Heights: | 15.3% |
| Richardson: | 12.1% |
Median year owner moved in (as recorded in 2022):
Median year renter moved in (as recorded in 2022):
| Richardson Heights: | 2007 |
| Richardson: | 2010 |
Median year renter moved in (as recorded in 2022):
| Richardson Heights: | 2017 |
| Richardson: | 2021 |
Percentage of married-couple families with both working:
| Richardson Heights: | 91.9% |
| Richardson: | 68.7% |
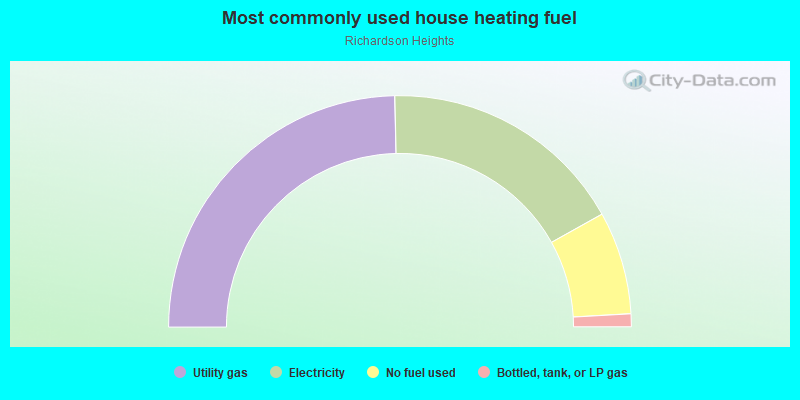
- 49.3%Utility gas
- 34.5%Electricity
- 14.4%No fuel used
- 1.8%Bottled, tank, or LP gas
Roads and streets:
Nottingham Dr
Length: 0.88 miles
Directions: E-W, SW-NE
Address range: 300 to 799
Directions: E-W, SW-NE
Address range: 300 to 799
Sherwood Dr
Length: 0.68 miles
Direction: E-W
Address range: 600 to 807
Direction: E-W
Address range: 600 to 807
Downing Dr
Length: 0.67 miles
Directions: E-W, SE-NW
Address range: 600 to 799
Directions: E-W, SE-NW
Address range: 600 to 799
Scottsdale Dr
Length: 0.64 miles
Directions: E-W, SE-NW
Address range: 600 to 799
Directions: E-W, SE-NW
Address range: 600 to 799
Belt Line Rd (W Belt Line Rd)
Length: 0.63 miles
Direction: E-W
Address range: 600 to 799
Direction: E-W
Address range: 600 to 799
Dumont Dr
Length: 0.61 miles
Directions: E-W, SE-NW
Address range: 600 to 799
Directions: E-W, SE-NW
Address range: 600 to 799
S Weatherred Dr
Length: 0.49 miles
Directions: N-S, SW-NE
Address range: 100 to 799
Directions: N-S, SW-NE
Address range: 100 to 799
Devonshire Dr
Length: 0.49 miles
Direction: E-W
Address range: 600 to 799
Direction: E-W
Address range: 600 to 799
S Floyd Rd
Length: 0.46 miles
Direction: N-S
Address range: 100 to 848
Direction: N-S
Address range: 100 to 848
James Dr
Length: 0.45 miles
Direction: E-W
Address range: 700 to 799
Direction: E-W
Address range: 700 to 799
S Lindale Ln
Length: 0.23 miles
Directions: N-S, SE-NW
Address range: 100 to 399
Directions: N-S, SE-NW
Address range: 100 to 399
Palmer Pl
Length: 0.09 miles
Directions: N-S, SW-NE
Address range: 700 to 799
Directions: N-S, SW-NE
Address range: 700 to 799
S Gentle Dr
Length: 0.09 miles
Direction: SW-NE
Address range: 100 to 199
Direction: SW-NE
Address range: 100 to 199
Bristol Ct
Length: 0.04 miles
Directions: E-W, N-S, SE-NW, SW-NE
Directions: E-W, N-S, SE-NW, SW-NE