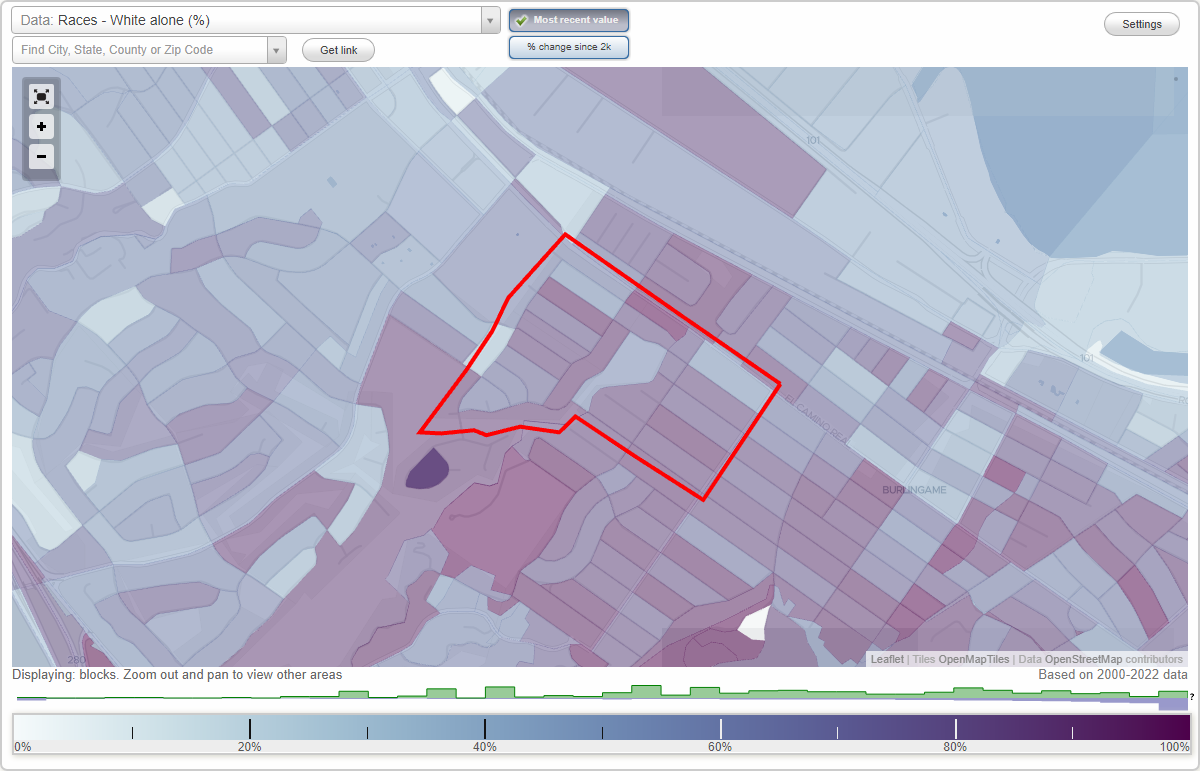
Ray Park neighborhood in Burlingame, California (CA), 94010 detailed profile
Settings
X

Business Search - 14 Million verified businesses
Area: 0.249 square miles
Population: 2,767
Population density:
| Ray Park: | 11,099 people per square mile |
| Burlingame: | 7,151 people per square mile |

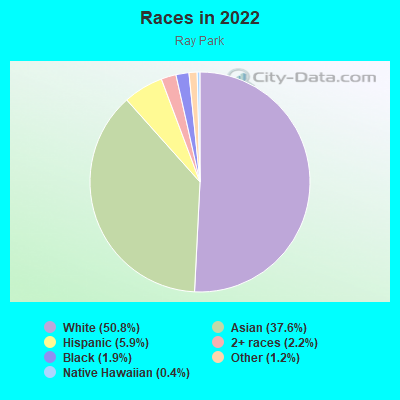
- 1,44950.8%White
- 1,07337.6%Asian
- 1675.9%Hispanic or Latino
- 632.2%Two or more races
- 541.9%Black
- 331.2%Some other race
- 120.4%Native Hawaiian and Other
Pacific Islander
Median household income in 2022:
| Ray Park: | $172,213 |
| Burlingame: | $165,940 |
Distribution of median household income
![Distribution of median household income]()
- 45Less than $10,000
- 53$10,000 to $19,999
- 59$20,000 to $29,999
- 142$30,000 to $39,999
- 51$40,000 to $49,999
- 32$50,000 to $59,999
- 88$60,000 to $74,999
- 115$75,000 to $99,999
- 96$100,000 to $124,999
- 59$125,000 to $149,999
- 93$150,000 to $199,999
- 447$200,000 or more

Distribution of owner-occupied house/condo value
![Distribution of owner-occupied house/condo value]()
- 27Less than $50,000
- 59$100,000 to $149,999
- 20$200,000 to $249,999
- 7$300,000 to $399,999
- 29$400,000 to $499,999
- 15$500,000 to $749,999
- 27$750,000 to $999,999
- 694$1,000,000 or more

Distribution of rent paid by renters
![Distribution of rent paid by renters]()
- 18$100 to $199
- 92$300 to $399
- 51$1,000 to $1,249
- 6$1,250 to $1,499
- 97$1,500 to $1,999
- 270$2,000 or more

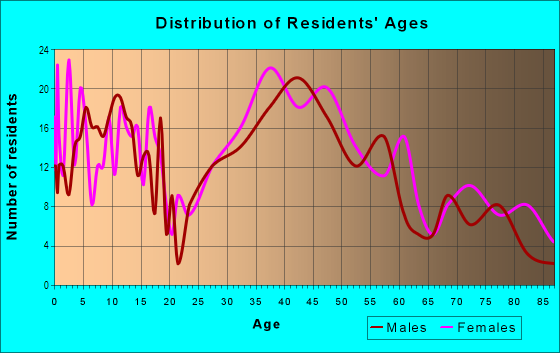
| Males: | 1,553 |
| Females: | 1,214 |
Males:
| This neighborhood: | 41.9 years |
| Whole city: | 39.7 years |
| This neighborhood: | 42.3 years |
| Whole city: | 41.7 years |
Average household size:
| Ray Park: | 9.7 people |
| Burlingame: | 2.5 people |
Percentage of family households:
| Ray Park: | 48.6% |
| Burlingame: | 45.6% |
| Here: | 54.3% |
| Burlingame: | 51.2% |
Percentage of married-couple families with children (among all households):
| Ray Park: | 29.9% |
| Burlingame: | 34.1% |
Percentage of single-mother households (among all households):
| Ray Park: | 2.8% |
| Burlingame: | 3.6% |
Percentage of never married males 15 years old and over:
Percentage of never married females 15 years old and over:
| Ray Park: | 10.8% |
| Burlingame: | 18.3% |
Percentage of never married females 15 years old and over:
| Ray Park: | 10.8% |
| city: | 13.4% |
Percentage of people that speak English not well or not at all:
| Ray Park: | 2.7% |
| Burlingame: | 4.7% |
Percentage of people born in this state:
Percentage of people born in another U.S. state:
Percentage of native residents but born outside the U.S.:
Percentage of foreign born residents:
| Here: | 54.8% |
| Burlingame: | 52.5% |
Percentage of people born in another U.S. state:
| Ray Park: | 18.1% |
| Burlingame: | 16.0% |
Percentage of native residents but born outside the U.S.:
| Here: | 1.9% |
| city: | 1.6% |
Percentage of foreign born residents:
| Here: | 25.2% |
| Burlingame: | 30.0% |
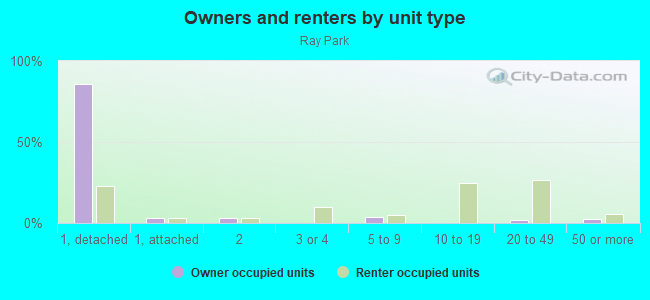
Owner-occupied
Renter-occupied

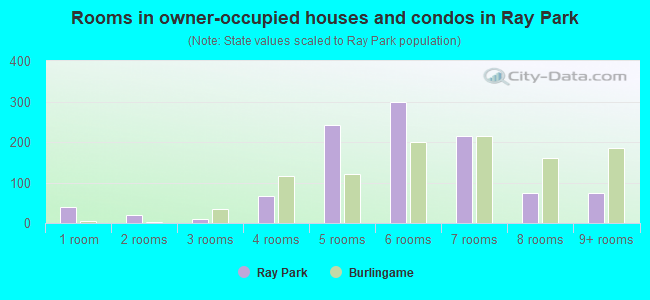
- Rooms in owner-occupied houses and condos in Ray Park
- 391 room
- 202 rooms
- 113 rooms
- 674 rooms
- 2415 rooms
- 2986 rooms
- 2167 rooms
- 738 rooms
- 749+ rooms
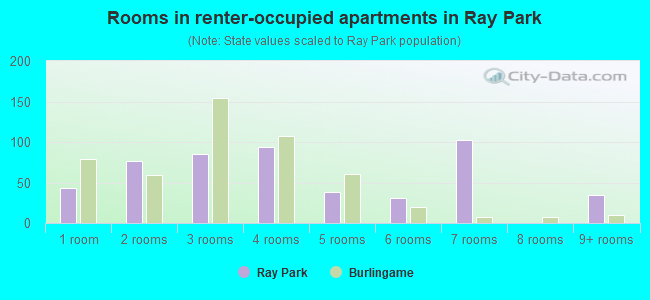
- Rooms in renter-occupied apartments in Ray Park
- 431 room
- 772 rooms
- 853 rooms
- 944 rooms
- 385 rooms
- 316 rooms
- 1037 rooms
- 08 rooms
- 349+ rooms
Owner-occupied
Renter-occupied
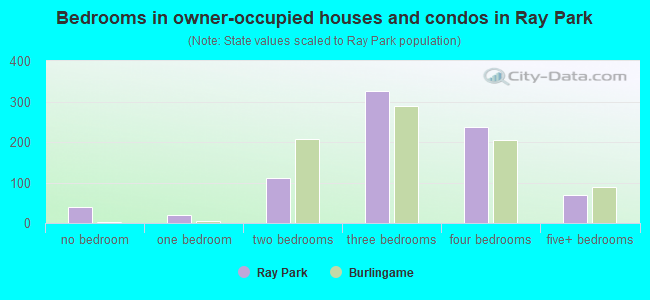
- Bedrooms in owner-occupied houses and condos in Ray Park
- 39no bedroom
- 191 bedroom
- 1122 bedrooms
- 3263 bedrooms
- 2384 bedrooms
- 685+ bedrooms
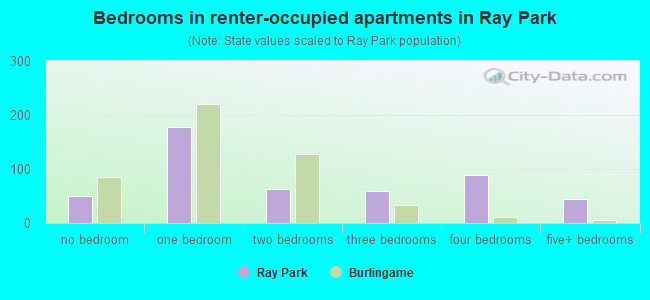
- Bedrooms in renter-occupied apartments in Ray Park
- 50no bedroom
- 1781 bedroom
- 632 bedrooms
- 593 bedrooms
- 894 bedrooms
- 455+ bedrooms
Average number of cars or other vehicles available in houses/condos:
Average number of cars or other vehicles available in apartments:
| This neighborhood: | 2.4 |
| Burlingame: | 2.2 |
Average number of cars or other vehicles available in apartments:
| Here: | 1.9 |
| city: | 1.4 |
Percentage of units with a mortgage:
| Ray Park: | 68.7% |
| Burlingame: | 71.7% |
Average estimated value of detached houses in 2022 (82.0% of all units):
| Ray Park: | $2,403,972 |
| California: | $988,808 |
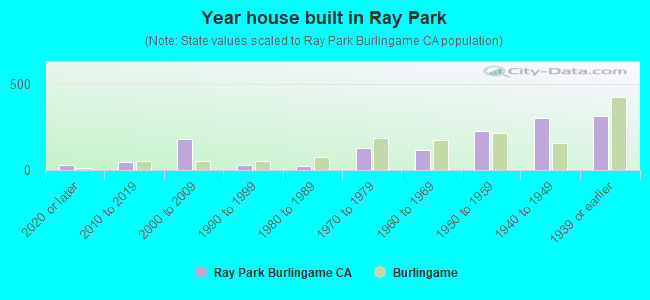
- Year house built in Ray Park
- 292020 or later
- 452010 to 2019
- 1822000 to 2009
- 301990 to 1999
- 251980 to 1989
- 1301970 to 1979
- 1181960 to 1969
- 2271950 to 1959
- 3001940 to 1949
- 3171939 or earlier
City-data.com crime index for city in 2020 (higher means more crime):
| City: | 236.7 |
| U.S. average: | 219.5 |
Travel time to work (commute)
![Travel time to work (commute)]()
- 2Less than 5 minutes
- 515 to 9 minutes
- 11410 to 14 minutes
- 13515 to 19 minutes
- 14020 to 24 minutes
- 4625 to 29 minutes
- 13430 to 34 minutes
- 3435 to 39 minutes
- 3540 to 44 minutes
- 11445 to 59 minutes
- 9860 to 89 minutes
- 2990 or more minutes

Means of transportation to work
![Means of transportation to work]()
- 56.0%658Drove a car alone
- 5.1%60Carpooled
- 2.8%33Bus
- 8.9%104Subway or elevated rail
- 2.0%23Long-distance train or commuter rail
- 3.9%46Light rail, streetcar or trolley
- 1.4%16Taxi
- 2.0%23Motorcycle
- 0.5%6Bicycle
- 3.8%45Walked
- 3.3%39Other means
- 24.2%284Worked at home

Time leaving home to go to work
![Time leaving home to go to work]()
- 3612:00 a.m. to 4:59 a.m.
- 155:00 a.m. to 5:29 a.m.
- 735:30 a.m. to 5:59 a.m.
- 516:00 a.m. to 6:29 a.m.
- 526:30 a.m. to 6:59 a.m.
- 1347:00 a.m. to 7:29 a.m.
- 1387:30 a.m. to 7:59 a.m.
- 1498:00 a.m. to 8:29 a.m.
- 1148:30 a.m. to 8:59 a.m.
- 809:00 a.m. to 9:59 a.m.
- 2610:00 a.m. to 10:59 a.m.
- 2011:00 a.m. to 11:59 a.m.
- 4012:00 p.m. to 3:59 p.m.
- 194:00 p.m. to 11:59 p.m.

Occupations of males:
- Percentage of males in management occupations (except farmers):
Here: 21.1% city: 21.1%
- Percentage of males in business and financial operations occupations:
Here: 13.5% city: 8.6%
- Percentage of males in computer and mathematical occupations:
Here: 1.3% city: 7.1%
- Percentage of males in architecture and engineering occupations:
Here: 3.5% city: 4.9%
- Percentage of males in life, physical, and social science occupations:
Here: 12.1% city: 3.3%
- Percentage of males in community and social services occupations:
Here: 1.5% city: 1.3%
- Percentage of males in legal occupations:
Here: 6.2% city: 3.3%
- Percentage of males in education, training, and library occupations:
Here: 5.1% city: 3.4%
- Percentage of males in healthcare practitioners and technical occupations:
Here: 4.1% city: 3.1%
- Percentage of males in service occupations:
Here: 10.7% city: 12.7%
- Percentage of males in sales and office occupations:
Here: 14.6% city: 12.6%
- Percentage of males in construction, extraction, and maintenance occupations:
Here: 3.2% city: 6.1%
- Percentage of males in transportation occupations:
Here: 2.4% city: 3.9%
Occupations of females:
- Percentage of females in management occupations (except farmers):
Here: 13.4% city: 20.8%
- Percentage of females in business and financial operations occupations:
Here: 5.7% city: 10.1%
- Percentage of females in computer and mathematical occupations:
Here: 1.3% city: 4.3%
- Percentage of females in architecture and engineering occupations:
Here: 3.2% city: 2.4%
- Percentage of females in life, physical, and social science occupations:
Here: 2.0% city: 4.3%
- Percentage of females in legal occupations:
Here: 1.8% city: 3.4%
- Percentage of females in education, training, and library occupations:
Here: 8.9% city: 7.2%
- Percentage of females in arts, design, entertainment, sports, and media occupations:
Here: 5.8% city: 2.1%
- Percentage of females in healthcare practitioners and technical occupations:
Here: 14.5% city: 10.3%
- Percentage of females in service occupations:
Here: 10.6% city: 11.2%
- Percentage of females in sales and office occupations:
Here: 31.2% city: 19.2%
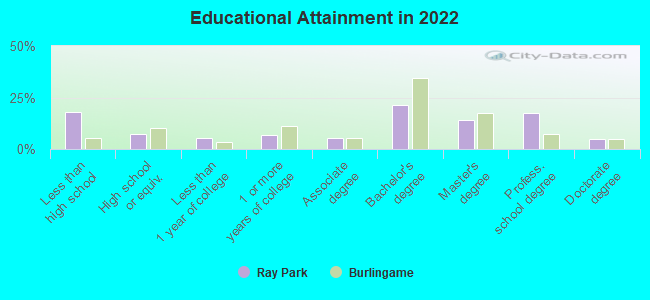
Education in this neighborhood (subdivision or community):
- Percentage of people 3 years and older in K-12 schools:
Ray Park: 32.1% Burlingame: 17.3%
- Percentage of people 3 years and older in undergraduate colleges:
Ray Park: 3.4% Burlingame: 4.6%
- Percentage of people 3 years and older in grad. or professional schools:
Ray Park: 1.4% Burlingame: 1.3%
- Percentage of students K-12 enrolled in private schools:
Ray Park: 30.7% Burlingame: 20.4%
Percentage of population below poverty level:
| Ray Park: | 2.6% |
| Burlingame: | 5.0% |
Median year owner moved in (as recorded in 2022):
| Ray Park: | 2003 |
| Burlingame: | 2002 |
Percentage of married-couple families with both working:
| Ray Park: | 69.1% |
| Burlingame: | 75.6% |
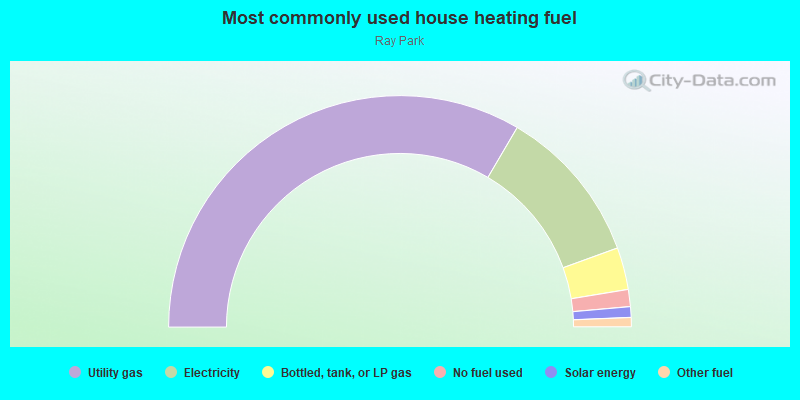
- 67.0%Utility gas
- 22.0%Electricity
- 5.9%Bottled, tank, or LP gas
- 2.4%No fuel used
- 1.5%Solar energy
- 1.3%Other fuel
Highways in this neighborhood:
State Hwy 82 (Mission St, el Camino Real)
Length: 0.69 miles
Direction: SE-NW
Address range: 1401 to 1598
Direction: SE-NW
Address range: 1401 to 1598
Roads and streets:
Ray Dr
Length: 0.64 miles
Directions: E-W, SE-NW, SW-NE
Address range: 1500 to 2399
Directions: E-W, SE-NW, SW-NE
Address range: 1500 to 2399
Davis Dr
Length: 0.48 miles
Directions: N-S, SW-NE
Address range: 1500 to 2299
Directions: N-S, SW-NE
Address range: 1500 to 2299
Bernal Ave
Length: 0.44 miles
Direction: SE-NW
Address range: 1400 to 1599
Direction: SE-NW
Address range: 1400 to 1599
Balboa Way
Length: 0.39 miles
Directions: E-W, SE-NW
Address range: 1522 to 1699
Directions: E-W, SE-NW
Address range: 1522 to 1699
Albemarle Way
Length: 0.38 miles
Direction: SE-NW
Address range: 1500 to 1799
Direction: SE-NW
Address range: 1500 to 1799
Drake Ave
Length: 0.38 miles
Direction: SE-NW
Address range: 1400 to 1599
Direction: SE-NW
Address range: 1400 to 1599
Devereaux Dr
Length: 0.34 miles
Directions: E-W, SE-NW, SW-NE
Address range: 1600 to 2099
Directions: E-W, SE-NW, SW-NE
Address range: 1600 to 2099
Adeline Dr
Length: 0.33 miles
Direction: SW-NE
Address range: 1500 to 1999
Direction: SW-NE
Address range: 1500 to 1999
Hillside Dr
Length: 0.32 miles
Direction: SW-NE
Address range: 1500 to 1999
Direction: SW-NE
Address range: 1500 to 1999
Balboa Ave
Length: 0.31 miles
Direction: SE-NW
Address range: 1400 to 1699
Direction: SE-NW
Address range: 1400 to 1699
Cabrillo Ave
Length: 0.30 miles
Direction: SE-NW
Address range: 1400 to 1599
Direction: SE-NW
Address range: 1400 to 1599
Cortez Ave
Length: 0.29 miles
Direction: SE-NW
Address range: 1400 to 1599
Direction: SE-NW
Address range: 1400 to 1599
Lassen Way
Length: 0.22 miles
Direction: SE-NW
Address range: 1600 to 1699
Direction: SE-NW
Address range: 1600 to 1699
Coronado Way
Length: 0.22 miles
Direction: SE-NW
Address range: 1600 to 1699
Direction: SE-NW
Address range: 1600 to 1699
Marco Polo Way
Length: 0.19 miles
Directions: E-W, SE-NW
Address range: 1600 to 1699
Directions: E-W, SE-NW
Address range: 1600 to 1699
Mc Donald Way
Length: 0.18 miles
Direction: SE-NW
Address range: 1600 to 1699
Direction: SE-NW
Address range: 1600 to 1699
Monte Corvino Way
Length: 0.15 miles
Directions: N-S, SE-NW
Address range: 1600 to 1699
Directions: N-S, SE-NW
Address range: 1600 to 1699
Highway Rd
Length: 0.15 miles
Directions: E-W, SE-NW
Address range: 1400 to 1599
Directions: E-W, SE-NW
Address range: 1400 to 1599
Quesada Way
Length: 0.12 miles
Directions: N-S, SE-NW
Address range: 1600 to 1699
Directions: N-S, SE-NW
Address range: 1600 to 1699
Davis Ct
Length: 0.03 miles
Directions: E-W, SW-NE
Address range: 1 to 99
Directions: E-W, SW-NE
Address range: 1 to 99
Ray Ct
Length: 0.03 miles
Direction: N-S
Address range: 1 to 99
Direction: N-S
Address range: 1 to 99
Other features:
Mills Crk
Length: 0.47 miles
Directions: E-W, N-S, SW-NE
Directions: E-W, N-S, SW-NE