Rancho Sereno neighborhood in Las Vegas, Nevada (NV), 89102 detailed profile
Settings
X


Business Search - 14 Million verified businesses
Area: 0.045 square miles
Population: 245
Population density:
| Rancho Sereno: | 5,488 people per square mile |
| Las Vegas: | 5,792 people per square mile |

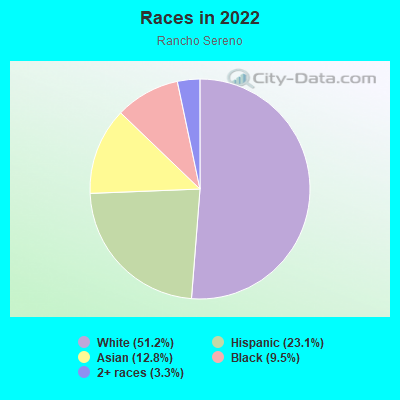
- 12451.2%White
- 5623.1%Hispanic or Latino
- 3112.8%Asian
- 239.5%Black
- 83.3%Two or more races
Median household income in 2022:
| Rancho Sereno: | $74,688 |
| Las Vegas: | $68,905 |
Distribution of median household income
![Distribution of median household income]()
- 7Less than $10,000
- 3$10,000 to $19,999
- 12$20,000 to $29,999
- 11$30,000 to $39,999
- 10$40,000 to $49,999
- 9$50,000 to $59,999
- 8$60,000 to $74,999
- 20$75,000 to $99,999
- 13$100,000 to $124,999
- 9$125,000 to $149,999
- 12$150,000 to $199,999
- 3$200,000 or more

Distribution of owner-occupied house/condo value
![Distribution of owner-occupied house/condo value]()
- 4Less than $50,000
- 2$150,000 to $199,999
- 2$200,000 to $249,999
- 4$250,000 to $299,999
- 15$300,000 to $399,999
- 12$400,000 to $499,999
- 17$500,000 to $749,999
- 3$750,000 to $999,999

Distribution of rent paid by renters
![Distribution of rent paid by renters]()
- 6$700 to $799
- 5$800 to $899
- 10$900 to $999
- 24$1,000 to $1,249
- 8$1,250 to $1,499
- 2$2,000 or more

Median rent in 2022:
| Rancho Sereno: | $1,070 |
| Las Vegas: | $1,277 |
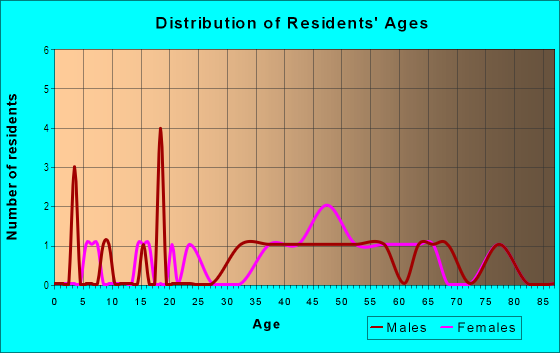
| Males: | 133 |
| Females: | 112 |
Males:
| This neighborhood: | 31.4 years |
| Whole city: | 38.4 years |
| This neighborhood: | 44.1 years |
| Whole city: | 38.9 years |
Average household size:
| Rancho Sereno: | 2.3 people |
| Las Vegas: | 2.7 people |
Percentage of family households:
| Rancho Sereno: | 45.3% |
| Las Vegas: | 45.8% |
| Here: | 43.4% |
| Las Vegas: | 40.9% |
Percentage of married-couple families with children (among all households):
| Rancho Sereno: | 32.2% |
| Las Vegas: | 23.4% |
Percentage of single-mother households (among all households):
| Rancho Sereno: | 3.7% |
| Las Vegas: | 10.1% |
Percentage of never married males 15 years old and over:
Percentage of never married females 15 years old and over:
| Rancho Sereno: | 21.1% |
| Las Vegas: | 19.7% |
Percentage of never married females 15 years old and over:
| Rancho Sereno: | 8.6% |
| city: | 17.0% |
Percentage of people that speak English not well or not at all:
| Rancho Sereno: | 0.4% |
| Las Vegas: | 7.0% |
Percentage of people born in this state:
Percentage of people born in another U.S. state:
Percentage of native residents but born outside the U.S.:
Percentage of foreign born residents:
| Here: | 22.0% |
| Las Vegas: | 27.3% |
Percentage of people born in another U.S. state:
| Rancho Sereno: | 60.8% |
| Las Vegas: | 49.8% |
Percentage of native residents but born outside the U.S.:
| Here: | 1.8% |
| city: | 1.9% |
Percentage of foreign born residents:
| Here: | 15.4% |
| Las Vegas: | 21.0% |
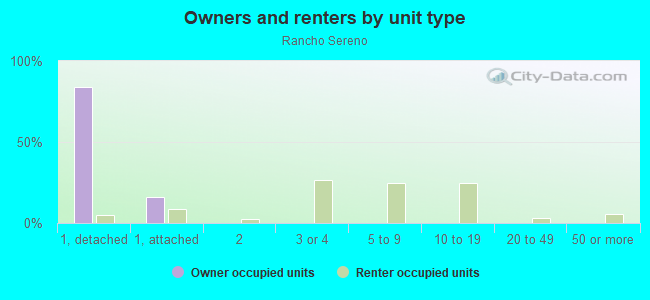
Owner-occupied
Renter-occupied

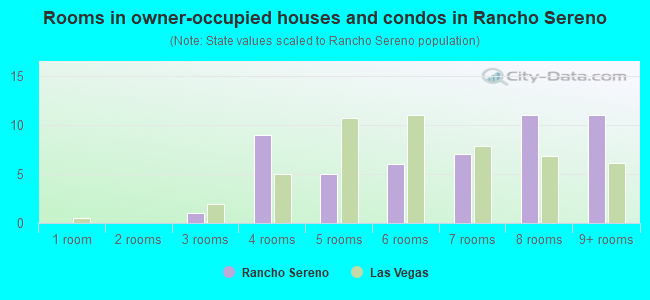
- Rooms in owner-occupied houses and condos in Rancho Sereno
- 01 room
- 02 rooms
- 13 rooms
- 94 rooms
- 55 rooms
- 66 rooms
- 77 rooms
- 118 rooms
- 119+ rooms
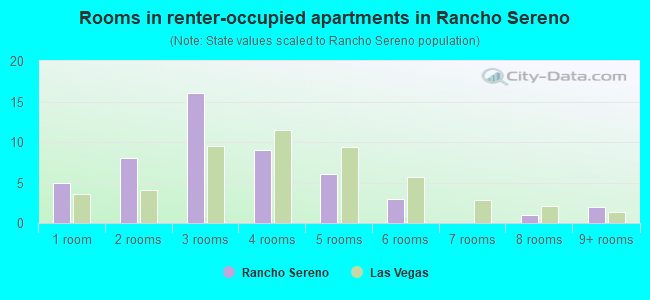
- Rooms in renter-occupied apartments in Rancho Sereno
- 51 room
- 82 rooms
- 163 rooms
- 94 rooms
- 65 rooms
- 36 rooms
- 07 rooms
- 18 rooms
- 29+ rooms
Owner-occupied
Renter-occupied
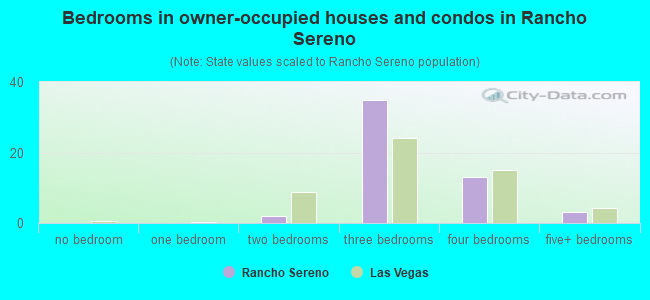
- Bedrooms in owner-occupied houses and condos in Rancho Sereno
- 0no bedroom
- 01 bedroom
- 22 bedrooms
- 353 bedrooms
- 134 bedrooms
- 35+ bedrooms
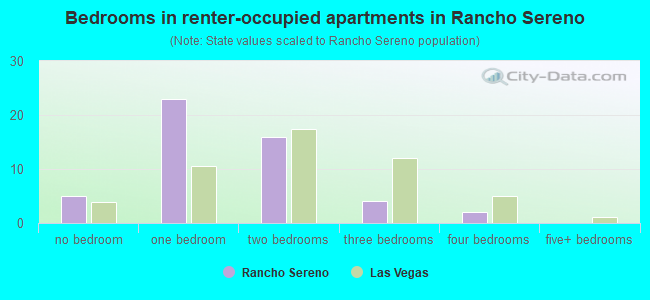
- Bedrooms in renter-occupied apartments in Rancho Sereno
- 5no bedroom
- 231 bedroom
- 162 bedrooms
- 43 bedrooms
- 24 bedrooms
- 05+ bedrooms
Average number of cars or other vehicles available in houses/condos:
Average number of cars or other vehicles available in apartments:
| This neighborhood: | 1.9 |
| Las Vegas: | 2.0 |
Average number of cars or other vehicles available in apartments:
| Here: | 1.0 |
| city: | 1.3 |
Percentage of units with a mortgage:
| Rancho Sereno: | 79.6% |
| Las Vegas: | 69.3% |
Housing prices:
- Average estimated value of detached houses in 2022 (44.0% of all units):
Rancho Sereno: $442,598 Nevada: $549,327
- Average estimated value of townhouses or other attached units in 2022 (12.8% of all units):
This neighborhood: $269,472 Nevada: $328,893
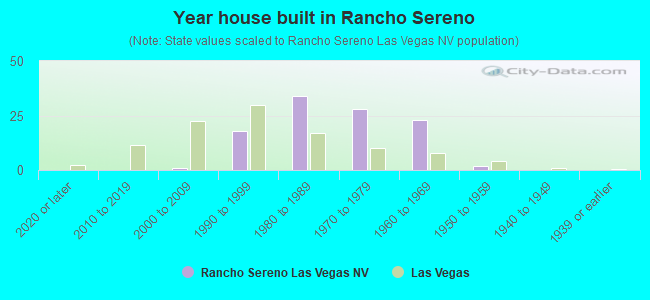
- Year house built in Rancho Sereno
- 02020 or later
- 02010 to 2019
- 12000 to 2009
- 181990 to 1999
- 341980 to 1989
- 281970 to 1979
- 231960 to 1969
- 21950 to 1959
- 01940 to 1949
- 01939 or earlier
City-data.com crime index for city in 2020 (higher means more crime):
| City: | 280.7 |
| U.S. average: | 219.5 |
Travel time to work (commute)
![Travel time to work (commute)]()
- 105 to 9 minutes
- 2210 to 14 minutes
- 3015 to 19 minutes
- 1520 to 24 minutes
- 325 to 29 minutes
- 830 to 34 minutes

Means of transportation to work
![Means of transportation to work]()
- 61.8%74Drove a car alone
- 20.9%25Carpooled
- 3.3%4Bicycle
- 2.5%3Other means
- 10.0%12Worked at home

Time leaving home to go to work
![Time leaving home to go to work]()
- 25:00 a.m. to 5:29 a.m.
- 65:30 a.m. to 5:59 a.m.
- 86:00 a.m. to 6:29 a.m.
- 106:30 a.m. to 6:59 a.m.
- 127:00 a.m. to 7:29 a.m.
- 117:30 a.m. to 7:59 a.m.
- 38:00 a.m. to 8:29 a.m.
- 98:30 a.m. to 8:59 a.m.
- 119:00 a.m. to 9:59 a.m.
- 210:00 a.m. to 10:59 a.m.
- 512:00 p.m. to 3:59 p.m.
- 64:00 p.m. to 11:59 p.m.

Occupations of males:
- Percentage of males in management occupations (except farmers):
Here: 7.2% city: 9.6%
- Percentage of males in business and financial operations occupations:
Here: 1.3% city: 3.6%
- Percentage of males in computer and mathematical occupations:
Here: 2.8% city: 3.4%
- Percentage of males in architecture and engineering occupations:
Here: 1.1% city: 1.8%
- Percentage of males in community and social services occupations:
Here: 1.5% city: 0.7%
- Percentage of males in legal occupations:
Here: 2.3% city: 0.9%
- Percentage of males in education, training, and library occupations:
Here: 14.9% city: 2.5%
- Percentage of males in healthcare practitioners and technical occupations:
Here: 3.0% city: 3.3%
- Percentage of males in service occupations:
Here: 29.6% city: 23.3%
- Percentage of males in sales and office occupations:
Here: 11.8% city: 16.6%
- Percentage of males in construction, extraction, and maintenance occupations:
Here: 11.9% city: 10.6%
- Percentage of males in transportation occupations:
Here: 2.2% city: 6.6%
- Percentage of males in material moving occupations:
Here: 9.2% city: 5.4%
Occupations of females:
- Percentage of females in management occupations (except farmers):
Here: 6.1% city: 8.5%
- Percentage of females in business and financial operations occupations:
Here: 4.2% city: 5.7%
- Percentage of females in computer and mathematical occupations:
Here: 3.2% city: 1.1%
- Percentage of females in architecture and engineering occupations:
Here: 1.1% city: 0.4%
- Percentage of females in community and social services occupations:
Here: 4.9% city: 1.9%
- Percentage of females in legal occupations:
Here: 7.8% city: 1.5%
- Percentage of females in education, training, and library occupations:
Here: 12.1% city: 8.0%
- Percentage of females in arts, design, entertainment, sports, and media occupations:
Here: 2.3% city: 1.8%
- Percentage of females in healthcare practitioners and technical occupations:
Here: 7.8% city: 7.4%
- Percentage of females in service occupations:
Here: 17.3% city: 26.5%
- Percentage of females in sales and office occupations:
Here: 28.3% city: 30.5%
- Percentage of females in production occupations:
Here: 6.1% city: 1.8%
Percentage of people 16-64 in Armed Forces:
| Rancho Sereno: | 0.2% |
| Las Vegas: | 1.0% |
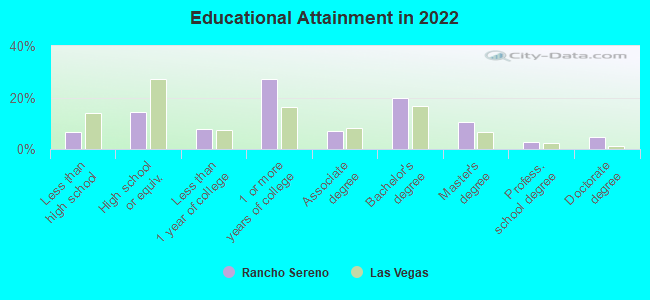
Education in this neighborhood (subdivision or community):
- Percentage of people 3 years and older in K-12 schools:
Rancho Sereno: 12.8% Las Vegas: 17.4%
- Percentage of people 3 years and older in undergraduate colleges:
Rancho Sereno: 3.8% Las Vegas: 4.2%
- Percentage of people 3 years and older in grad. or professional schools:
Rancho Sereno: 2.1% Las Vegas: 1.0%
- Percentage of students K-12 enrolled in private schools:
Rancho Sereno: 23.3% Las Vegas: 12.9%
Percentage of population below poverty level:
| Rancho Sereno: | 7.5% |
| Las Vegas: | 14.1% |
Median year owner moved in (as recorded in 2022):
Median year renter moved in (as recorded in 2022):
| Rancho Sereno: | 2006 |
| Las Vegas: | 2015 |
Median year renter moved in (as recorded in 2022):
| Rancho Sereno: | 2017 |
| Las Vegas: | 2020 |
Percentage of married-couple families with both working:
| Rancho Sereno: | 45.9% |
| Las Vegas: | 62.0% |
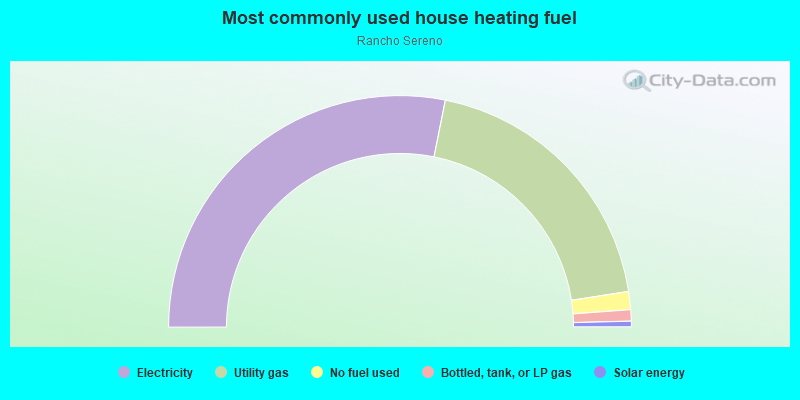
- 56.3%Electricity
- 38.8%Utility gas
- 2.5%No fuel used
- 1.6%Bottled, tank, or LP gas
- 0.8%Solar energy
Roads and streets:
Sidonia Ave
Length: 0.31 miles
Direction: E-W
Address range: 2500 to 2799
Direction: E-W
Address range: 2500 to 2799
de Osma St
Length: 0.21 miles
Directions: N-S, SW-NE
Address range: 1900 to 2299
Directions: N-S, SW-NE
Address range: 1900 to 2299
Lourdes Ave
Length: 0.19 miles
Directions: E-W, SW-NE
Address range: 2400 to 2699
Directions: E-W, SW-NE
Address range: 2400 to 2699
Miraflores Ave
Length: 0.12 miles
Direction: E-W
Address range: 2700 to 2799
Direction: E-W
Address range: 2700 to 2799
Pso del Prado
Length: 0.08 miles
Direction: N-S
Address range: 2200 to 2299
Direction: N-S
Address range: 2200 to 2299
el Cortez Ave
Length: 0.06 miles
Directions: E-W, SW-NE
Address range: 2400 to 2499
Directions: E-W, SW-NE
Address range: 2400 to 2499
Tarraso Way
Length: 0.05 miles
Directions: N-S, SE-NW, SW-NE
Address range: 2200 to 2299
Directions: N-S, SE-NW, SW-NE
Address range: 2200 to 2299
Alia Ct
Length: 0.02 miles
Direction: N-S
Address range: 2200 to 2299
Direction: N-S
Address range: 2200 to 2299
Naco Ct
Length: 0.02 miles
Direction: N-S
Address range: 2100 to 2199
Direction: N-S
Address range: 2100 to 2199