Ranchland Hills neighborhood in Midland, Texas (TX), 79705 detailed profile
Settings
X


Business Search - 14 Million verified businesses
Area: 0.188 square miles
Population: 694
Population density:
| Ranchland Hills: | 3,699 people per square mile |
| Midland: | 2,018 people per square mile |

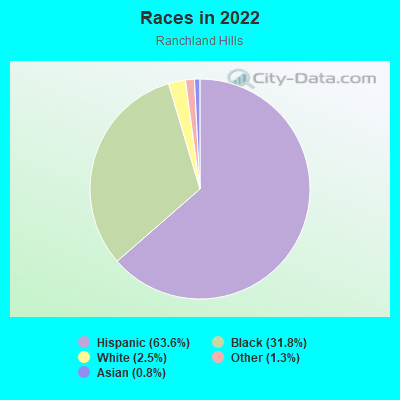
- 45063.6%Hispanic or Latino
- 22531.8%Black
- 182.5%White
- 91.3%Some other race
- 60.8%Asian
Distribution of median household income
![Distribution of median household income]()
- 7Less than $10,000
- 58$10,000 to $19,999
- 17$20,000 to $29,999
- 29$30,000 to $39,999
- 37$40,000 to $49,999
- 12$50,000 to $59,999
- 2$60,000 to $74,999
- 66$75,000 to $99,999
- 65$100,000 to $124,999
- 11$125,000 to $149,999
- 39$150,000 to $199,999
- 13$200,000 or more

Distribution of owner-occupied house/condo value
![Distribution of owner-occupied house/condo value]()
- 34Less than $50,000
- 45$50,000 to $99,999
- 111$100,000 to $149,999
- 74$150,000 to $199,999
- 50$200,000 to $249,999
- 14$250,000 to $299,999
- 12$300,000 to $399,999
- 13$750,000 to $999,999
- 4$1,000,000 or more

Distribution of rent paid by renters
![Distribution of rent paid by renters]()
- 45$100 to $199
- 8$300 to $399
- 25$400 to $499
- 27$600 to $699
- 9$700 to $799
- 11$800 to $899
- 5$900 to $999
- 9$1,000 to $1,249
- 24$1,250 to $1,499
- 25$1,500 to $1,999
- 44$2,000 or more

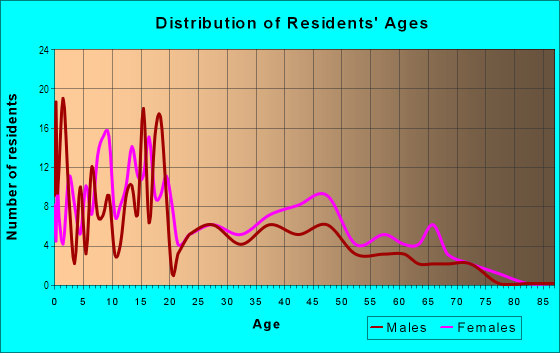
| Males: | 277 |
| Females: | 416 |
Males:
| This neighborhood: | 32.7 years |
| Whole city: | 32.3 years |
| This neighborhood: | 31.5 years |
| Whole city: | 33.3 years |
Average household size:
| Ranchland Hills: | 2.7 people |
| Midland: | 2.4 people |
Percentage of family households:
| Ranchland Hills: | 52.8% |
| Midland: | 52.0% |
| Here: | 39.9% |
| Midland: | 46.4% |
Percentage of married-couple families with children (among all households):
| Ranchland Hills: | 33.3% |
| Midland: | 30.9% |
Percentage of single-mother households (among all households):
| Ranchland Hills: | 2.3% |
| Midland: | 8.1% |
Percentage of never married males 15 years old and over:
Percentage of never married females 15 years old and over:
| Ranchland Hills: | 3.5% |
| Midland: | 15.2% |
Percentage of never married females 15 years old and over:
| Ranchland Hills: | 12.5% |
| city: | 14.9% |
Percentage of people that speak English not well or not at all:
| Ranchland Hills: | 0.6% |
| Midland: | 5.7% |
Percentage of people born in this state:
Percentage of people born in another U.S. state:
Percentage of native residents but born outside the U.S.:
Percentage of foreign born residents:
| Here: | 74.2% |
| Midland: | 69.5% |
Percentage of people born in another U.S. state:
| Ranchland Hills: | 13.9% |
| Midland: | 18.2% |
Percentage of native residents but born outside the U.S.:
| Here: | 0.4% |
| city: | 1.2% |
Percentage of foreign born residents:
| Here: | 11.5% |
| Midland: | 11.2% |
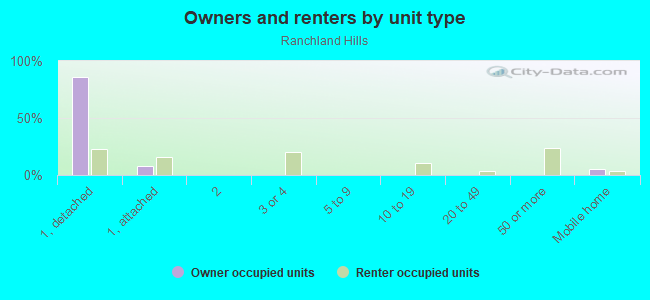
Owner-occupied
Renter-occupied

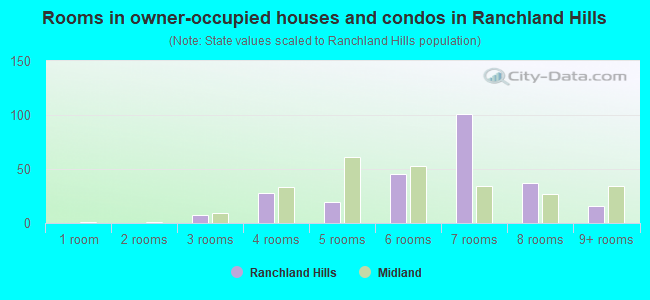
- Rooms in owner-occupied houses and condos in Ranchland Hills
- 01 room
- 02 rooms
- 73 rooms
- 284 rooms
- 195 rooms
- 456 rooms
- 1017 rooms
- 378 rooms
- 169+ rooms
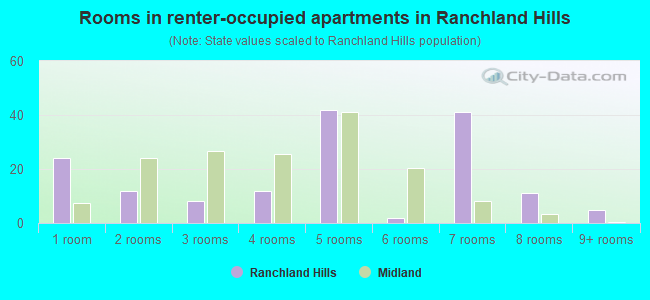
- Rooms in renter-occupied apartments in Ranchland Hills
- 241 room
- 122 rooms
- 83 rooms
- 124 rooms
- 425 rooms
- 26 rooms
- 417 rooms
- 118 rooms
- 59+ rooms
Owner-occupied
Renter-occupied
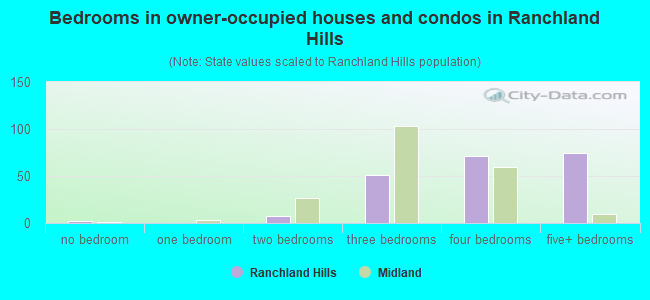
- Bedrooms in owner-occupied houses and condos in Ranchland Hills
- 2no bedroom
- 01 bedroom
- 72 bedrooms
- 513 bedrooms
- 714 bedrooms
- 745+ bedrooms
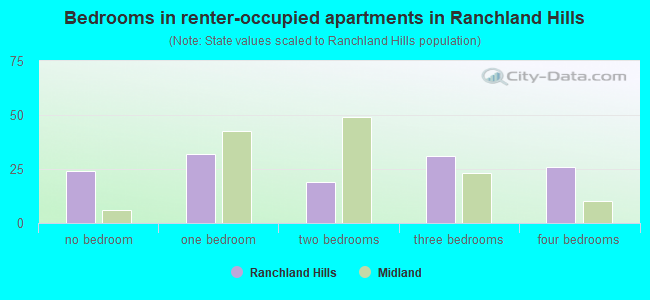
- Bedrooms in renter-occupied apartments in Ranchland Hills
- 24no bedroom
- 321 bedroom
- 192 bedrooms
- 313 bedrooms
- 264 bedrooms
- 05+ bedrooms
Average number of cars or other vehicles available in houses/condos:
Average number of cars or other vehicles available in apartments:
| This neighborhood: | 3.4 |
| Midland: | 2.1 |
Average number of cars or other vehicles available in apartments:
| Here: | 2.2 |
| city: | 1.4 |
Percentage of units with a mortgage:
| Ranchland Hills: | 21.2% |
| Midland: | 58.2% |
Average estimated value of detached houses in 2022 (100.0% of all units):
| Ranchland Hills: | $146,584 |
| Texas: | $369,058 |
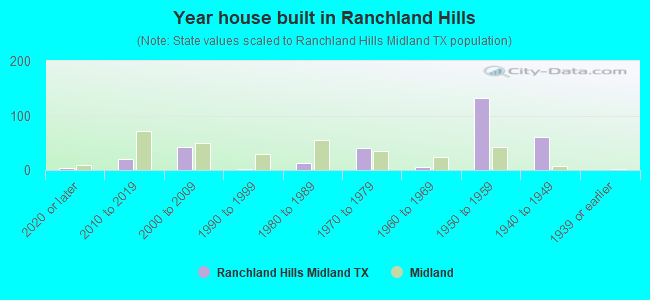
- Year house built in Ranchland Hills
- 42020 or later
- 212010 to 2019
- 432000 to 2009
- 21990 to 1999
- 121980 to 1989
- 411970 to 1979
- 61960 to 1969
- 1321950 to 1959
- 611940 to 1949
- 01939 or earlier
City-data.com crime index for city in 2020 (higher means more crime):
| City: | 223.8 |
| U.S. average: | 219.5 |
Travel time to work (commute)
![Travel time to work (commute)]()
- 26Less than 5 minutes
- 785 to 9 minutes
- 8010 to 14 minutes
- 9415 to 19 minutes
- 1720 to 24 minutes
- 1025 to 29 minutes
- 8030 to 34 minutes
- 2735 to 39 minutes
- 640 to 44 minutes
- 3445 to 59 minutes
- 1060 to 89 minutes
- 3190 or more minutes

Means of transportation to work
![Means of transportation to work]()
- 99.5%298Drove a car alone
- 7.3%22Carpooled
- 2.3%7Walked
- 7.0%21Other means
- 2.3%7Worked at home

Time leaving home to go to work
![Time leaving home to go to work]()
- 3612:00 a.m. to 4:59 a.m.
- 435:00 a.m. to 5:29 a.m.
- 426:00 a.m. to 6:29 a.m.
- 766:30 a.m. to 6:59 a.m.
- 677:00 a.m. to 7:29 a.m.
- 747:30 a.m. to 7:59 a.m.
- 108:00 a.m. to 8:29 a.m.
- 348:30 a.m. to 8:59 a.m.
- 369:00 a.m. to 9:59 a.m.
- 1010:00 a.m. to 10:59 a.m.
- 3511:00 a.m. to 11:59 a.m.
- 1312:00 p.m. to 3:59 p.m.
- 104:00 p.m. to 11:59 p.m.

Occupations of males:
- Percentage of males in business and financial operations occupations:
Here: 6.0% city: 3.8%
- Percentage of males in legal occupations:
Here: 1.3% city: 1.2%
- Percentage of males in education, training, and library occupations:
Here: 7.8% city: 2.5%
- Percentage of males in healthcare practitioners and technical occupations:
Here: 13.8% city: 1.2%
- Percentage of males in service occupations:
Here: 1.1% city: 9.5%
- Percentage of males in sales and office occupations:
Here: 11.3% city: 14.8%
- Percentage of males in production occupations:
Here: 19.7% city: 7.5%
- Percentage of males in transportation occupations:
Here: 34.6% city: 5.1%
Occupations of females:
- Percentage of females in life, physical, and social science occupations:
Here: 1.3% city: 0.8%
- Percentage of females in education, training, and library occupations:
Here: 15.4% city: 11.2%
- Percentage of females in service occupations:
Here: 13.8% city: 16.8%
- Percentage of females in sales and office occupations:
Here: 33.1% city: 33.2%
- Percentage of females in production occupations:
Here: 37.4% city: 2.0%
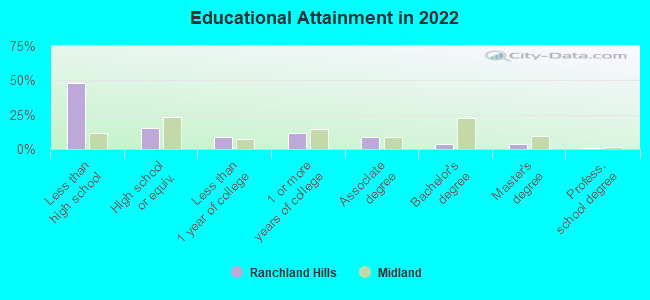
Education in this neighborhood (subdivision or community):
- Percentage of people 3 years and older in K-12 schools:
Ranchland Hills: 34.6% Midland: 22.4%
- Percentage of people 3 years and older in undergraduate colleges:
Ranchland Hills: 5.4% Midland: 3.0%
- Percentage of people 3 years and older in grad. or professional schools:
Ranchland Hills: 0.0% Midland: 1.8%
- Percentage of students K-12 enrolled in private schools:
Ranchland Hills: 31.4% Midland: 16.2%
Percentage of population below poverty level:
| Ranchland Hills: | 14.1% |
| Midland: | 11.7% |
Median year owner moved in (as recorded in 2022):
| Ranchland Hills: | 2007 |
| Midland: | 2015 |
Percentage of married-couple families with both working:
| Ranchland Hills: | 157.5% |
| Midland: | 63.2% |
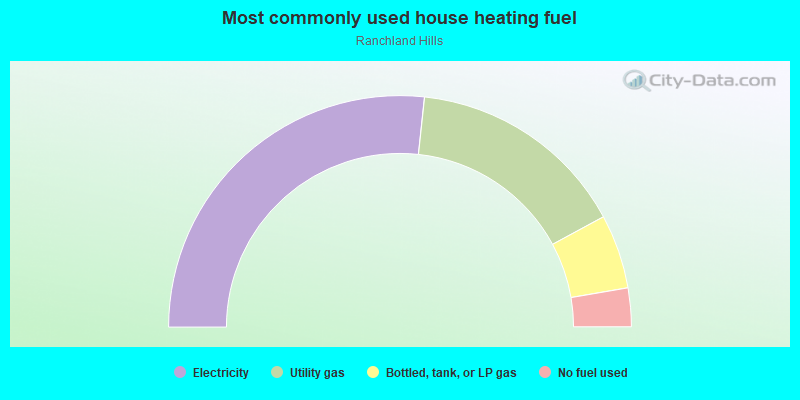
- 53.4%Electricity
- 30.8%Utility gas
- 10.4%Bottled, tank, or LP gas
- 5.4%No fuel used
Roads and streets:
E Pecan Ave
Length: 0.41 miles
Direction: E-W
Address range: 1600 to 1799
Direction: E-W
Address range: 1600 to 1799
N Benton St
Length: 0.41 miles
Directions: N-S, SE-NW
Address range: 2108 to 2699
Directions: N-S, SE-NW
Address range: 2108 to 2699
Peterson St
Length: 0.32 miles
Directions: N-S, SE-NW
Address range: 2200 to 2609
Directions: N-S, SE-NW
Address range: 2200 to 2609
E Pine Ave
Length: 0.25 miles
Direction: E-W
Address range: 1700 to 1799
Direction: E-W
Address range: 1700 to 1799
E Scharbauer Dr
Length: 0.22 miles
Direction: E-W
Address range: 1633 to 1781
Direction: E-W
Address range: 1633 to 1781
E Oak Ave
Length: 0.22 miles
Direction: E-W
Address range: 1700 to 1799
Direction: E-W
Address range: 1700 to 1799
E Maple Ave
Length: 0.22 miles
Direction: E-W
Address range: 1700 to 1799
Direction: E-W
Address range: 1700 to 1799
E Magnolia Ave
Length: 0.21 miles
Directions: E-W, SW-NE
Address range: 1700 to 1799
Directions: E-W, SW-NE
Address range: 1700 to 1799