Rana neighborhood in San Bernardino, California (CA), 92324 detailed profile
Settings
X


Business Search - 14 Million verified businesses
Area: 0.126 square miles
Population: 35,250
Population density:
| Rana: | 279,017 people per square mile |
| San Bernardino: | 3,746 people per square mile |

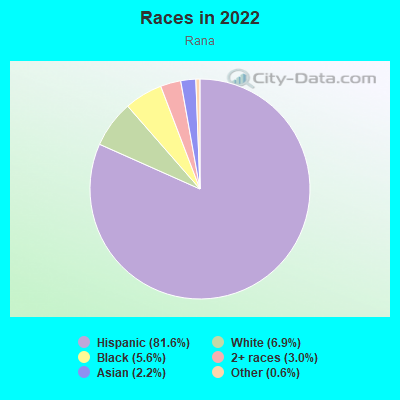
- 31,25581.6%Hispanic or Latino
- 2,6436.9%White
- 2,1315.6%Black
- 1,1673.0%Two or more races
- 8412.2%Asian
- 2480.6%Some other race
Median household income in 2022:
| Rana: | $56,426 |
| San Bernardino: | $62,801 |
Distribution of median household income
![Distribution of median household income]()
- 900Less than $10,000
- 3,030$10,000 to $19,999
- 1,216$20,000 to $29,999
- 1,402$30,000 to $39,999
- 2,082$40,000 to $49,999
- 810$50,000 to $59,999
- 1,321$60,000 to $74,999
- 836$75,000 to $99,999
- 956$100,000 to $124,999
- 897$125,000 to $149,999
- 854$150,000 to $199,999
- 217$200,000 or more

Distribution of owner-occupied house/condo value
![Distribution of owner-occupied house/condo value]()
- 1,066Less than $50,000
- 1,192$50,000 to $99,999
- 773$100,000 to $149,999
- 282$150,000 to $199,999
- 1,113$200,000 to $249,999
- 597$250,000 to $299,999
- 934$300,000 to $399,999
- 1,259$400,000 to $499,999
- 896$500,000 to $749,999
- 145$750,000 to $999,999

Distribution of rent paid by renters
![Distribution of rent paid by renters]()
- 620$300 to $399
- 958$400 to $499
- 1,134$600 to $699
- 1,049$700 to $799
- 356$800 to $899
- 1,266$900 to $999
- 1,940$1,000 to $1,249
- 1,400$1,250 to $1,499
- 876$1,500 to $1,999
- 1,385$2,000 or more

Median rent in 2022:
| Rana: | $1,265 |
| San Bernardino: | $1,172 |
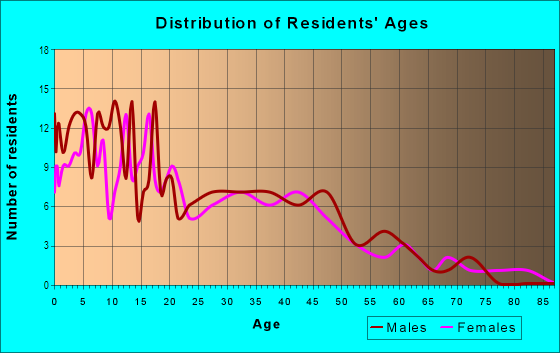
| Males: | 17,223 |
| Females: | 18,027 |
Males:
| This neighborhood: | 29.7 years |
| Whole city: | 31.7 years |
| This neighborhood: | 31.5 years |
| Whole city: | 32.5 years |
Average household size:
| Rana: | 3.2 people |
| San Bernardino: | 3.3 people |
Percentage of family households:
| Rana: | 53.2% |
| San Bernardino: | 56.8% |
| Here: | 42.1% |
| San Bernardino: | 43.4% |
Percentage of married-couple families with children (among all households):
| Rana: | 13.0% |
| San Bernardino: | 16.8% |
Percentage of single-mother households (among all households):
| Rana: | 16.5% |
| San Bernardino: | 9.3% |
Percentage of never married males 15 years old and over:
Percentage of never married females 15 years old and over:
| Rana: | 19.8% |
| San Bernardino: | 24.3% |
Percentage of never married females 15 years old and over:
| Rana: | 18.7% |
| city: | 23.1% |
Percentage of people that speak English not well or not at all:
| Rana: | 12.1% |
| San Bernardino: | 9.9% |
Percentage of people born in this state:
Percentage of people born in another U.S. state:
Percentage of native residents but born outside the U.S.:
Percentage of foreign born residents:
| Here: | 66.0% |
| San Bernardino: | 68.5% |
Percentage of people born in another U.S. state:
| Rana: | 3.0% |
| San Bernardino: | 8.1% |
Percentage of native residents but born outside the U.S.:
| Here: | 0.5% |
| city: | 1.1% |
Percentage of foreign born residents:
| Here: | 30.4% |
| San Bernardino: | 22.3% |
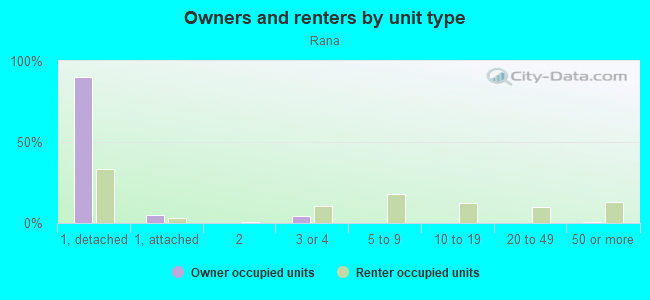
Owner-occupied
Renter-occupied

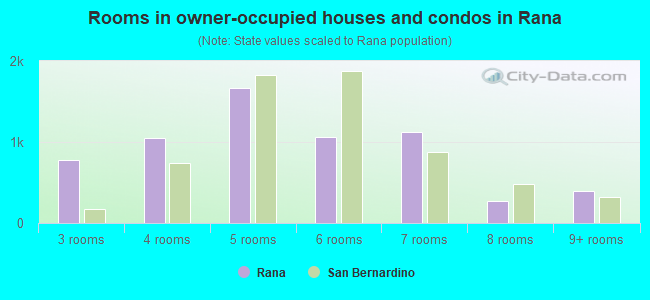
- Rooms in owner-occupied houses and condos in Rana
- 01 room
- 02 rooms
- 7723 rooms
- 1,0494 rooms
- 1,6615 rooms
- 1,0586 rooms
- 1,1197 rooms
- 2698 rooms
- 3899+ rooms
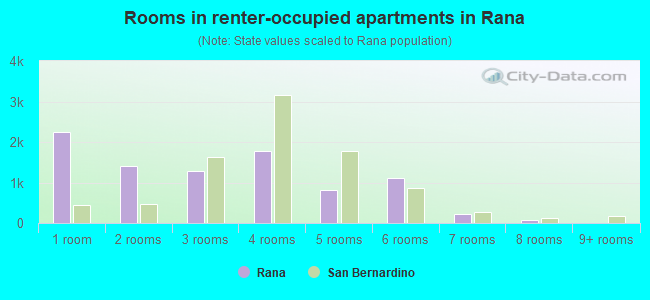
- Rooms in renter-occupied apartments in Rana
- 2,2521 room
- 1,4122 rooms
- 1,2923 rooms
- 1,7694 rooms
- 8075 rooms
- 1,1026 rooms
- 2207 rooms
- 668 rooms
- 09+ rooms
Owner-occupied
Renter-occupied
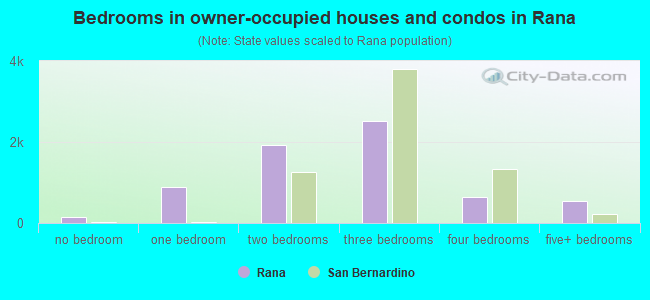
- Bedrooms in owner-occupied houses and condos in Rana
- 144no bedroom
- 8811 bedroom
- 1,9362 bedrooms
- 2,5243 bedrooms
- 6514 bedrooms
- 5315+ bedrooms
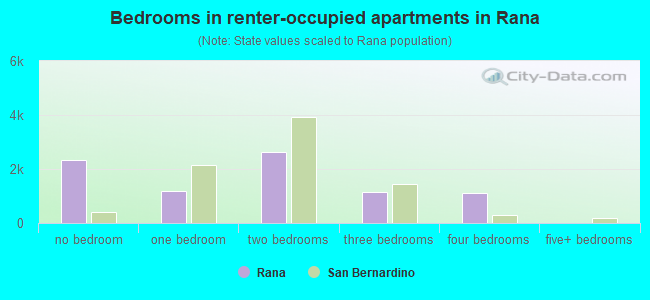
- Bedrooms in renter-occupied apartments in Rana
- 2,317no bedroom
- 1,1951 bedroom
- 2,6322 bedrooms
- 1,1603 bedrooms
- 1,1234 bedrooms
- 05+ bedrooms
Average number of cars or other vehicles available in houses/condos:
Average number of cars or other vehicles available in apartments:
| This neighborhood: | 2.2 |
| San Bernardino: | 2.5 |
Average number of cars or other vehicles available in apartments:
| Here: | 2.0 |
| city: | 1.6 |
Percentage of units with a mortgage:
| Rana: | 87.8% |
| San Bernardino: | 62.7% |
Average estimated value of detached houses in 2022 (79.2% of all units):
| Rana: | $327,933 |
| San Bernardino: | $387,676 |
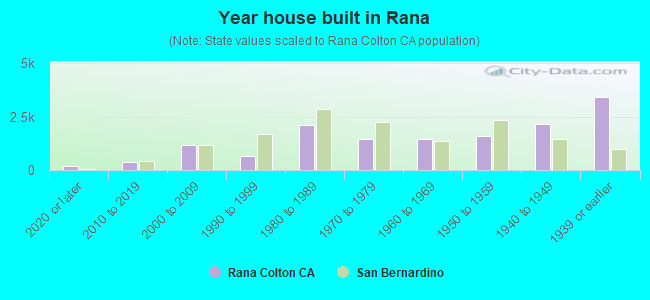
- Year house built in Rana
- 1852020 or later
- 3562010 to 2019
- 1,1632000 to 2009
- 6661990 to 1999
- 2,1191980 to 1989
- 1,4511970 to 1979
- 1,4281960 to 1969
- 1,5781950 to 1959
- 2,1691940 to 1949
- 3,3961939 or earlier
City-data.com crime index for city in 2020 (higher means more crime):
| City: | 568.1 |
| U.S. average: | 219.5 |
Travel time to work (commute)
![Travel time to work (commute)]()
- 844Less than 5 minutes
- 1,5175 to 9 minutes
- 2,81410 to 14 minutes
- 4,00315 to 19 minutes
- 1,76820 to 24 minutes
- 56725 to 29 minutes
- 1,14930 to 34 minutes
- 23835 to 39 minutes
- 23240 to 44 minutes
- 36445 to 59 minutes
- 67460 to 89 minutes
- 74690 or more minutes

Means of transportation to work
![Means of transportation to work]()
- 80.9%11,652Drove a car alone
- 14.3%2,060Carpooled
- 2.6%377Bus
- 2.4%348Long-distance train or commuter rail
- 3.1%440Taxi
- 0.8%119Walked
- 6.2%890Other means
- 3.2%463Worked at home

Time leaving home to go to work
![Time leaving home to go to work]()
- 2,45412:00 a.m. to 4:59 a.m.
- 1,4145:00 a.m. to 5:29 a.m.
- 5435:30 a.m. to 5:59 a.m.
- 8106:00 a.m. to 6:29 a.m.
- 1,2586:30 a.m. to 6:59 a.m.
- 9857:00 a.m. to 7:29 a.m.
- 7197:30 a.m. to 7:59 a.m.
- 1,6458:00 a.m. to 8:29 a.m.
- 1918:30 a.m. to 8:59 a.m.
- 8319:00 a.m. to 9:59 a.m.
- 50610:00 a.m. to 10:59 a.m.
- 34211:00 a.m. to 11:59 a.m.
- 1,44412:00 p.m. to 3:59 p.m.
- 1,5224:00 p.m. to 11:59 p.m.

Occupations of males:
- Percentage of males in management occupations (except farmers):
Here: 2.7% city: 4.9%
- Percentage of males in business and financial operations occupations:
Here: 2.0% city: 2.3%
- Percentage of males in computer and mathematical occupations:
Here: 1.7% city: 1.4%
- Percentage of males in education, training, and library occupations:
Here: 1.6% city: 2.4%
- Percentage of males in arts, design, entertainment, sports, and media occupations:
Here: 1.0% city: 1.7%
- Percentage of males in healthcare practitioners and technical occupations:
Here: 5.3% city: 1.5%
- Percentage of males in service occupations:
Here: 16.8% city: 15.6%
- Percentage of males in sales and office occupations:
Here: 9.0% city: 11.9%
- Percentage of males in construction, extraction, and maintenance occupations:
Here: 19.2% city: 15.2%
- Percentage of males in production occupations:
Here: 18.4% city: 8.1%
- Percentage of males in transportation occupations:
Here: 5.3% city: 8.9%
- Percentage of males in material moving occupations:
Here: 10.7% city: 15.8%
Occupations of females:
- Percentage of females in management occupations (except farmers):
Here: 2.4% city: 6.2%
- Percentage of females in business and financial operations occupations:
Here: 2.4% city: 3.2%
- Percentage of females in healthcare practitioners and technical occupations:
Here: 3.3% city: 6.0%
- Percentage of females in service occupations:
Here: 45.1% city: 26.5%
- Percentage of females in sales and office occupations:
Here: 28.2% city: 28.8%
- Percentage of females in production occupations:
Here: 13.3% city: 5.6%
- Percentage of females in transportation occupations:
Here: 2.2% city: 1.8%
- Percentage of females in material moving occupations:
Here: 1.6% city: 9.9%
Percentage of people 16-64 in Armed Forces:
| Rana: | 0.1% |
| San Bernardino: | 0.4% |
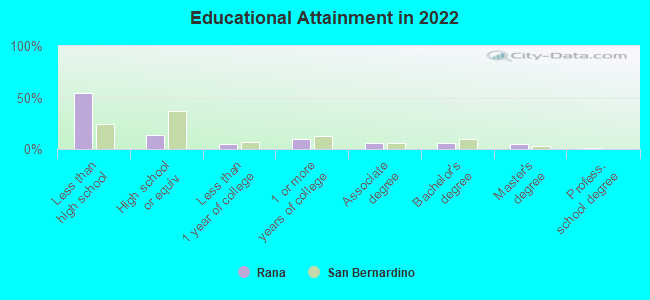
Education in this neighborhood (subdivision or community):
- Percentage of people 3 years and older in K-12 schools:
Rana: 31.3% San Bernardino: 20.4%
- Percentage of people 3 years and older in undergraduate colleges:
Rana: 5.4% San Bernardino: 5.8%
- Percentage of people 3 years and older in grad. or professional schools:
Rana: 8.0% San Bernardino: 0.8%
- Percentage of students K-12 enrolled in private schools:
Rana: 9.2% San Bernardino: 4.3%
Percentage of population below poverty level:
| Rana: | 17.0% |
| San Bernardino: | 17.5% |
Median year owner moved in (as recorded in 2022):
Median year renter moved in (as recorded in 2022):
| Rana: | 2040 |
| San Bernardino: | 2008 |
Median year renter moved in (as recorded in 2022):
| Rana: | 2052 |
| San Bernardino: | 2018 |
Percentage of married-couple families with both working:
| Rana: | 81.2% |
| San Bernardino: | 52.9% |
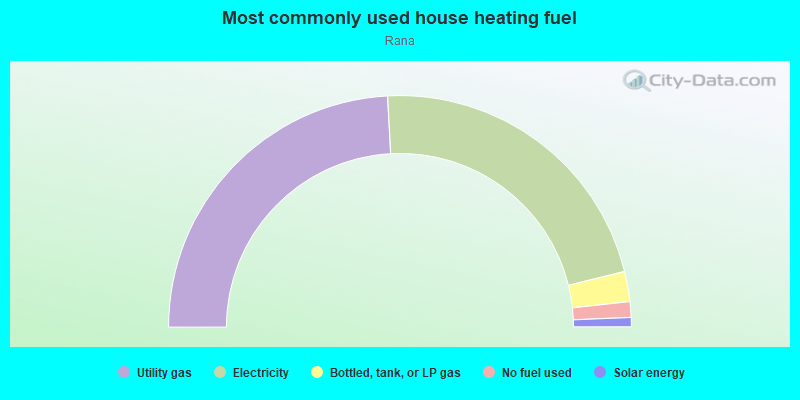
- 48.3%Utility gas
- 44.0%Electricity
- 4.2%Bottled, tank, or LP gas
- 2.2%No fuel used
- 1.3%Solar energy
Roads and streets:
N Jantzen Dr
Length: 0.25 miles
Direction: N-S
Address range: 1500 to 1799
Direction: N-S
Address range: 1500 to 1799
North Virginia Dr
Length: 0.25 miles
Direction: N-S
Address range: 1500 to 1799
Direction: N-S
Address range: 1500 to 1799
N Rialto Ave
Length: 0.25 miles
Direction: N-S
Address range: 1500 to 1799
Direction: N-S
Address range: 1500 to 1799
N Riverside Ave (Riverside Ave)
Length: 0.25 miles
Direction: N-S
Address range: 1500 to 1799
Direction: N-S
Address range: 1500 to 1799
N Mount Vernon Ave
Length: 0.25 miles
Direction: N-S
Address range: 1600 to 1799
Direction: N-S
Address range: 1600 to 1799
E Citrus St
Length: 0.25 miles
Direction: E-W
Address range: 500 to 799
Direction: E-W
Address range: 500 to 799
Johnston St (E Johnston St)
Length: 0.25 miles
Direction: E-W
Address range: 500 to 699
Direction: E-W
Address range: 500 to 699
S Mount Vernon Ave
Length: 0.18 miles
Direction: N-S
Address range: 550 to 799
Direction: N-S
Address range: 550 to 799