Pleasant/Pearl St. Neighborhood (Pleasant and Pearl) neighborhood in Hudson, Massachusetts (MA), 01749 detailed profile
Settings
X


Business Search - 14 Million verified businesses
Area: 0.057 square miles
Population: 194
Population density:
| Pleasant/Pearl St. Neighborhood (Pleasant and Pearl): | 3,399 people per square mile |
| Hudson: | 2,711 people per square mile |

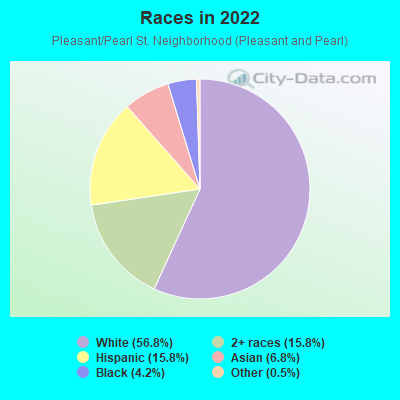
- 10856.8%White
- 3015.8%Two or more races
- 3015.8%Hispanic or Latino
- 136.8%Asian
- 84.2%Black
- 10.5%Some other race
Median household income in 2022:
| Pleasant/Pearl St. Neighborhood (Pleasant and Pearl): | $82,967 |
| Hudson: | $91,324 |
Distribution of median household income
![Distribution of median household income]()
- 9Less than $10,000
- 3$10,000 to $19,999
- 8$20,000 to $29,999
- 14$30,000 to $39,999
- 6$40,000 to $49,999
- 6$50,000 to $59,999
- 11$60,000 to $74,999
- 10$75,000 to $99,999
- 6$100,000 to $124,999
- 6$125,000 to $149,999
- 8$150,000 to $199,999
- 7$200,000 or more

Distribution of owner-occupied house/condo value
![Distribution of owner-occupied house/condo value]()
- 12Less than $50,000
- 4$50,000 to $99,999
- 2$100,000 to $149,999
- 3$150,000 to $199,999
- 13$200,000 to $249,999
- 10$250,000 to $299,999
- 12$300,000 to $399,999
- 7$400,000 to $499,999
- 8$500,000 to $749,999
- 5$750,000 to $999,999
- 1$1,000,000 or more

Distribution of rent paid by renters
![Distribution of rent paid by renters]()
- 5$200 to $299
- 2$300 to $399
- 3$400 to $499
- 1$500 to $599
- 2$600 to $699
- 5$800 to $899
- 3$900 to $999
- 20$1,000 to $1,249
- 5$1,250 to $1,499
- 5$1,500 to $1,999
- 9$2,000 or more

Median rent in 2022:
| Pleasant/Pearl St. Neighborhood (Pleasant and Pearl): | $1,153 |
| Hudson: | $1,294 |
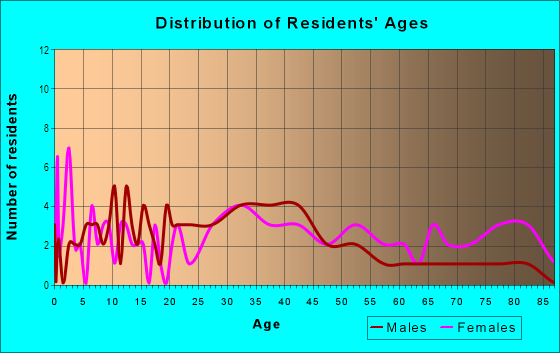
| Males: | 86 |
| Females: | 107 |
Males:
| This neighborhood: | 43.3 years |
| Whole city: | 42.3 years |
| This neighborhood: | 46.2 years |
| Whole city: | 46.2 years |
Average household size:
| Pleasant/Pearl St. Neighborhood (Pleasant and Pearl): | 2.3 people |
| Hudson: | 2.4 people |
Percentage of family households:
| Pleasant/Pearl St. Neighborhood (Pleasant and Pearl): | 33.1% |
| Hudson: | 43.1% |
| Here: | 39.9% |
| Hudson: | 48.9% |
Percentage of married-couple families with children (among all households):
| Pleasant/Pearl St. Neighborhood (Pleasant and Pearl): | 41.5% |
| Hudson: | 36.2% |
Percentage of single-mother households (among all households):
| Pleasant/Pearl St. Neighborhood (Pleasant and Pearl): | 3.4% |
| Hudson: | 4.6% |
Percentage of never married males 15 years old and over:
Percentage of never married females 15 years old and over:
| Pleasant/Pearl St. Neighborhood (Pleasant and Pearl): | 16.3% |
| Hudson: | 17.1% |
Percentage of never married females 15 years old and over:
| Pleasant/Pearl St. Neighborhood (Pleasant and Pearl): | 27.8% |
| place: | 15.3% |
Percentage of people that speak English not well or not at all:
| Pleasant/Pearl St. Neighborhood (Pleasant and Pearl): | 19.6% |
| Hudson: | 5.5% |
Percentage of people born in this state:
Percentage of people born in another U.S. state:
Percentage of native residents but born outside the U.S.:
Percentage of foreign born residents:
| Here: | 56.6% |
| Hudson: | 59.6% |
Percentage of people born in another U.S. state:
| Pleasant/Pearl St. Neighborhood (Pleasant and Pearl): | 22.0% |
| Hudson: | 20.3% |
Percentage of native residents but born outside the U.S.:
| Here: | 0.4% |
| place: | 1.1% |
Percentage of foreign born residents:
| Here: | 21.0% |
| Hudson: | 19.0% |
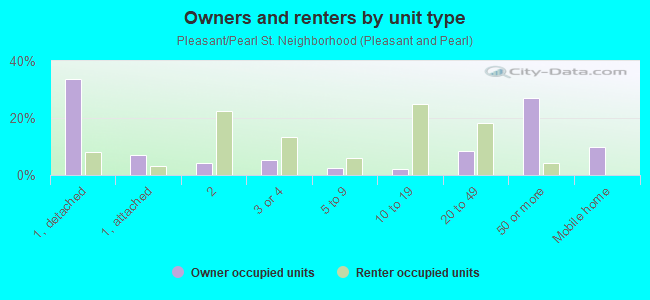
Owner-occupied
Renter-occupied

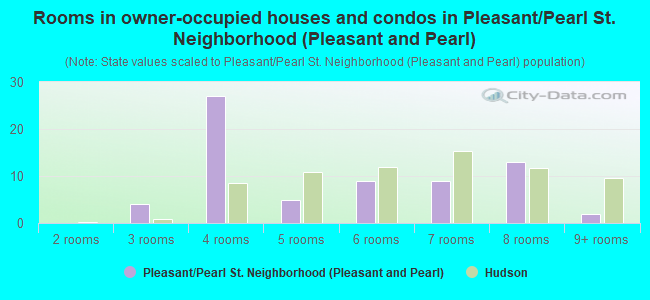
- Rooms in owner-occupied houses and condos in Pleasant/Pearl St. Neighborhood <
> - 01 room
- 02 rooms
- 43 rooms
- 274 rooms
- 55 rooms
- 96 rooms
- 97 rooms
- 138 rooms
- 29+ rooms
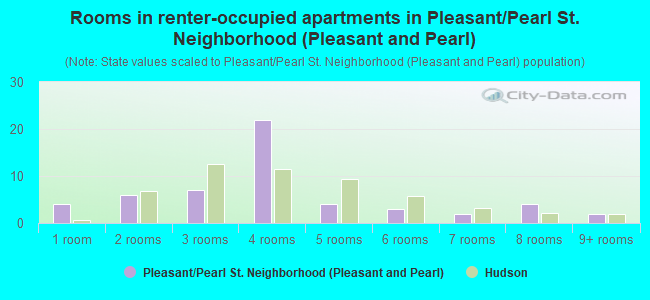
- Rooms in renter-occupied apartments in Pleasant/Pearl St. Neighborhood <
> - 41 room
- 62 rooms
- 73 rooms
- 224 rooms
- 45 rooms
- 36 rooms
- 27 rooms
- 48 rooms
- 29+ rooms
Owner-occupied
Renter-occupied
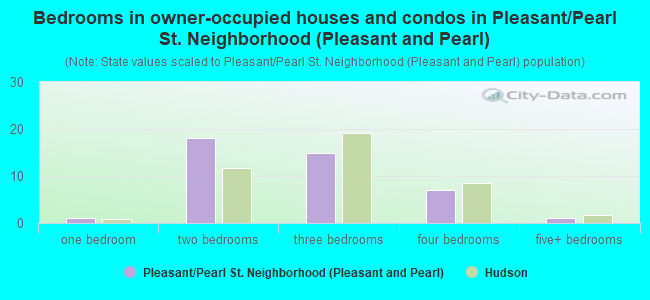
- Bedrooms in owner-occupied houses and condos in Pleasant/Pearl St. Neighborhood <
> - 0no bedroom
- 11 bedroom
- 182 bedrooms
- 153 bedrooms
- 74 bedrooms
- 15+ bedrooms
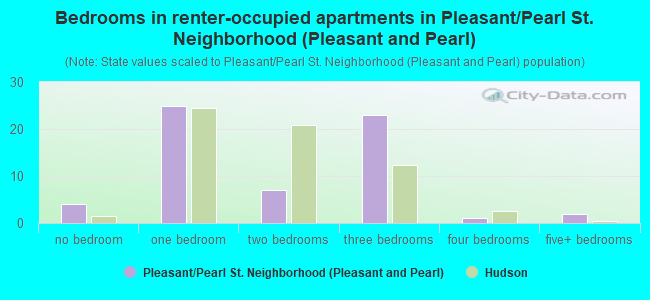
- Bedrooms in renter-occupied apartments in Pleasant/Pearl St. Neighborhood <
> - 4no bedroom
- 251 bedroom
- 72 bedrooms
- 233 bedrooms
- 14 bedrooms
- 25+ bedrooms
Average number of cars or other vehicles available in houses/condos:
Average number of cars or other vehicles available in apartments:
| This neighborhood: | 1.8 |
| Hudson: | 2.0 |
Average number of cars or other vehicles available in apartments:
| Here: | 1.6 |
| place: | 1.5 |
Percentage of units with a mortgage:
| Pleasant/Pearl St. Neighborhood (Pleasant and Pearl): | 35.8% |
| Hudson: | 58.3% |
Housing prices:
- Average estimated value of detached houses in 2022 (34.9% of all units):
Pleasant/Pearl St. Neighborhood (Pleasant and Pearl): $386,678 Hudson: $478,107
- Average estimated '22 value of housing units in 5-or-more-unit structures (30.1% of all units):
Pleasant/Pearl St. Neighborhood (Pleasant and Pearl): $179,315 Hudson: $281,865
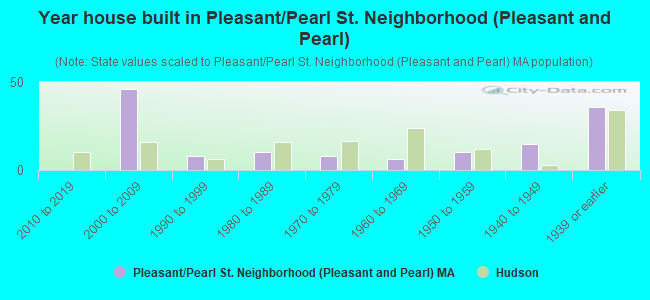
- Year house built in Pleasant/Pearl St. Neighborhood <
> - 02020 or later
- 02010 to 2019
- 462000 to 2009
- 81990 to 1999
- 101980 to 1989
- 81970 to 1979
- 61960 to 1969
- 101950 to 1959
- 151940 to 1949
- 361939 or earlier
City-data.com crime index for place in 2020 (higher means more crime):
| City: | 42.8 |
| U.S. average: | 219.5 |
Travel time to work (commute)
![Travel time to work (commute)]()
- 2Less than 5 minutes
- 95 to 9 minutes
- 1010 to 14 minutes
- 815 to 19 minutes
- 720 to 24 minutes
- 425 to 29 minutes
- 1330 to 34 minutes
- 535 to 39 minutes
- 240 to 44 minutes
- 445 to 59 minutes
- 460 to 89 minutes
- 190 or more minutes

Means of transportation to work
![Means of transportation to work]()
- 49.5%48Drove a car alone
- 11.3%11Carpooled
- 2.1%2Subway or elevated rail
- 25.8%25Walked
- 8.3%8Other means
- 24.8%24Worked at home

Time leaving home to go to work
![Time leaving home to go to work]()
- 35:00 a.m. to 5:29 a.m.
- 75:30 a.m. to 5:59 a.m.
- 26:00 a.m. to 6:29 a.m.
- 76:30 a.m. to 6:59 a.m.
- 147:00 a.m. to 7:29 a.m.
- 117:30 a.m. to 7:59 a.m.
- 128:00 a.m. to 8:29 a.m.
- 38:30 a.m. to 8:59 a.m.
- 59:00 a.m. to 9:59 a.m.
- 210:00 a.m. to 10:59 a.m.
- 111:00 a.m. to 11:59 a.m.
- 312:00 p.m. to 3:59 p.m.
- 24:00 p.m. to 11:59 p.m.

Occupations of males:
- Percentage of males in management occupations (except farmers):
Here: 22.3% place: 17.6%
- Percentage of males in computer and mathematical occupations:
Here: 6.8% place: 4.5%
- Percentage of males in architecture and engineering occupations:
Here: 2.5% place: 6.5%
- Percentage of males in legal occupations:
Here: 7.9% place: 1.4%
- Percentage of males in arts, design, entertainment, sports, and media occupations:
Here: 7.6% place: 3.4%
- Percentage of males in healthcare practitioners and technical occupations:
Here: 2.3% place: 3.4%
- Percentage of males in service occupations:
Here: 27.3% place: 13.7%
- Percentage of males in sales and office occupations:
Here: 4.4% place: 17.7%
- Percentage of males in construction, extraction, and maintenance occupations:
Here: 1.2% place: 7.1%
- Percentage of males in production occupations:
Here: 3.6% place: 5.2%
- Percentage of males in transportation occupations:
Here: 15.1% place: 2.9%
Occupations of females:
- Percentage of females in management occupations (except farmers):
Here: 14.8% place: 14.7%
- Percentage of females in computer and mathematical occupations:
Here: 2.9% place: 2.3%
- Percentage of females in education, training, and library occupations:
Here: 13.5% place: 13.5%
- Percentage of females in arts, design, entertainment, sports, and media occupations:
Here: 10.1% place: 3.0%
- Percentage of females in healthcare practitioners and technical occupations:
Here: 8.1% place: 8.6%
- Percentage of females in service occupations:
Here: 22.9% place: 15.4%
- Percentage of females in sales and office occupations:
Here: 25.9% place: 21.7%
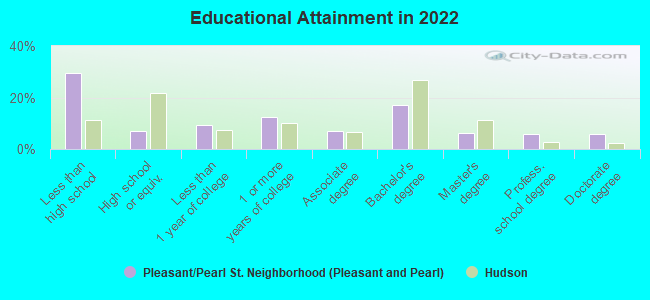
Education in this neighborhood (subdivision or community):
- Percentage of people 3 years and older in K-12 schools:
Pleasant/Pearl St. Neighborhood (Pleasant and Pearl): 24.6% Hudson: 14.6%
- Percentage of people 3 years and older in undergraduate colleges:
Pleasant/Pearl St. Neighborhood (Pleasant and Pearl): 2.1% Hudson: 3.3%
- Percentage of people 3 years and older in grad. or professional schools:
Pleasant/Pearl St. Neighborhood (Pleasant and Pearl): 1.1% Hudson: 1.8%
- Percentage of students K-12 enrolled in private schools:
Pleasant/Pearl St. Neighborhood (Pleasant and Pearl): 10.9% Hudson: 7.5%
Percentage of population below poverty level:
| Pleasant/Pearl St. Neighborhood (Pleasant and Pearl): | 9.0% |
| Hudson: | 6.8% |
Median year owner moved in (as recorded in 2022):
Median year renter moved in (as recorded in 2022):
| Pleasant/Pearl St. Neighborhood (Pleasant and Pearl): | 2006 |
| Hudson: | 2007 |
Median year renter moved in (as recorded in 2022):
| Pleasant/Pearl St. Neighborhood (Pleasant and Pearl): | 2014 |
| Hudson: | 2016 |
Percentage of married-couple families with both working:
| Pleasant/Pearl St. Neighborhood (Pleasant and Pearl): | 103.9% |
| Hudson: | 68.1% |
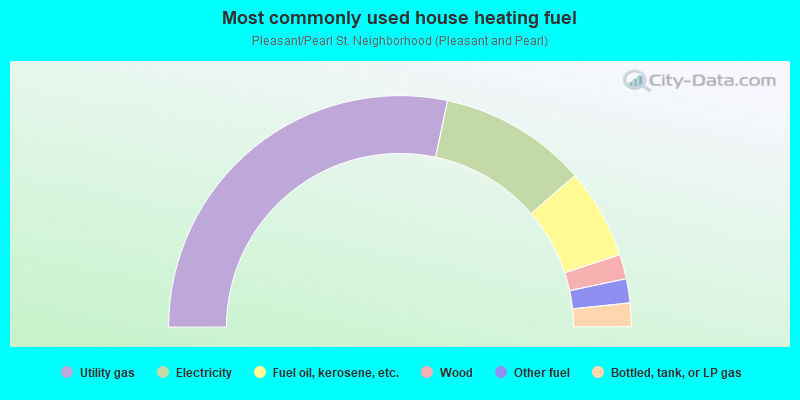
- 56.6%Utility gas
- 20.7%Electricity
- 12.6%Fuel oil, kerosene, etc.
- 3.4%Wood
- 3.4%Other fuel
- 3.3%Bottled, tank, or LP gas
Roads and streets:
Felton St
Length: 0.18 miles
Direction: N-S
Address range: 31 to 55
Direction: N-S
Address range: 31 to 55
Pleasant St
Length: 0.17 miles
Direction: E-W
Address range: 1 to 25
Direction: E-W
Address range: 1 to 25
Church St
Length: 0.10 miles
Direction: N-S
Address range: 31 to 99
Direction: N-S
Address range: 31 to 99
Pope St
Length: 0.10 miles
Direction: N-S
Address range: 34 to 99
Direction: N-S
Address range: 34 to 99