Playa Del Rey neighborhood in San Jose, California (CA), 95123 detailed profile
Settings
X

Business Search - 14 Million verified businesses
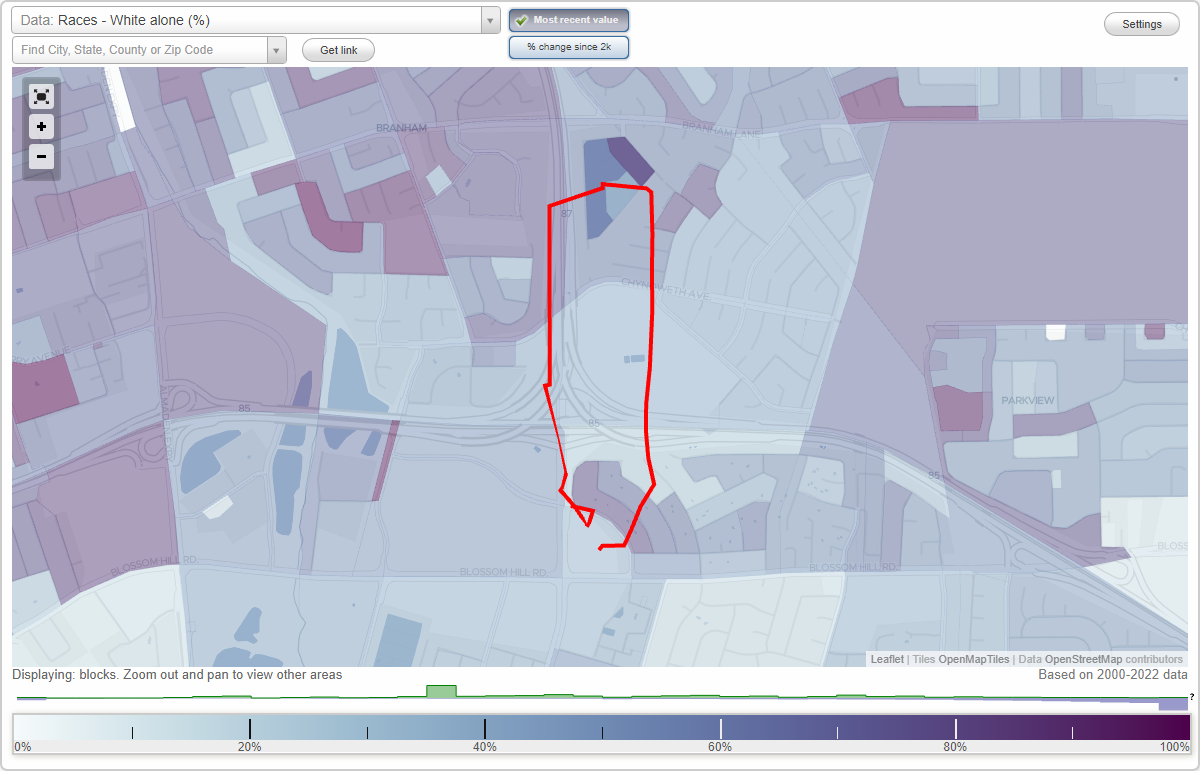
Area: 0.180 square miles
Population: 1,525
Population density:
| Playa Del Rey: | 8,465 people per square mile |
| San Jose: | 5,554 people per square mile |

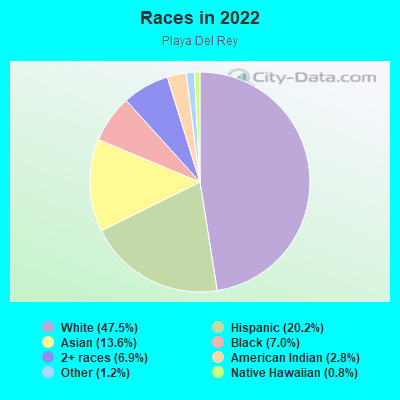
- 53034.6%Asian
- 51833.8%White
- 37524.4%Hispanic or Latino
- 1006.5%Two or more races
- 80.5%Black
- 30.2%Some other race
Median household income in 2022:
| Playa Del Rey: | $196,014 |
| San Jose: | $133,835 |
Distribution of median household income
![Distribution of median household income]()
- 17Less than $10,000
- 5$10,000 to $19,999
- 6$20,000 to $29,999
- 14$30,000 to $39,999
- 18$40,000 to $49,999
- 9$50,000 to $59,999
- 61$60,000 to $74,999
- 4$75,000 to $99,999
- 55$100,000 to $124,999
- 12$125,000 to $149,999
- 74$150,000 to $199,999
- 196$200,000 or more

Distribution of owner-occupied house/condo value
![Distribution of owner-occupied house/condo value]()
- 3$300,000 to $399,999
- 19$500,000 to $749,999
- 60$750,000 to $999,999
- 241$1,000,000 or more

Distribution of rent paid by renters
![Distribution of rent paid by renters]()
- 5Less than $100
- 7$500 to $599
- 3$1,000 to $1,249
- 15$1,250 to $1,499
- 28$1,500 to $1,999
- 109$2,000 or more

Median rent in 2022:
| Playa Del Rey: | $2,856 |
| San Jose: | $2,001 |
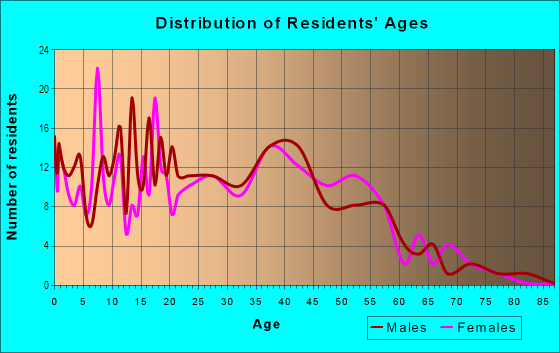
| Males: | 708 |
| Females: | 816 |
Males:
| This neighborhood: | 41.3 years |
| Whole city: | 37.6 years |
| This neighborhood: | 40.7 years |
| Whole city: | 39.1 years |
Average household size:
| Playa Del Rey: | 3.6 people |
| San Jose: | 2.9 people |
Percentage of family households:
| Playa Del Rey: | 68.1% |
| San Jose: | 49.9% |
| Here: | 85.7% |
| San Jose: | 53.0% |
Percentage of married-couple families with children (among all households):
| Playa Del Rey: | 25.9% |
| San Jose: | 25.8% |
Percentage of single-mother households (among all households):
| Playa Del Rey: | 1.7% |
| San Jose: | 5.2% |
Percentage of never married males 15 years old and over:
Percentage of never married females 15 years old and over:
| Playa Del Rey: | 12.3% |
| San Jose: | 20.9% |
Percentage of never married females 15 years old and over:
| Playa Del Rey: | 21.5% |
| city: | 16.7% |
Percentage of people that speak English not well or not at all:
| Playa Del Rey: | 18.0% |
| San Jose: | 11.4% |
Percentage of people born in this state:
Percentage of people born in another U.S. state:
Percentage of native residents but born outside the U.S.:
Percentage of foreign born residents:
| Here: | 50.1% |
| San Jose: | 46.1% |
Percentage of people born in another U.S. state:
| Playa Del Rey: | 13.2% |
| San Jose: | 10.4% |
Percentage of native residents but born outside the U.S.:
| Here: | 0.3% |
| city: | 1.7% |
Percentage of foreign born residents:
| Here: | 36.4% |
| San Jose: | 41.8% |
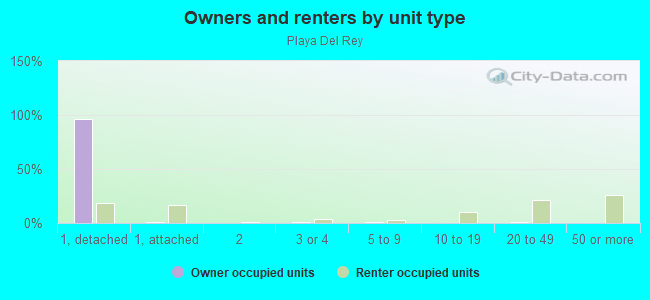
Owner-occupied
Renter-occupied

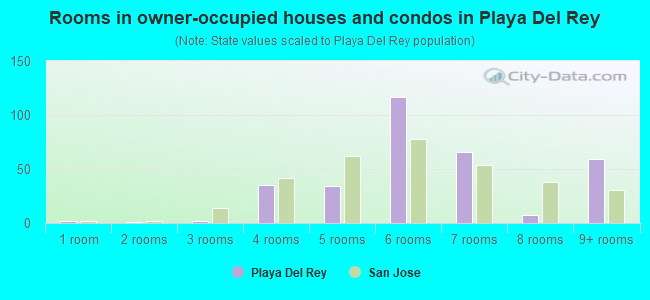
- Rooms in owner-occupied houses and condos in Playa Del Rey
- 21 room
- 12 rooms
- 23 rooms
- 354 rooms
- 345 rooms
- 1176 rooms
- 667 rooms
- 78 rooms
- 599+ rooms
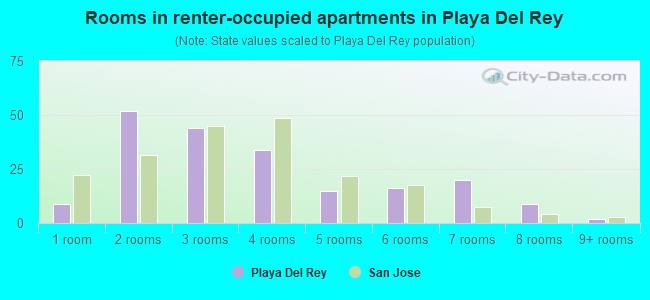
- Rooms in renter-occupied apartments in Playa Del Rey
- 91 room
- 522 rooms
- 443 rooms
- 344 rooms
- 155 rooms
- 166 rooms
- 207 rooms
- 98 rooms
- 29+ rooms
Owner-occupied
Renter-occupied
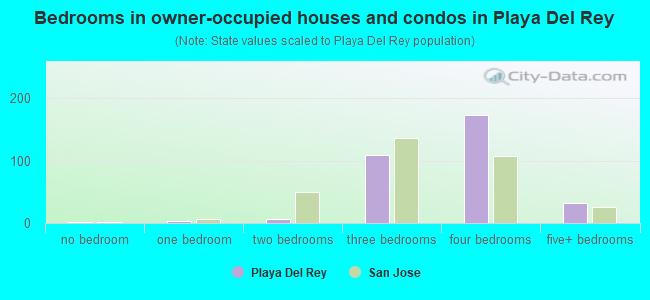
- Bedrooms in owner-occupied houses and condos in Playa Del Rey
- 2no bedroom
- 41 bedroom
- 62 bedrooms
- 1093 bedrooms
- 1734 bedrooms
- 325+ bedrooms
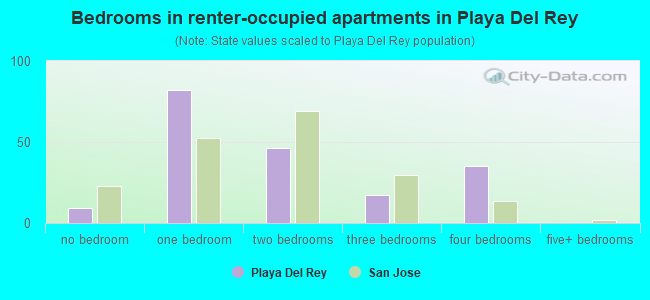
- Bedrooms in renter-occupied apartments in Playa Del Rey
- 9no bedroom
- 821 bedroom
- 462 bedrooms
- 173 bedrooms
- 354 bedrooms
- 05+ bedrooms
Average number of cars or other vehicles available in houses/condos:
Average number of cars or other vehicles available in apartments:
| This neighborhood: | 2.5 |
| San Jose: | 2.3 |
Average number of cars or other vehicles available in apartments:
| Here: | 2.4 |
| city: | 1.6 |
Percentage of units with a mortgage:
| Playa Del Rey: | 73.5% |
| San Jose: | 66.9% |
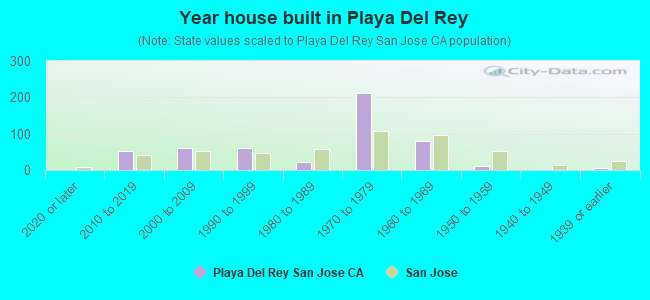
- Year house built in Playa Del Rey
- 02020 or later
- 512010 to 2019
- 602000 to 2009
- 611990 to 1999
- 211980 to 1989
- 2121970 to 1979
- 791960 to 1969
- 121950 to 1959
- 01940 to 1949
- 51939 or earlier
City-data.com crime index for city in 2020 (higher means more crime):
| City: | 268.4 |
| U.S. average: | 219.5 |
Travel time to work (commute)
![Travel time to work (commute)]()
- 315 to 9 minutes
- 8210 to 14 minutes
- 4015 to 19 minutes
- 3720 to 24 minutes
- 2325 to 29 minutes
- 6330 to 34 minutes
- 1335 to 39 minutes
- 4040 to 44 minutes
- 6445 to 59 minutes
- 9260 to 89 minutes
- 1590 or more minutes

Means of transportation to work
![Means of transportation to work]()
- 57.7%495Drove a car alone
- 9.3%80Carpooled
- 5.2%45Bus
- 0.5%4Subway or elevated rail
- 0.1%1Bicycle
- 0.3%3Walked
- 1.0%9Other means
- 26.0%223Worked at home

Time leaving home to go to work
![Time leaving home to go to work]()
- 812:00 a.m. to 4:59 a.m.
- 85:00 a.m. to 5:29 a.m.
- 185:30 a.m. to 5:59 a.m.
- 496:30 a.m. to 6:59 a.m.
- 627:00 a.m. to 7:29 a.m.
- 577:30 a.m. to 7:59 a.m.
- 718:00 a.m. to 8:29 a.m.
- 398:30 a.m. to 8:59 a.m.
- 479:00 a.m. to 9:59 a.m.
- 5710:00 a.m. to 10:59 a.m.
- 411:00 a.m. to 11:59 a.m.
- 2412:00 p.m. to 3:59 p.m.
- 364:00 p.m. to 11:59 p.m.

Occupations of males:
- Percentage of males in management occupations (except farmers):
Here: 10.8% city: 13.0%
- Percentage of males in business and financial operations occupations:
Here: 6.6% city: 4.6%
- Percentage of males in computer and mathematical occupations:
Here: 19.3% city: 13.6%
- Percentage of males in architecture and engineering occupations:
Here: 6.7% city: 10.2%
- Percentage of males in arts, design, entertainment, sports, and media occupations:
Here: 1.2% city: 1.8%
- Percentage of males in service occupations:
Here: 14.7% city: 12.7%
- Percentage of males in sales and office occupations:
Here: 14.0% city: 12.8%
- Percentage of males in construction, extraction, and maintenance occupations:
Here: 7.1% city: 7.8%
- Percentage of males in production occupations:
Here: 9.3% city: 5.5%
- Percentage of males in transportation occupations:
Here: 4.0% city: 3.6%
- Percentage of males in material moving occupations:
Here: 1.2% city: 3.1%
Occupations of females:
- Percentage of females in management occupations (except farmers):
Here: 19.2% city: 11.0%
- Percentage of females in business and financial operations occupations:
Here: 4.9% city: 8.6%
- Percentage of females in computer and mathematical occupations:
Here: 10.0% city: 5.4%
- Percentage of females in life, physical, and social science occupations:
Here: 1.4% city: 1.7%
- Percentage of females in community and social services occupations:
Here: 4.1% city: 1.8%
- Percentage of females in education, training, and library occupations:
Here: 11.1% city: 8.1%
- Percentage of females in healthcare practitioners and technical occupations:
Here: 5.9% city: 6.8%
- Percentage of females in service occupations:
Here: 24.6% city: 21.7%
- Percentage of females in sales and office occupations:
Here: 16.0% city: 22.0%
- Percentage of females in material moving occupations:
Here: 2.0% city: 1.5%
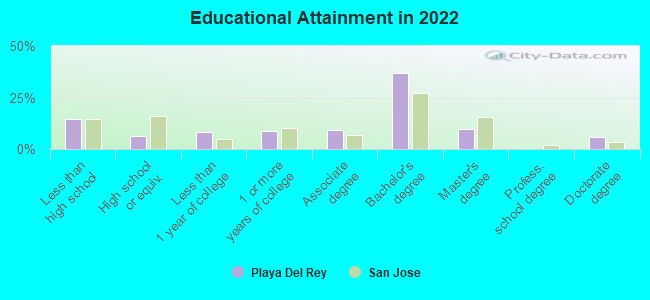
Education in this neighborhood (subdivision or community):
- Percentage of people 3 years and older in K-12 schools:
Playa Del Rey: 16.6% San Jose: 16.1%
- Percentage of people 3 years and older in undergraduate colleges:
Playa Del Rey: 6.0% San Jose: 6.5%
- Percentage of people 3 years and older in grad. or professional schools:
Playa Del Rey: 2.1% San Jose: 2.0%
- Percentage of students K-12 enrolled in private schools:
Playa Del Rey: 10.0% San Jose: 14.9%
Percentage of population below poverty level:
| Playa Del Rey: | 6.0% |
| San Jose: | 9.0% |
Median year owner moved in (as recorded in 2022):
Median year renter moved in (as recorded in 2022):
| Playa Del Rey: | 2006 |
| San Jose: | 2008 |
Median year renter moved in (as recorded in 2022):
| Playa Del Rey: | 2014 |
| San Jose: | 2020 |
Percentage of married-couple families with both working:
| Playa Del Rey: | 77.0% |
| San Jose: | 72.5% |
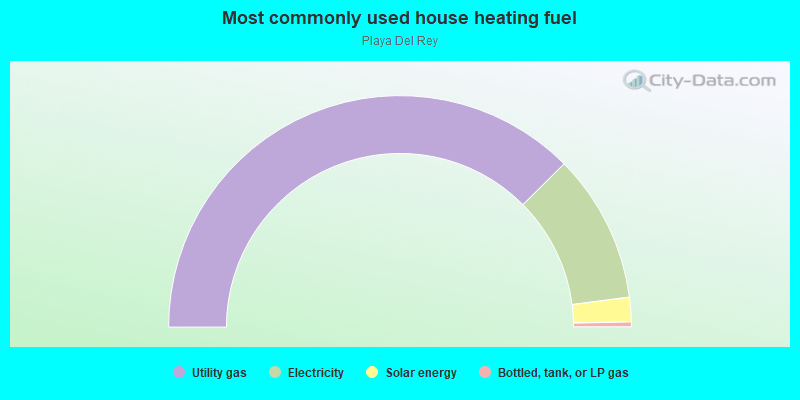
- 75.1%Utility gas
- 20.8%Electricity
- 3.4%Solar energy
- 0.7%Bottled, tank, or LP gas
Roads and streets:
Glenburry Way
Length: 0.69 miles
Directions: E-W, N-S, SE-NW
Address range: 500 to 5398
Directions: E-W, N-S, SE-NW
Address range: 500 to 5398
Stardust Ln
Length: 0.29 miles
Directions: E-W, N-S, SW-NE
Address range: 700 to 799
Directions: E-W, N-S, SW-NE
Address range: 700 to 799
Blossom Hill Rd
Length: 0.24 miles
Direction: E-W
Address range: 700 to 731
Direction: E-W
Address range: 700 to 731
Regent Park Dr
Length: 0.24 miles
Direction: E-W
Address range: 700 to 799
Direction: E-W
Address range: 700 to 799
Playa del Rey
Length: 0.23 miles
Directions: N-S, SE-NW
Address range: 5400 to 5569
Directions: N-S, SE-NW
Address range: 5400 to 5569
Sunny Oaks Dr
Length: 0.21 miles
Directions: E-W, N-S, SE-NW, SW-NE
Address range: 5500 to 5599
Directions: E-W, N-S, SE-NW, SW-NE
Address range: 5500 to 5599
Blairburry Way
Length: 0.19 miles
Directions: E-W, SE-NW
Address range: 500 to 599
Directions: E-W, SE-NW
Address range: 500 to 599
Deep Purple Way
Length: 0.18 miles
Directions: E-W, N-S, SE-NW
Address range: 5400 to 5599
Directions: E-W, N-S, SE-NW
Address range: 5400 to 5599
Starcrest Dr
Length: 0.16 miles
Directions: E-W, N-S, SE-NW
Address range: 5400 to 5499
Directions: E-W, N-S, SE-NW
Address range: 5400 to 5499
Cahalan Ave
Length: 0.15 miles
Directions: N-S, SW-NE
Address range: 5300 to 5599
Directions: N-S, SW-NE
Address range: 5300 to 5599
Dunsburry Ct
Length: 0.09 miles
Direction: N-S
Address range: 5500 to 5599
Direction: N-S
Address range: 5500 to 5599
Dunsburry Way
Length: 0.09 miles
Direction: N-S
Address range: 5500 to 5599
Direction: N-S
Address range: 5500 to 5599
Lochburry Ct
Length: 0.07 miles
Directions: E-W, SE-NW
Address range: 500 to 699
Directions: E-W, SE-NW
Address range: 500 to 699
Cadburry Ct
Length: 0.07 miles
Direction: E-W
Address range: 500 to 599
Direction: E-W
Address range: 500 to 599
Wedgewood Dr
Length: 0.07 miles
Direction: E-W
Address range: 700 to 779
Direction: E-W
Address range: 700 to 779
Bryce Dr
Length: 0.06 miles
Direction: SW-NE
Address range: 800 to 899
Direction: SW-NE
Address range: 800 to 899
Lyonburry Pl
Length: 0.06 miles
Directions: E-W, N-S, SW-NE
Address range: 500 to 699
Directions: E-W, N-S, SW-NE
Address range: 500 to 699
Wedgewood Ct
Length: 0.04 miles
Direction: N-S
Address range: 5500 to 5599
Direction: N-S
Address range: 5500 to 5599
Moonglow Ct
Length: 0.02 miles
Direction: SE-NW
Address range: 700 to 799
Direction: SE-NW
Address range: 700 to 799